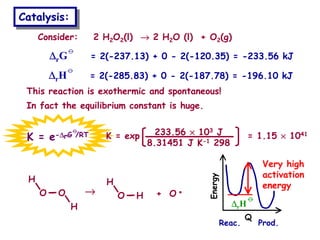
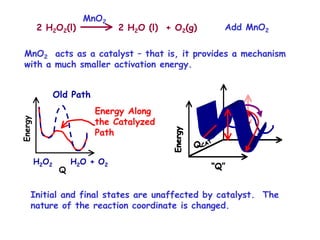
3-d plot
Contour
Plot
2 of 3
coordinates
Symmetric
Stretch
r
Energy
Simplest possible “reaction”
D + H2 →
→
→
→ HD + H
rHH
Energy
V(rHH) →
→
→
→ H2 as H - D
distance increases.
Potential Energy Surfaces Potential Energy Curves
Energy
Q
Energy
Q
Reac. Prod.
Endothermic
Energy
Q
Reac. Prod.
Exothermic
Ea
∆
∆
∆
∆E or
∆
∆
∆
∆H
∆
∆
∆
∆E or ∆
∆
∆
∆H
Ea
Activation Energy, Ea
Reaction Coordinate
Reaction Coordinate
Reac. Prod.
Temperature Dependence of a Reaction Rate Constant:
Velocity distribution in gas phase at temperature T
Nv
|v|
Critical velocity for reaction, vc
|v| < vo No
Reaction
|v| > vo
Reaction
T = 300 K
T = 500 K
T = 1000 K
T = 5000 K
The minimum energy that must be supplied
by a collision is the Activation Energy.
KE = ½mv2 ≥
≥
≥
≥ Ea
k = A∞
∞
∞
∞ e-Ea/kBT
|v|
Nv
Rate constant
Boltzmann
Constant
Pre-exponential
factor
Population with
KE sufficient
to drive the
reaction.
k = A∞
∞
∞
∞ e-Ea/kBT
Temperature
k
k = 0.9 A∞
∞
∞
∞
k
B
T
=
10
E
a
k
B
T
=
E
a
k = 0.36 A∞
∞
∞
∞
Ea = Joules/molecule
for Ea = Joules/mole
k = A∞
∞
∞
∞ e-Ea/RT
RT
=
10
E
a
RT
=
E
a
k = A∞
∞
∞
∞
A∞
∞
∞
∞ = maximum possible rate at
infinite temperature
ln k = -Ea 1 + ln A∞
∞
∞
∞
R T
A plot of ln k vs 1/T will be
linear.
ln
k 1/T
Intercept = ln A∞
∞
∞
∞
Slope = -Ea/R
Arrhenius Equation
Arrhenius Equation
Arrhenius Plot
Arrhenius Plot
Activation barriers are determined
experimentally by measuring the rate
over as large a range of T as possible.
But What About Entropy?
An exothermic reaction will occur
rapidly if Ea < RT and only very
slowly if Ea >> RT.
Potential
Energy
∆
∆
∆
∆E
Ea
∆
∆
∆
∆H
Reaction Coordinate
An endothermic reaction
will have a large activation
energy, Ea.
Reaction Coordinate
∆
∆
∆
∆H Ea
Potential
Energy Entropy accounts for the
number of different
states that contribute all
along the reaction path.
We plot Gibbs energy
along reaction coordinate
to account for entropy.
Gibbs
Energy
∆
∆
∆
∆Gŧ
∆
∆
∆
∆rG
Reaction Coordinate
∆
∆
∆
∆Gŧ
is the free energy or
Gibbs energy of activation.
= kBTe∆
∆
∆
∆Sŧ/R e-∆
∆
∆
∆Hŧ/RT
h
= kBT e-(∆
∆
∆
∆Hŧ-T∆
∆
∆
∆Sŧ)/RT
h
k = kBT e-∆
∆
∆
∆Gŧ/RT
h
Pre-exponential
factor A∞
∞
∞
∞
k
h = Planck’s Constant
∆
∆
∆
∆Sŧ = Entropy of Activation
∆
∆
∆
∆Hŧ = Enthalpy of Activation ⇒
⇒
⇒
⇒ microscopic Ea
Sample Problem:
Sample Problem:
Sample Problem:
If a reaction doubles its rate when the temperature is increased
from 305 K to 315 K, what is the activation energy?
k = A∞
∞
∞
∞ e-Ea/RT
k(315 K) = A∞
∞
∞
∞ e-Ea/R(315 K) = 2
k(305 K) A∞
∞
∞
∞ e-Ea/R(305 K)
2 = e-Ea(1/305 – 1/315)/R
A∞
∞
∞
∞ is approximately T independent
ln2 = -Ea(1/305 – 1/315)/R
Ea = ln2 (8.3145 J mol-1 K-1) 10-3 kJ
0.0001041 K-1 J
= 55.4 kJ/mol
Catalysis:
Catalysis:
Catalysis:
Consider: 2 H2O2(l) →
→
→
→ 2 H2O (l) + O2(g)
∆
∆
∆
∆rG
∅
∅
∅
∅
= 2(-237.13) + 0 - 2(-120.35) = -233.56 kJ
∆
∆
∆
∆rH
∅
∅
∅
∅
= 2(-285.83) + 0 - 2(-187.78) = -196.10 kJ
In fact the equilibrium constant is huge.
K = e-∆
∆
∆
∆rG /RT
∅
∅
∅
∅
K = exp = 1.15 ×
×
×
× 1041
233.56 ×
×
×
× 103 J
8.31451 J K-1 298
Energy Q
Reac. Prod.
H
O – O
H
→
→
→
→
H
O – H + O •
•
•
•
∆
∆
∆
∆rH
∅
∅
∅
∅
Very high
activation
energy
This reaction is exothermic and spontaneous!
2 H2O2(l) 2 H2O (l) + O2(g)
MnO2
Add MnO2
MnO2 acts as a catalyst – that is, it provides a mechanism
with a much smaller activation energy.
Old Path
Energy Along
the Catalyzed
Path
Energy
Q
H2O + O2
H2O2
Initial and final states are unaffected by catalyst. The
nature of the reaction coordinate is changed.
“Q”
Energy
QCAT
“Q”
Energy
QCAT
Catalyst is in a different phase than reactants.
Heterogeneous Catalysis:
Usually a solid surface catalyzing gas or liquid
phase reactions.
Homogeneous Catalysis:
Catalyst is in the same phase as the reactants.
Usually in liquid solution.
Rhodium, Platinum, Zeolites, Metal Oxides, …
Complexes of Rhodium and Platinum, Enzymes,
Strong Acids, …
Examples:
Examples:
2 H2O2(l) 2 H2O (l) + O2(g)
Catalase
In the presence of Catalase
Manganese Catalase in certain Lactobacillus type bacteria.

Lec39post.pdf

  • 1.
    3-d plot Contour Plot 2 of3 coordinates Symmetric Stretch r Energy Simplest possible “reaction” D + H2 → → → → HD + H rHH Energy V(rHH) → → → → H2 as H - D distance increases. Potential Energy Surfaces Potential Energy Curves Energy Q Energy Q Reac. Prod. Endothermic Energy Q Reac. Prod. Exothermic Ea ∆ ∆ ∆ ∆E or ∆ ∆ ∆ ∆H ∆ ∆ ∆ ∆E or ∆ ∆ ∆ ∆H Ea Activation Energy, Ea Activation Energy, Ea Reaction Coordinate Reaction Coordinate Reac. Prod.
  • 2.
    Temperature Dependence ofa Reaction Rate Constant: Temperature Dependence of a Reaction Rate Constant: Velocity distribution in gas phase at temperature T Nv |v| Critical velocity for reaction, vc |v| < vo No Reaction |v| > vo Reaction T = 300 K T = 500 K T = 1000 K T = 5000 K The minimum energy that must be supplied by a collision is the Activation Energy. KE = ½mv2 ≥ ≥ ≥ ≥ Ea k = A∞ ∞ ∞ ∞ e-Ea/kBT |v| Nv Rate constant Boltzmann Constant Pre-exponential factor Population with KE sufficient to drive the reaction.
  • 3.
    k = A∞ ∞ ∞ ∞e-Ea/kBT Temperature k k = 0.9 A∞ ∞ ∞ ∞ k B T = 10 E a k B T = E a k = 0.36 A∞ ∞ ∞ ∞ Ea = Joules/molecule for Ea = Joules/mole k = A∞ ∞ ∞ ∞ e-Ea/RT RT = 10 E a RT = E a k = A∞ ∞ ∞ ∞ A∞ ∞ ∞ ∞ = maximum possible rate at infinite temperature ln k = -Ea 1 + ln A∞ ∞ ∞ ∞ R T A plot of ln k vs 1/T will be linear. ln k 1/T Intercept = ln A∞ ∞ ∞ ∞ Slope = -Ea/R Arrhenius Equation Arrhenius Equation Arrhenius Plot Arrhenius Plot Activation barriers are determined experimentally by measuring the rate over as large a range of T as possible.
  • 4.
    But What AboutEntropy? But What About Entropy? An exothermic reaction will occur rapidly if Ea < RT and only very slowly if Ea >> RT. Potential Energy ∆ ∆ ∆ ∆E Ea ∆ ∆ ∆ ∆H Reaction Coordinate An endothermic reaction will have a large activation energy, Ea. Reaction Coordinate ∆ ∆ ∆ ∆H Ea Potential Energy Entropy accounts for the number of different states that contribute all along the reaction path.
  • 5.
    We plot Gibbsenergy along reaction coordinate to account for entropy. Gibbs Energy ∆ ∆ ∆ ∆Gŧ ∆ ∆ ∆ ∆rG Reaction Coordinate ∆ ∆ ∆ ∆Gŧ is the free energy or Gibbs energy of activation. = kBTe∆ ∆ ∆ ∆Sŧ/R e-∆ ∆ ∆ ∆Hŧ/RT h = kBT e-(∆ ∆ ∆ ∆Hŧ-T∆ ∆ ∆ ∆Sŧ)/RT h k = kBT e-∆ ∆ ∆ ∆Gŧ/RT h Pre-exponential factor A∞ ∞ ∞ ∞ k h = Planck’s Constant ∆ ∆ ∆ ∆Sŧ = Entropy of Activation ∆ ∆ ∆ ∆Hŧ = Enthalpy of Activation ⇒ ⇒ ⇒ ⇒ microscopic Ea
  • 6.
    Sample Problem: Sample Problem: SampleProblem: If a reaction doubles its rate when the temperature is increased from 305 K to 315 K, what is the activation energy? k = A∞ ∞ ∞ ∞ e-Ea/RT k(315 K) = A∞ ∞ ∞ ∞ e-Ea/R(315 K) = 2 k(305 K) A∞ ∞ ∞ ∞ e-Ea/R(305 K) 2 = e-Ea(1/305 – 1/315)/R A∞ ∞ ∞ ∞ is approximately T independent ln2 = -Ea(1/305 – 1/315)/R Ea = ln2 (8.3145 J mol-1 K-1) 10-3 kJ 0.0001041 K-1 J = 55.4 kJ/mol
  • 7.
    Catalysis: Catalysis: Catalysis: Consider: 2 H2O2(l)→ → → → 2 H2O (l) + O2(g) ∆ ∆ ∆ ∆rG ∅ ∅ ∅ ∅ = 2(-237.13) + 0 - 2(-120.35) = -233.56 kJ ∆ ∆ ∆ ∆rH ∅ ∅ ∅ ∅ = 2(-285.83) + 0 - 2(-187.78) = -196.10 kJ In fact the equilibrium constant is huge. K = e-∆ ∆ ∆ ∆rG /RT ∅ ∅ ∅ ∅ K = exp = 1.15 × × × × 1041 233.56 × × × × 103 J 8.31451 J K-1 298 Energy Q Reac. Prod. H O – O H → → → → H O – H + O • • • • ∆ ∆ ∆ ∆rH ∅ ∅ ∅ ∅ Very high activation energy This reaction is exothermic and spontaneous!
  • 8.
    2 H2O2(l) 2H2O (l) + O2(g) MnO2 Add MnO2 MnO2 acts as a catalyst – that is, it provides a mechanism with a much smaller activation energy. Old Path Energy Along the Catalyzed Path Energy Q H2O + O2 H2O2 Initial and final states are unaffected by catalyst. The nature of the reaction coordinate is changed. “Q” Energy QCAT “Q” Energy QCAT
  • 9.
    Catalyst is ina different phase than reactants. Heterogeneous Catalysis: Heterogeneous Catalysis: Usually a solid surface catalyzing gas or liquid phase reactions. Homogeneous Catalysis: Homogeneous Catalysis: Catalyst is in the same phase as the reactants. Usually in liquid solution. Rhodium, Platinum, Zeolites, Metal Oxides, … Complexes of Rhodium and Platinum, Enzymes, Strong Acids, … Examples: Examples: 2 H2O2(l) 2 H2O (l) + O2(g) Catalase In the presence of Catalase Manganese Catalase in certain Lactobacillus type bacteria.