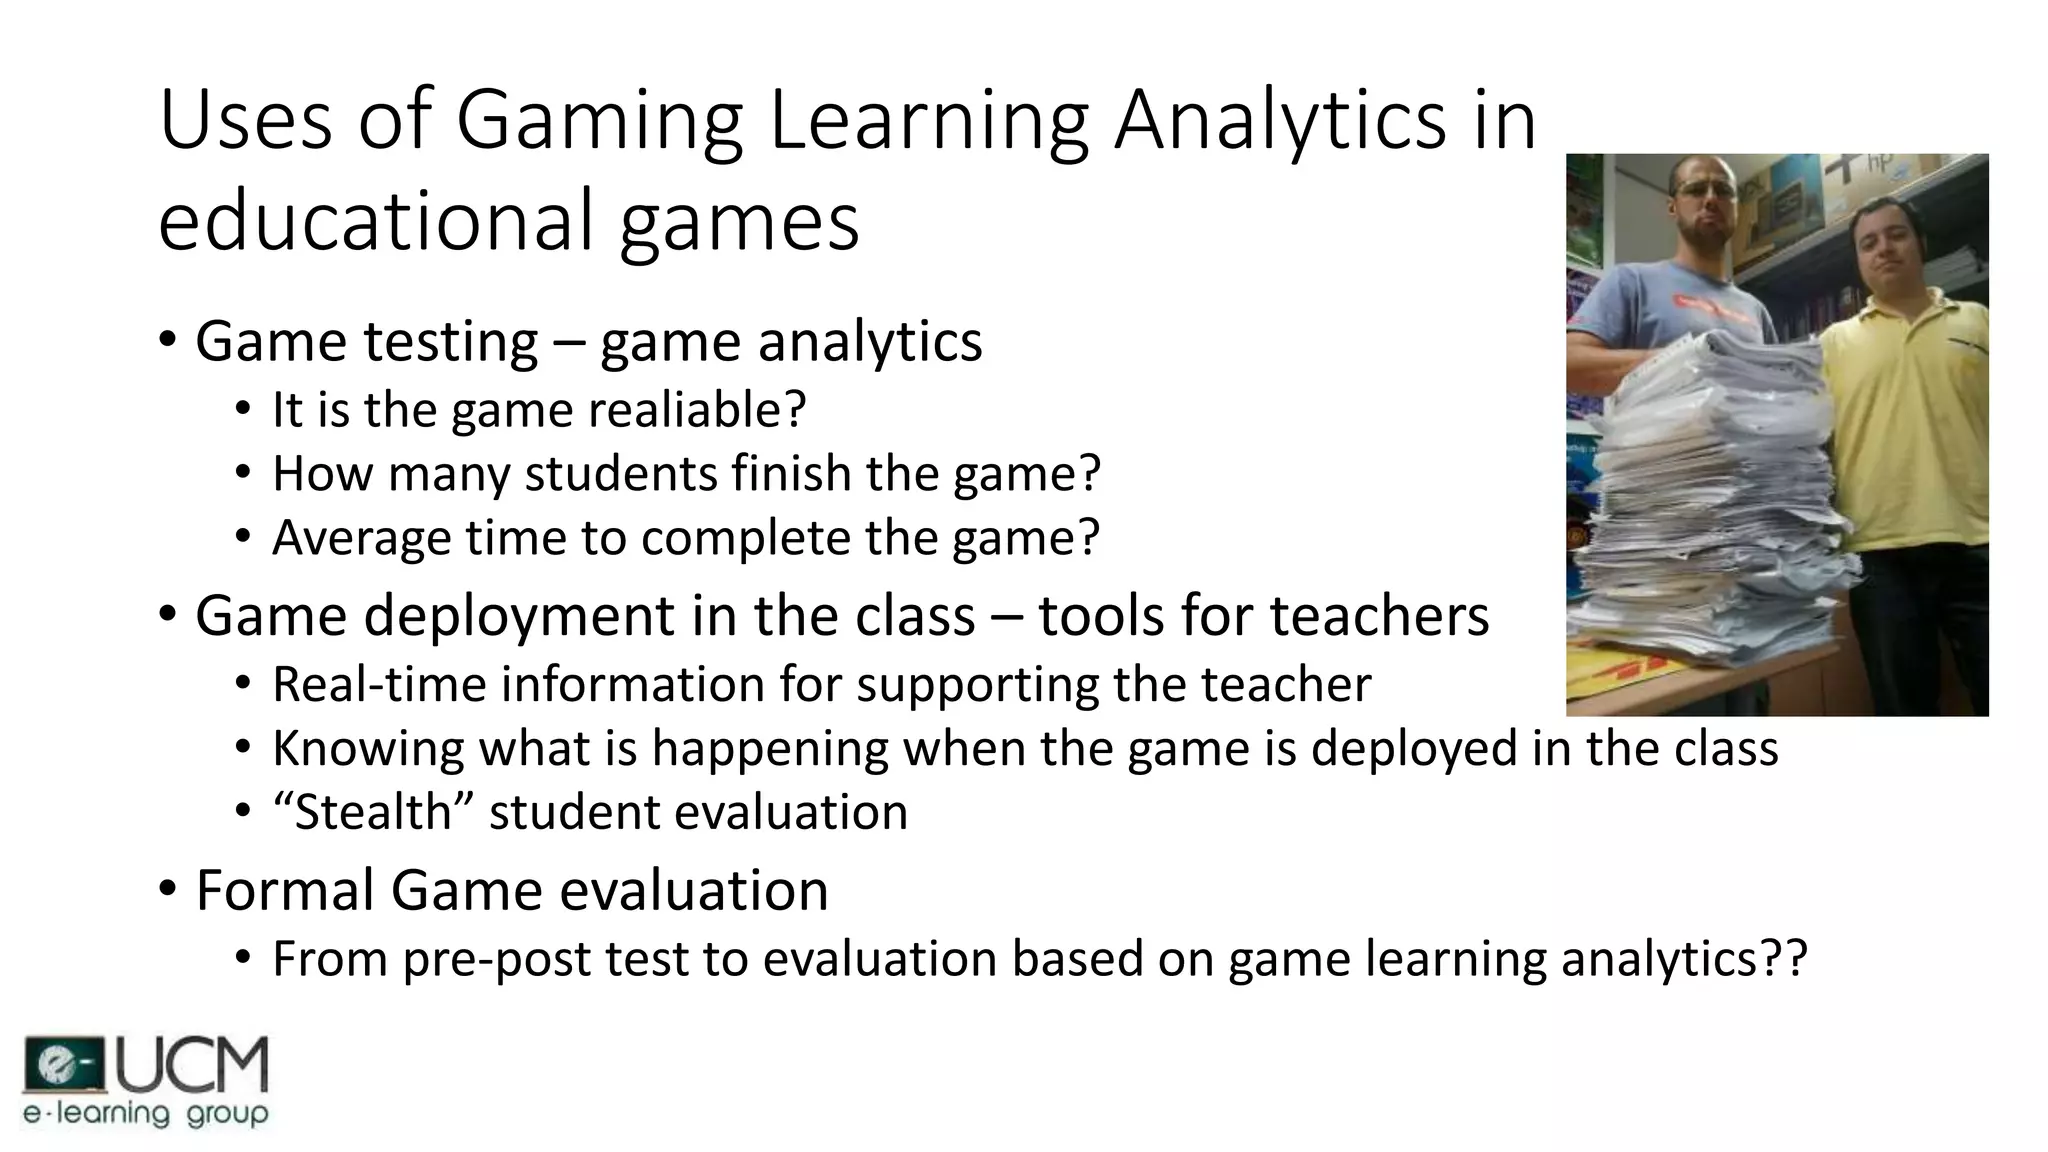
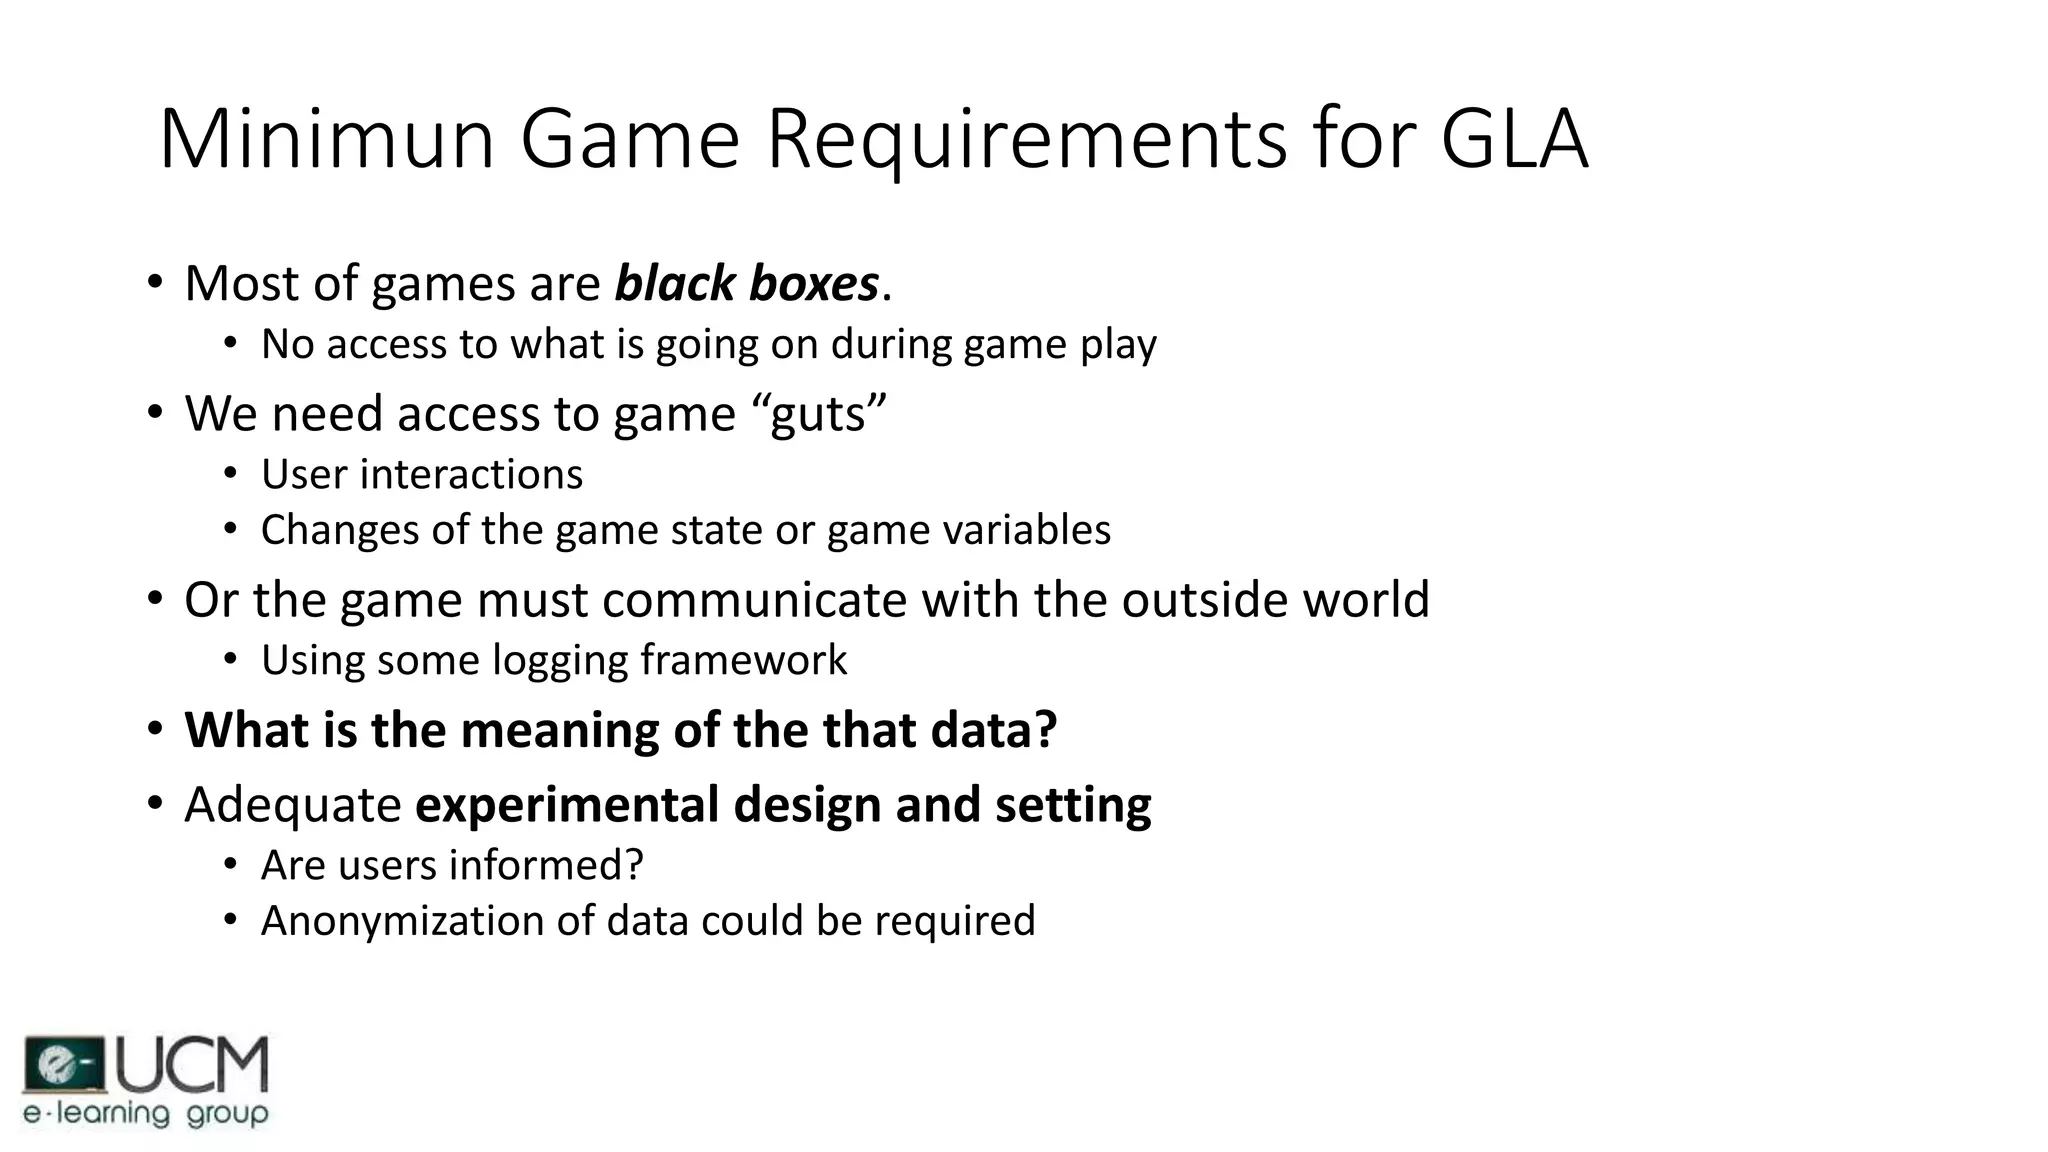
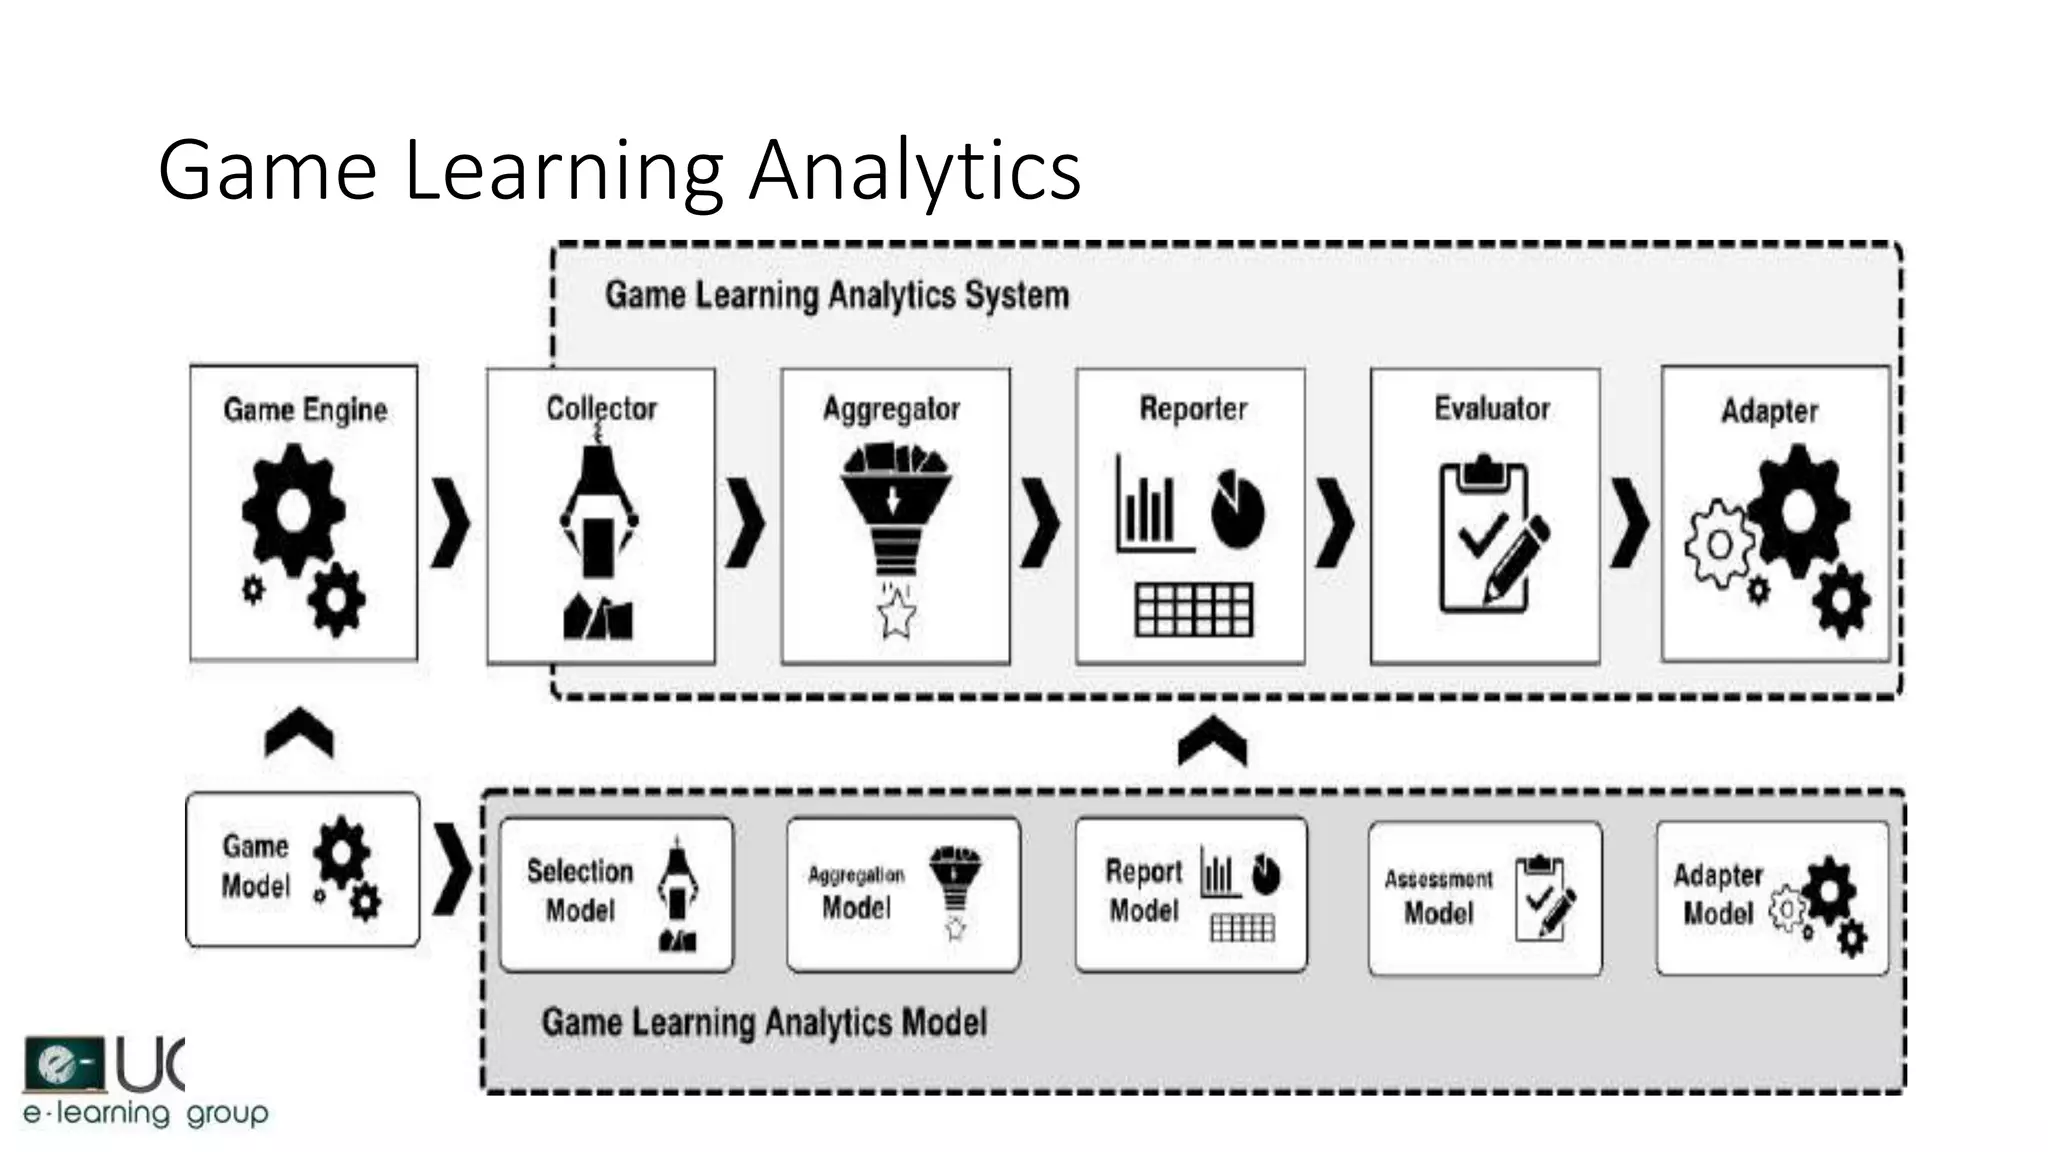
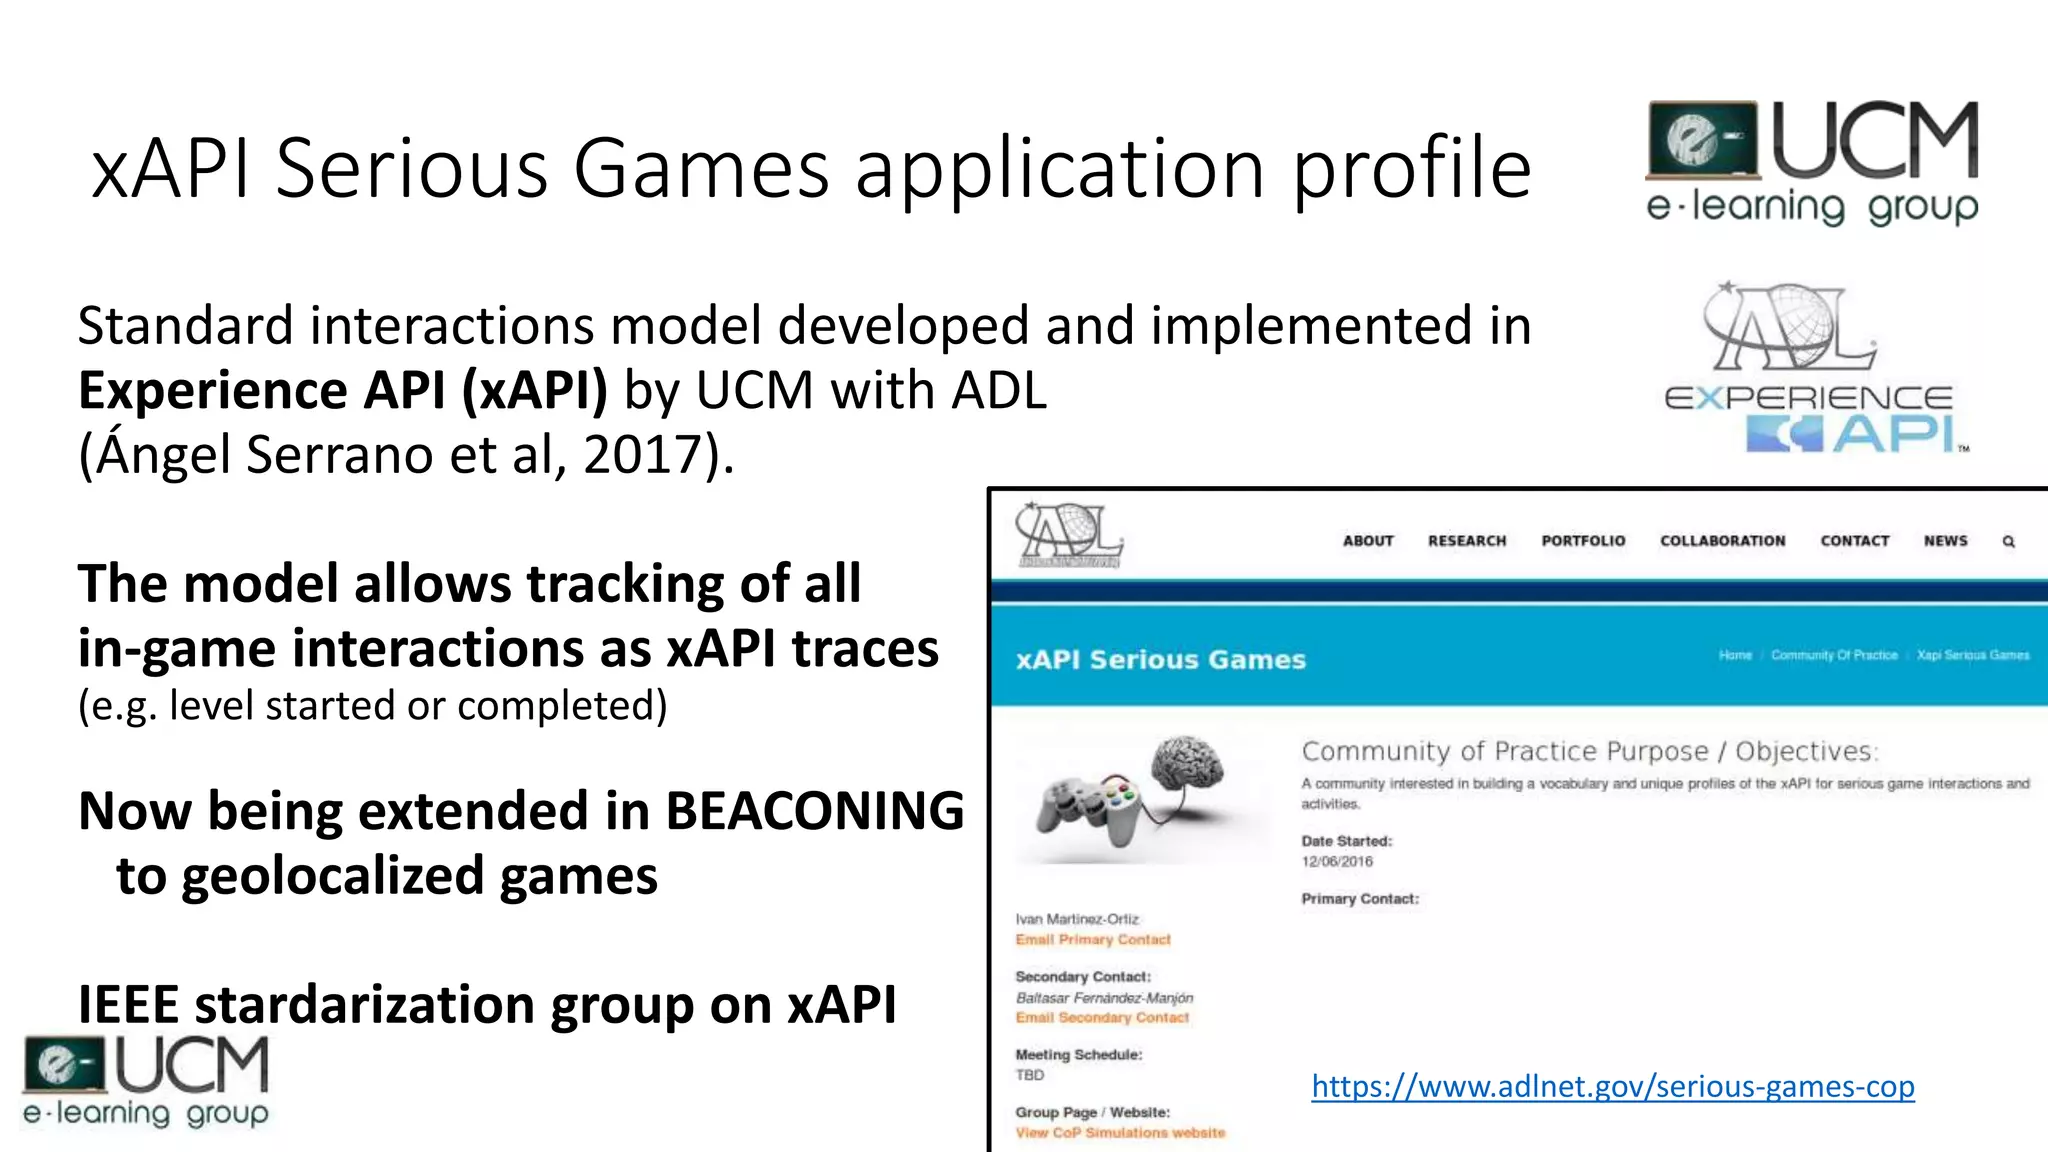
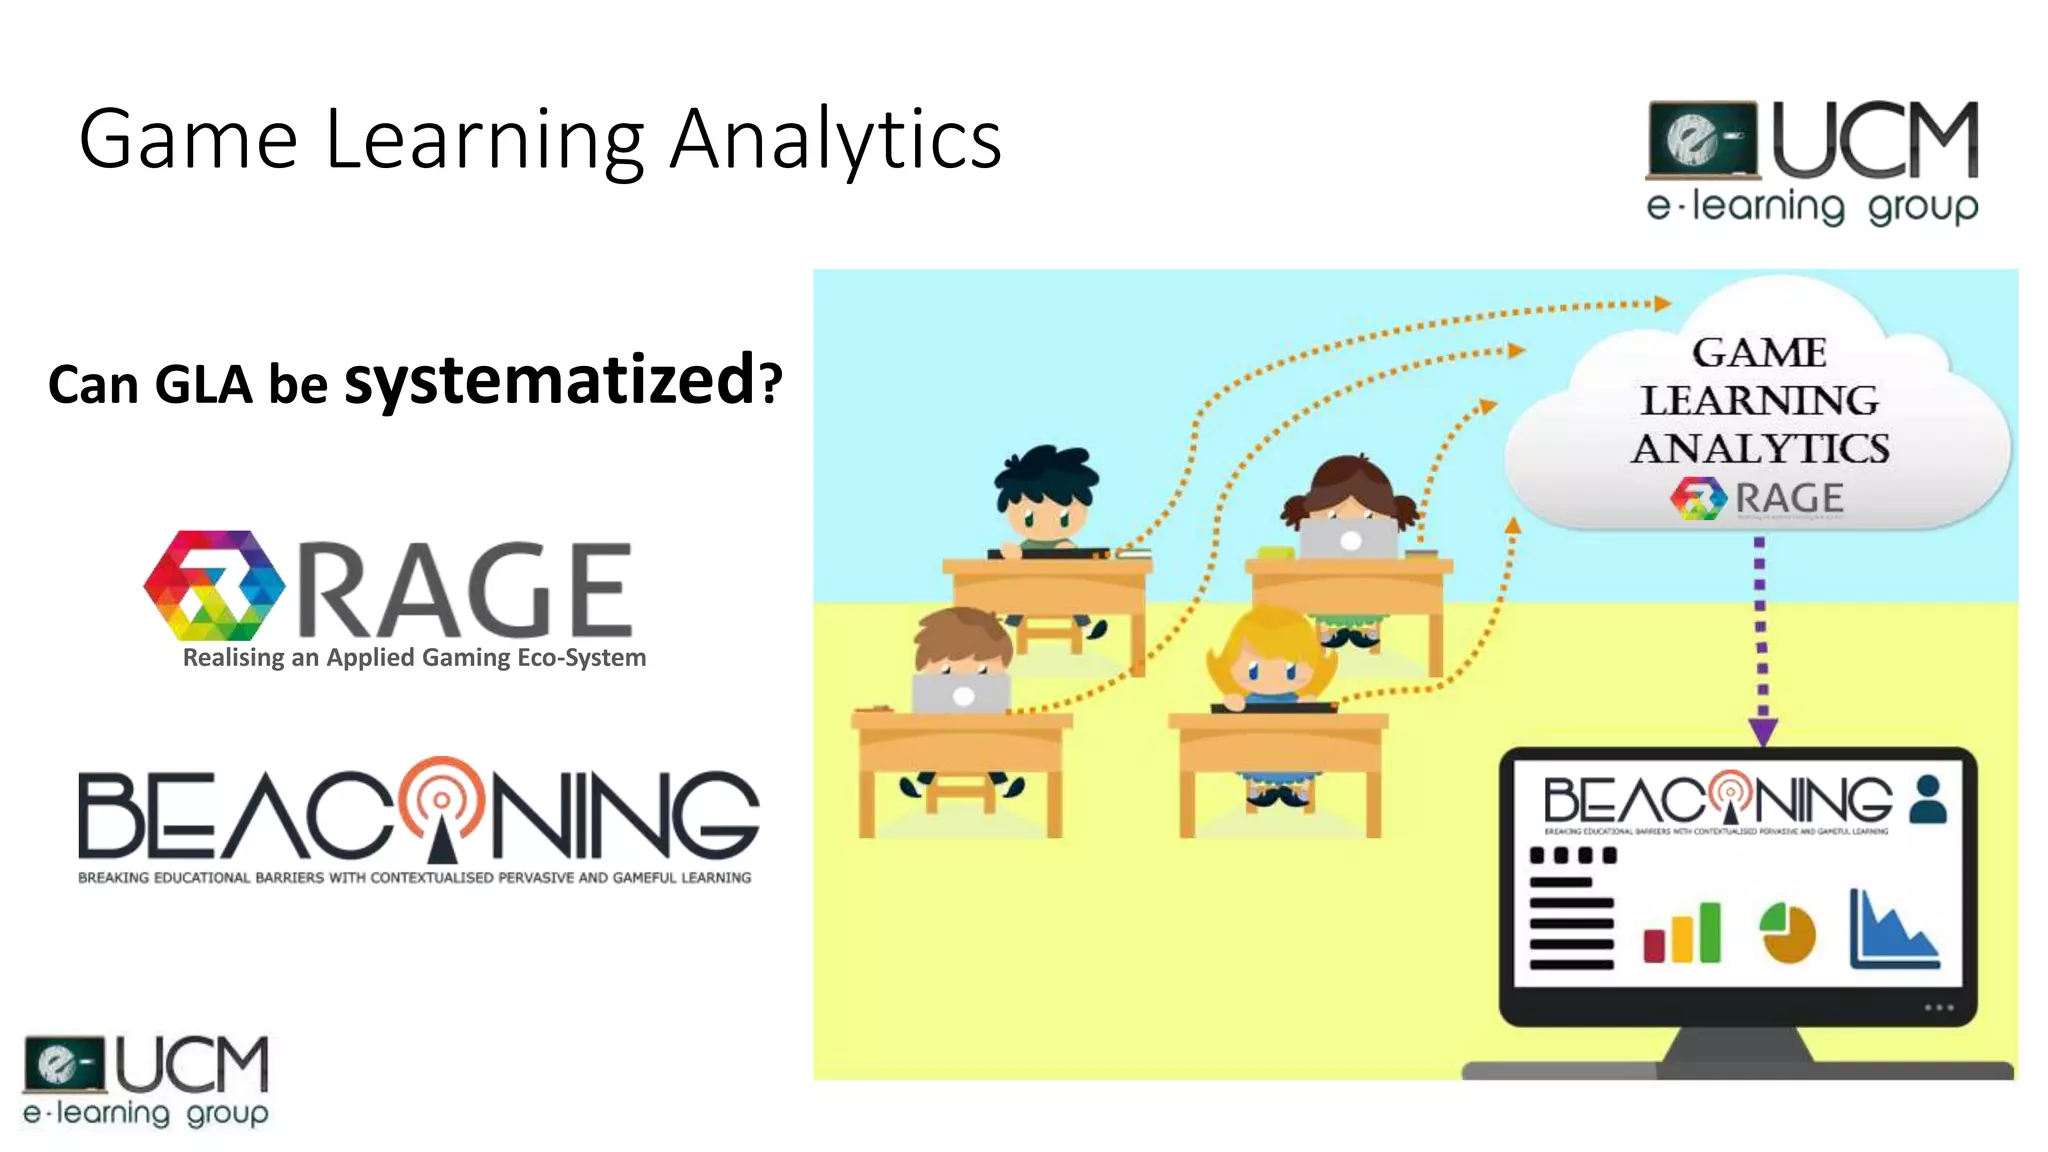
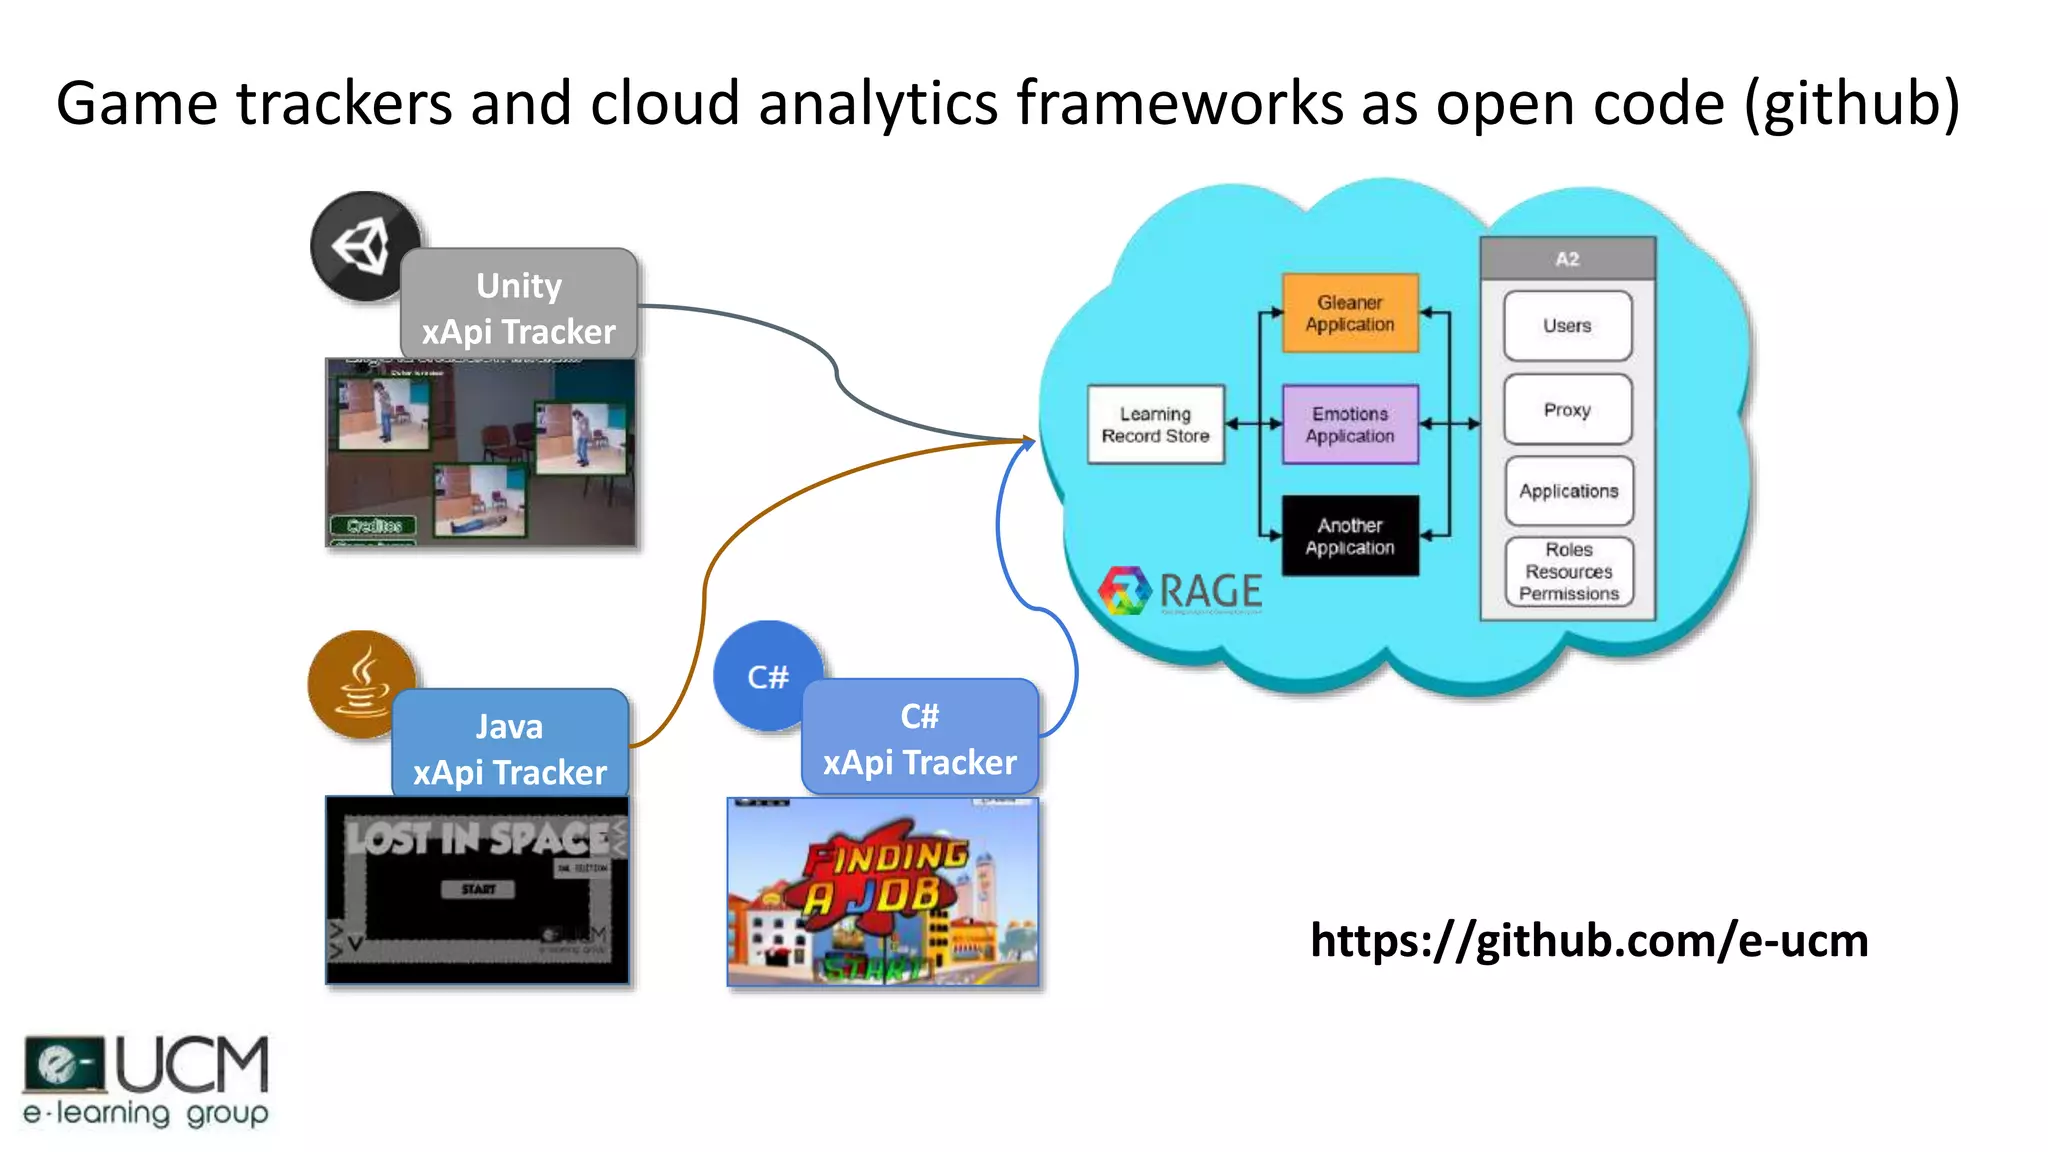
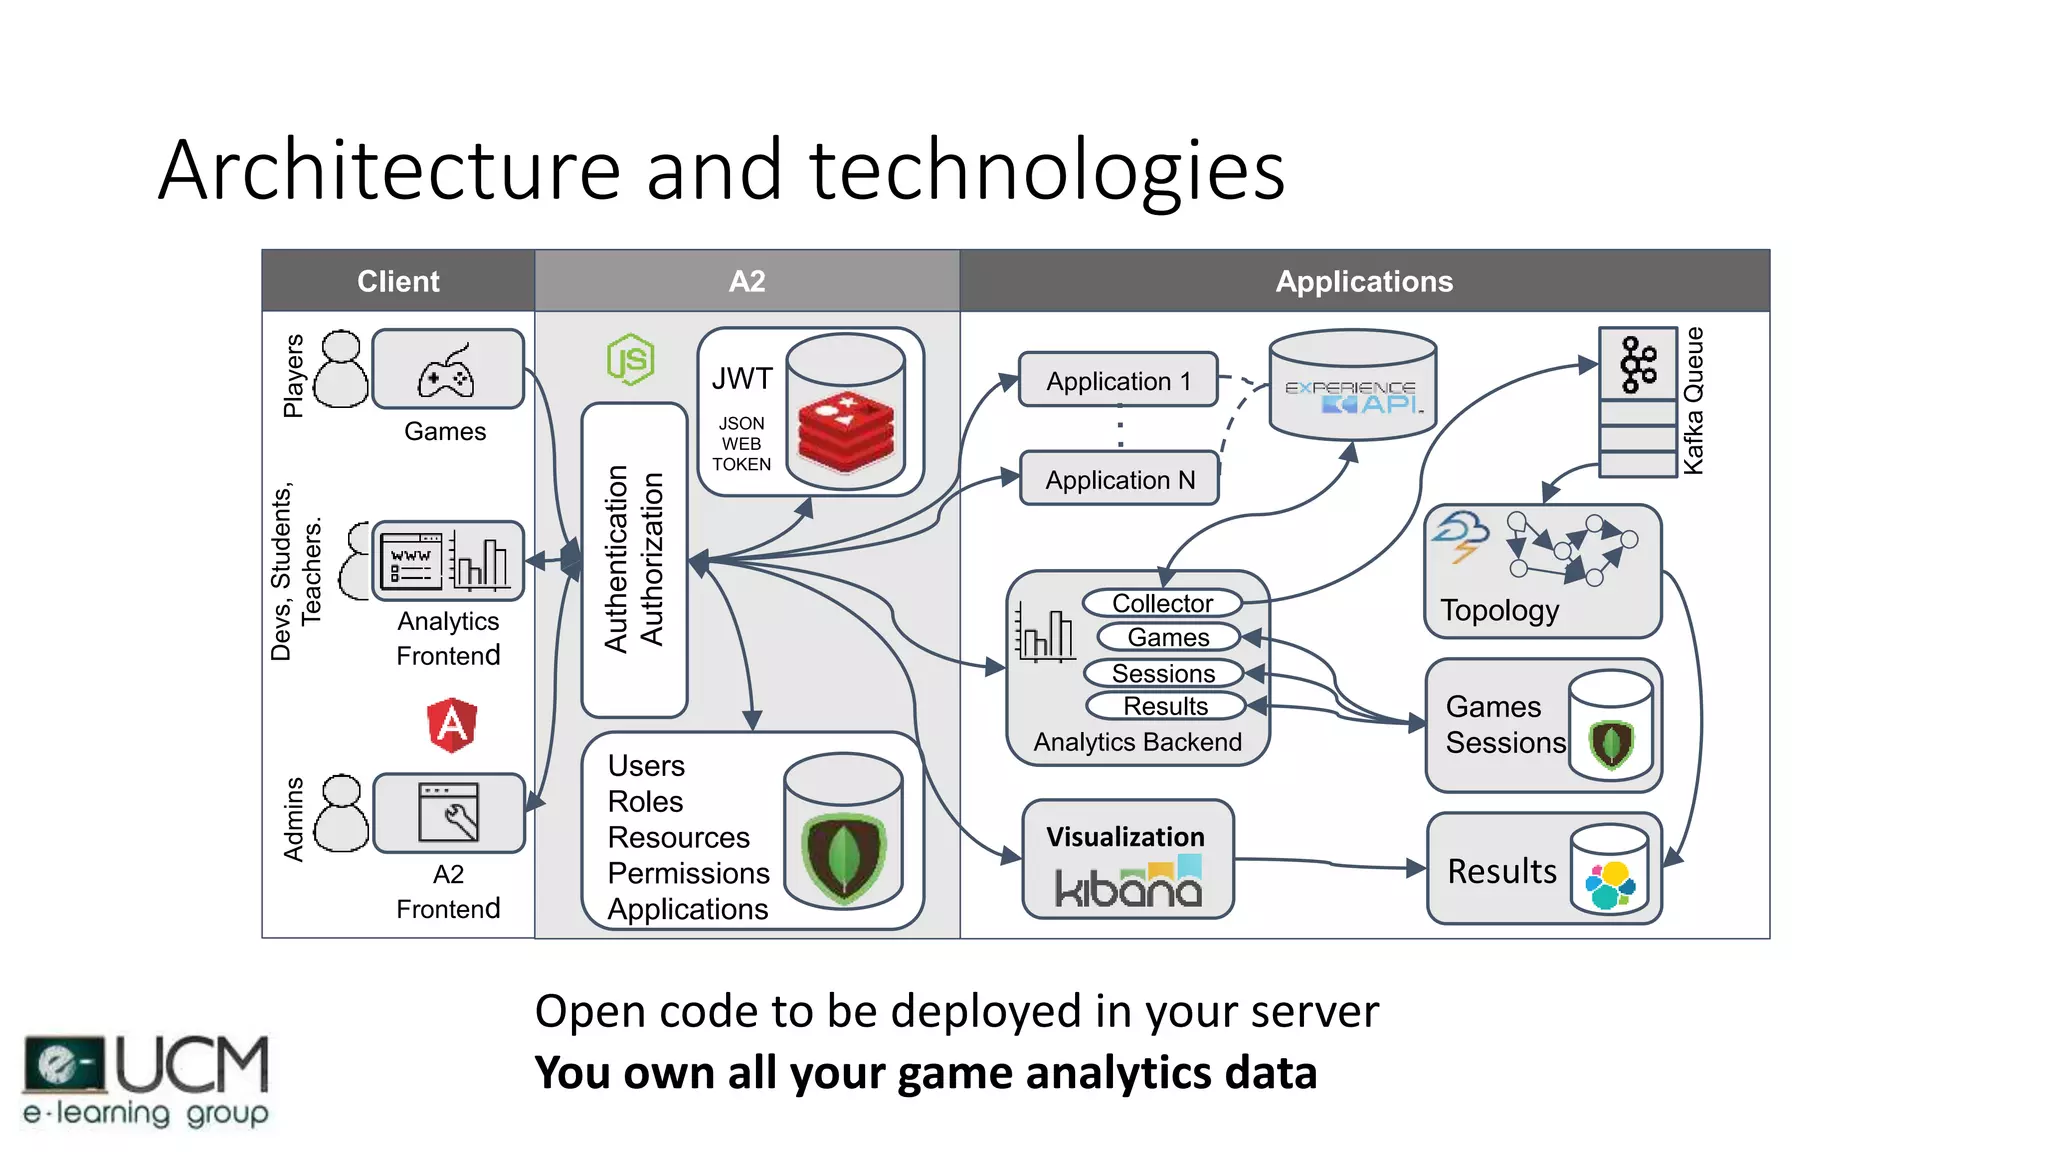
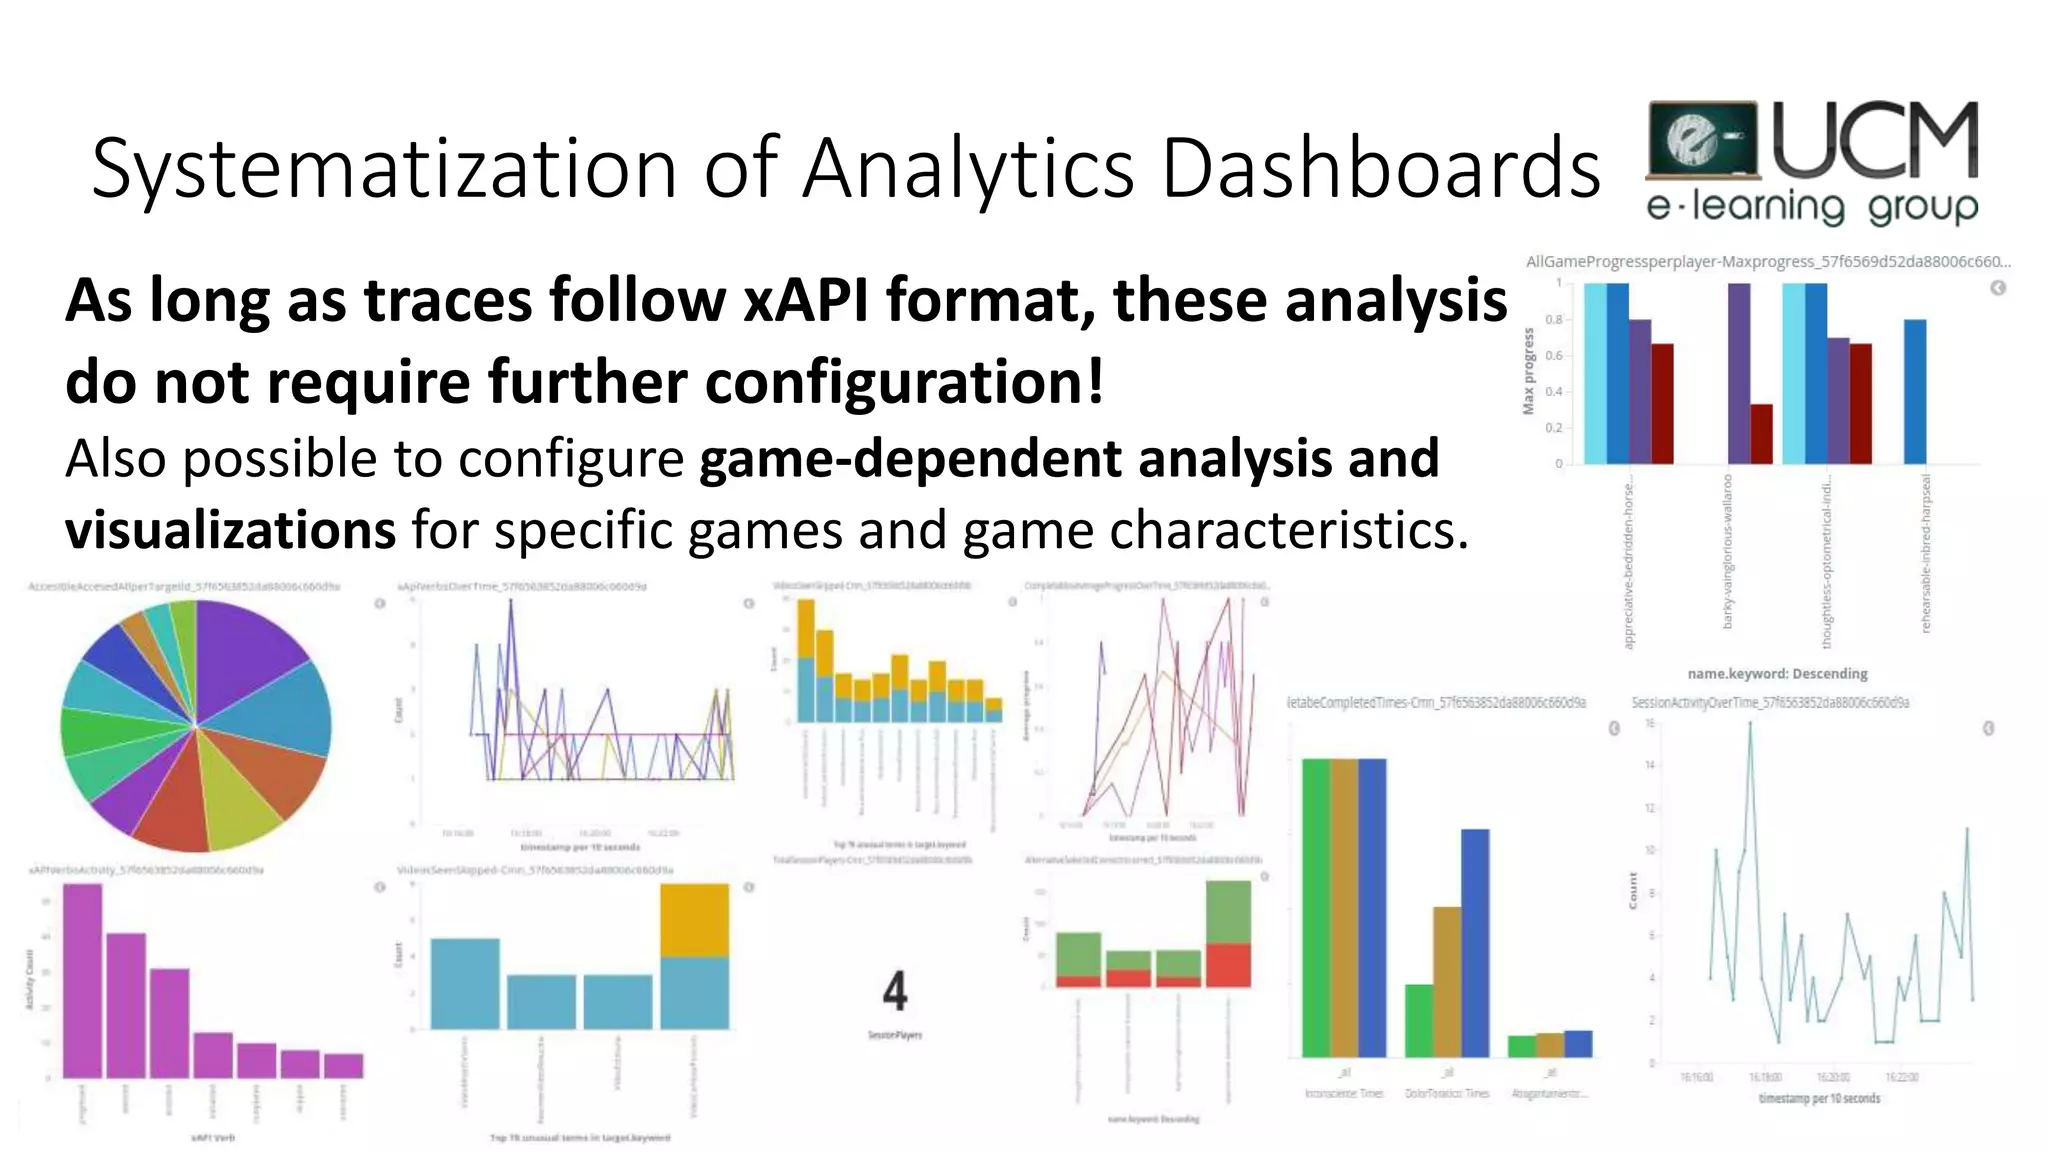
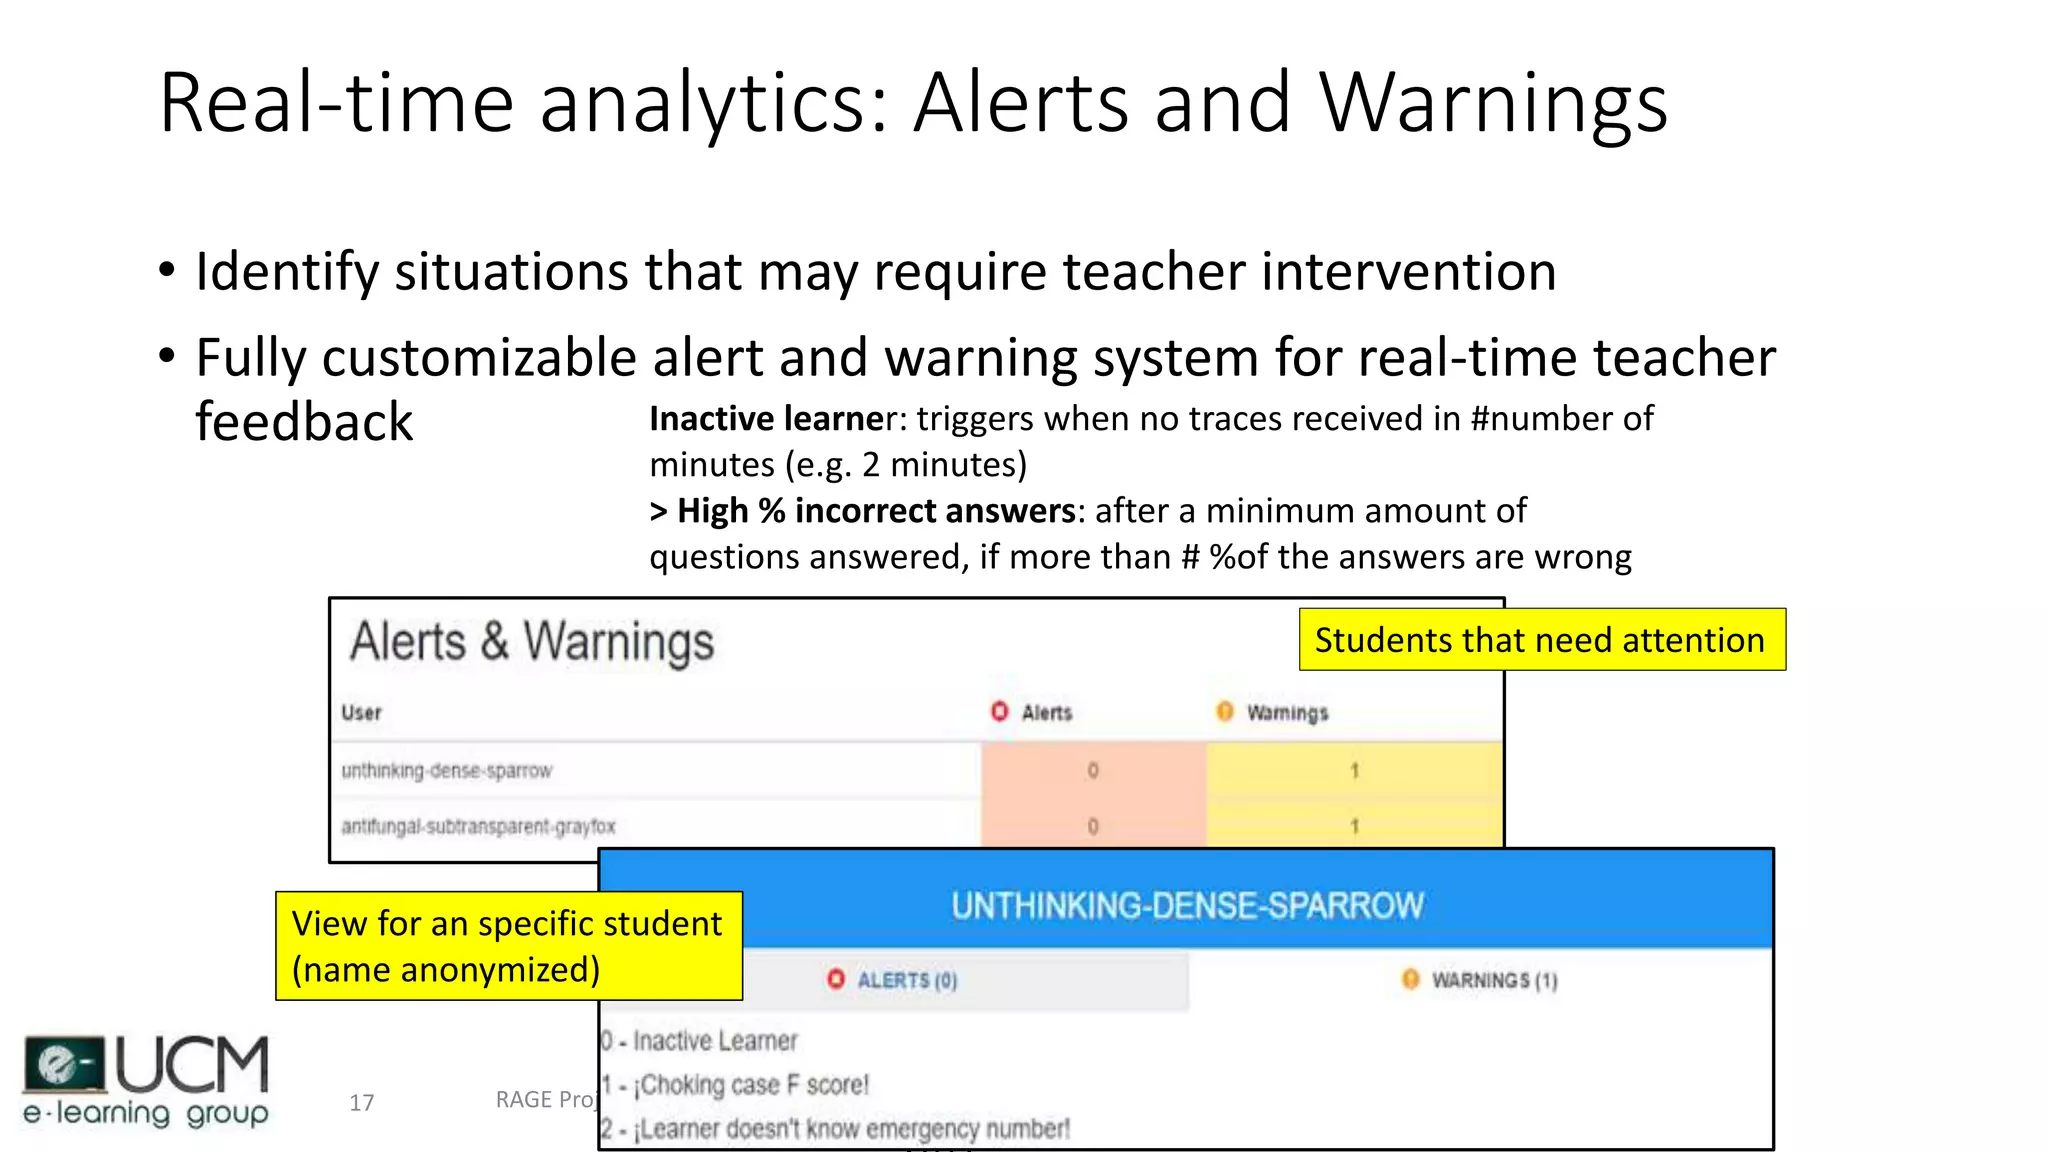
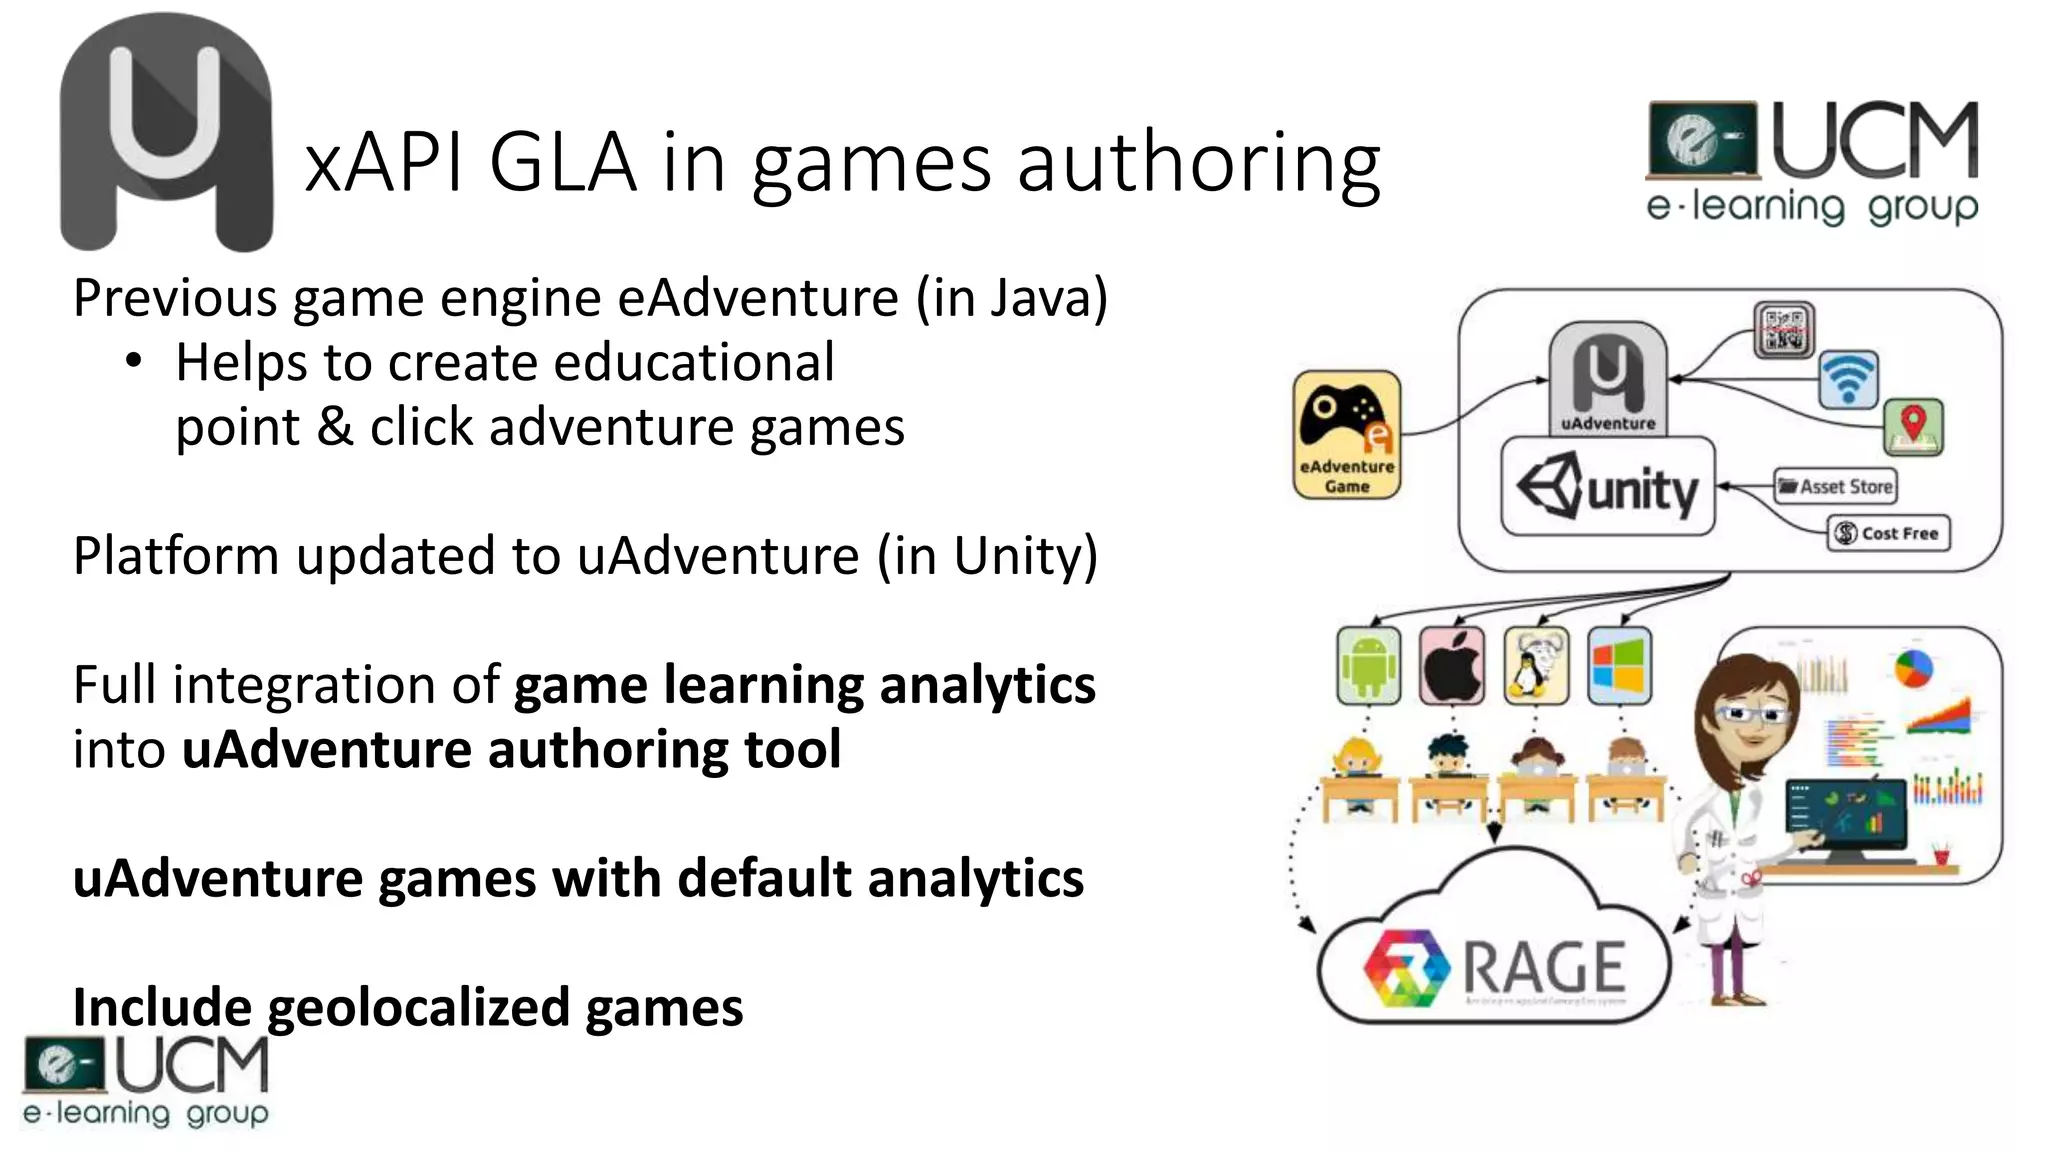
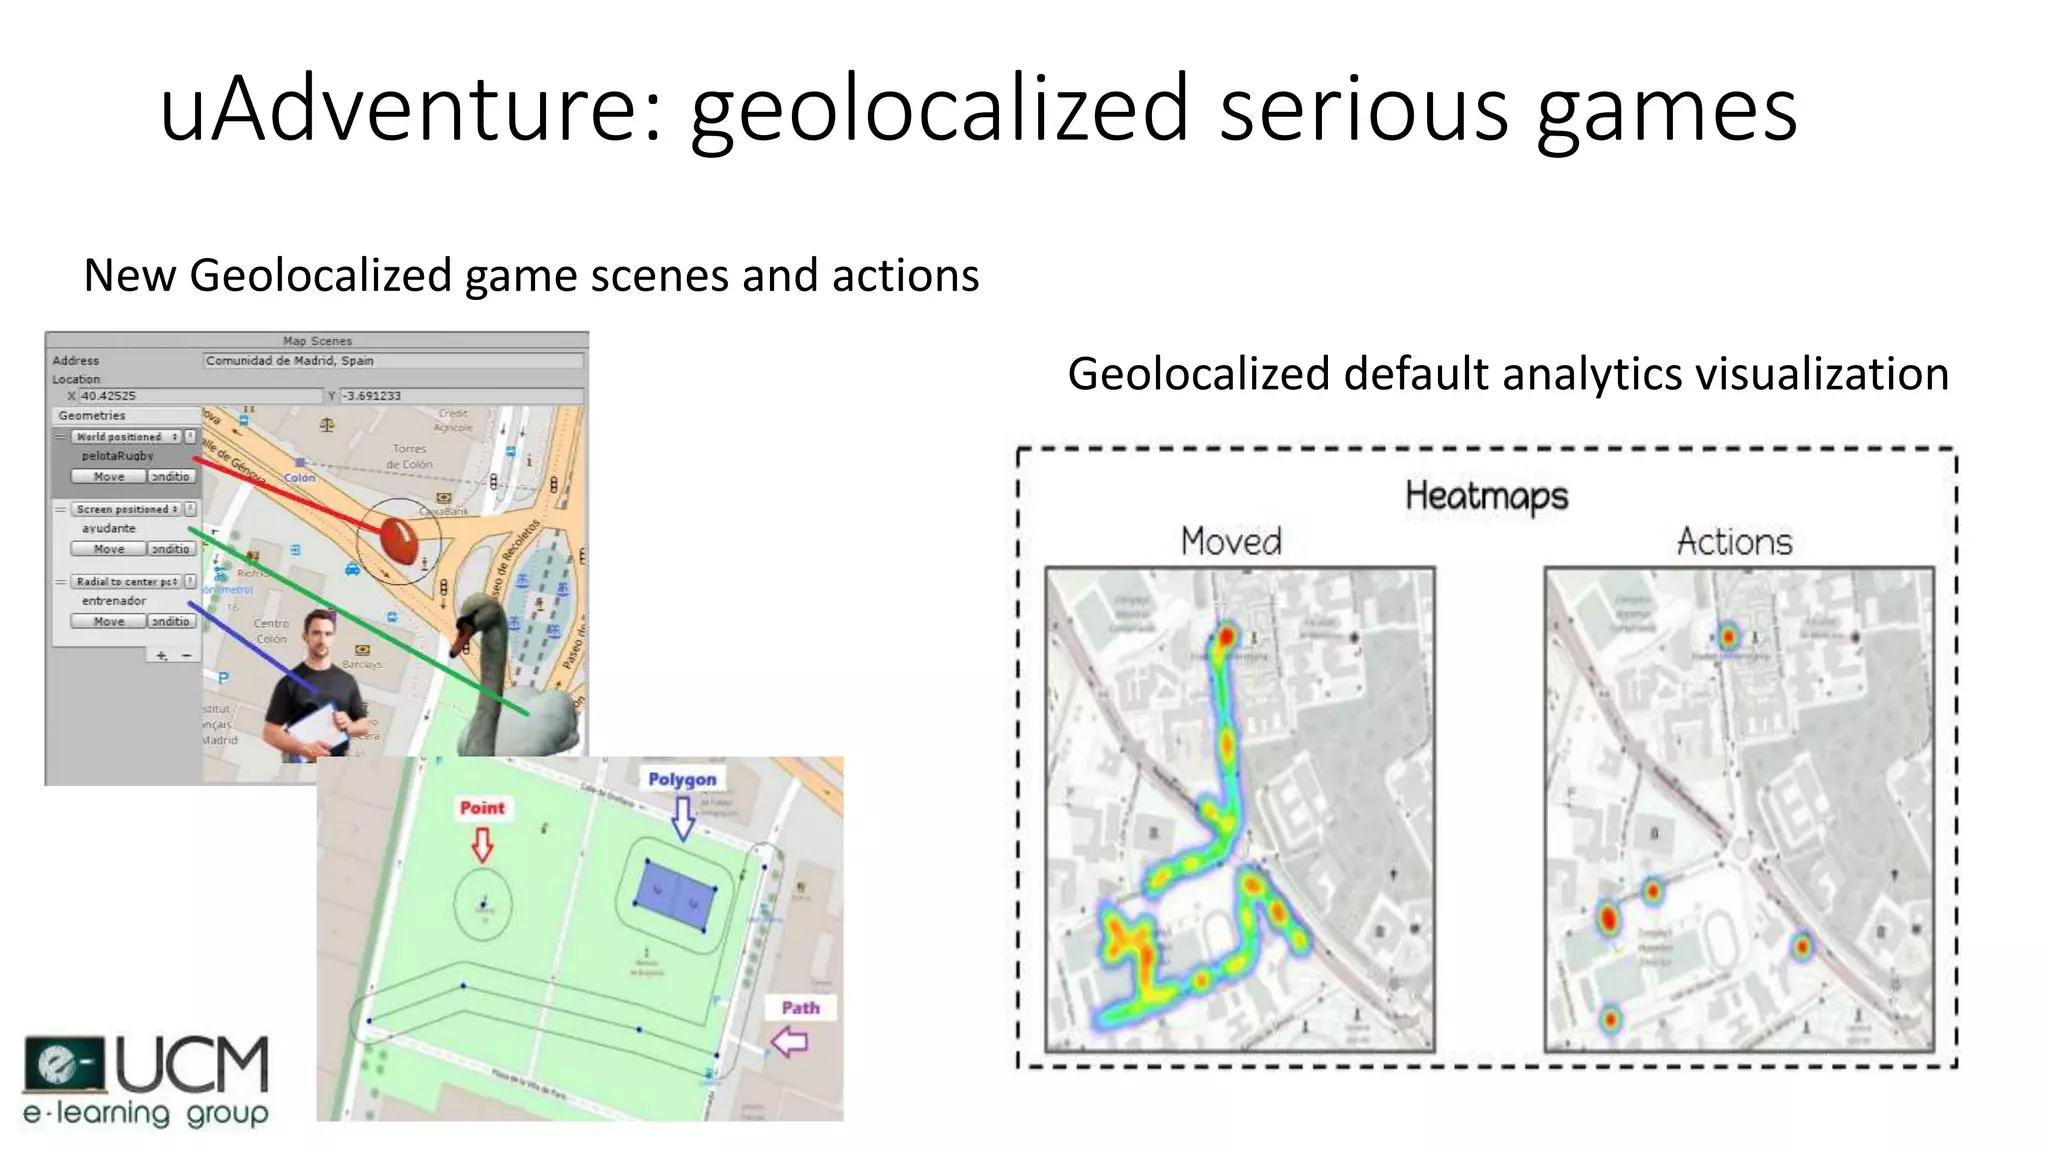
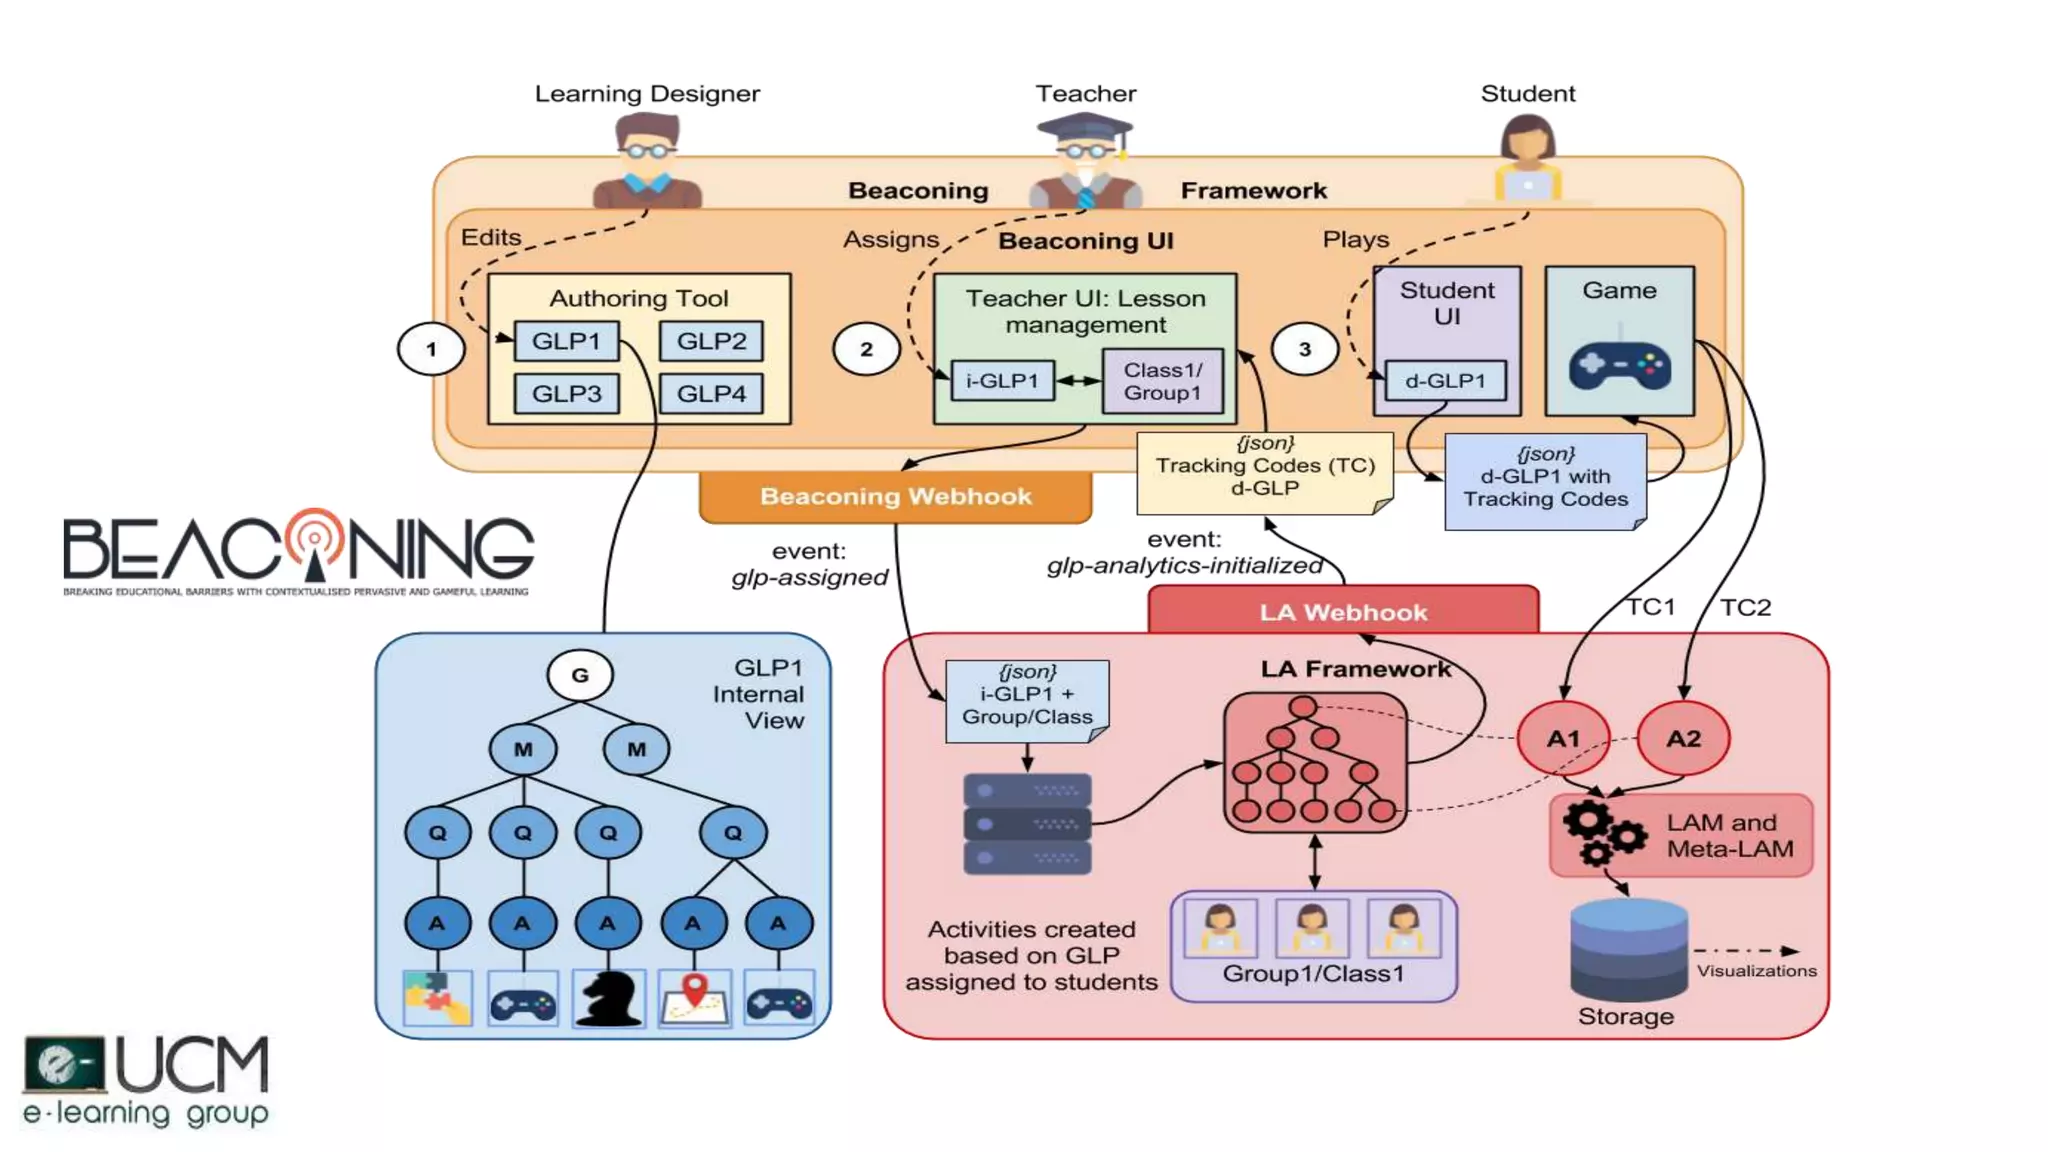
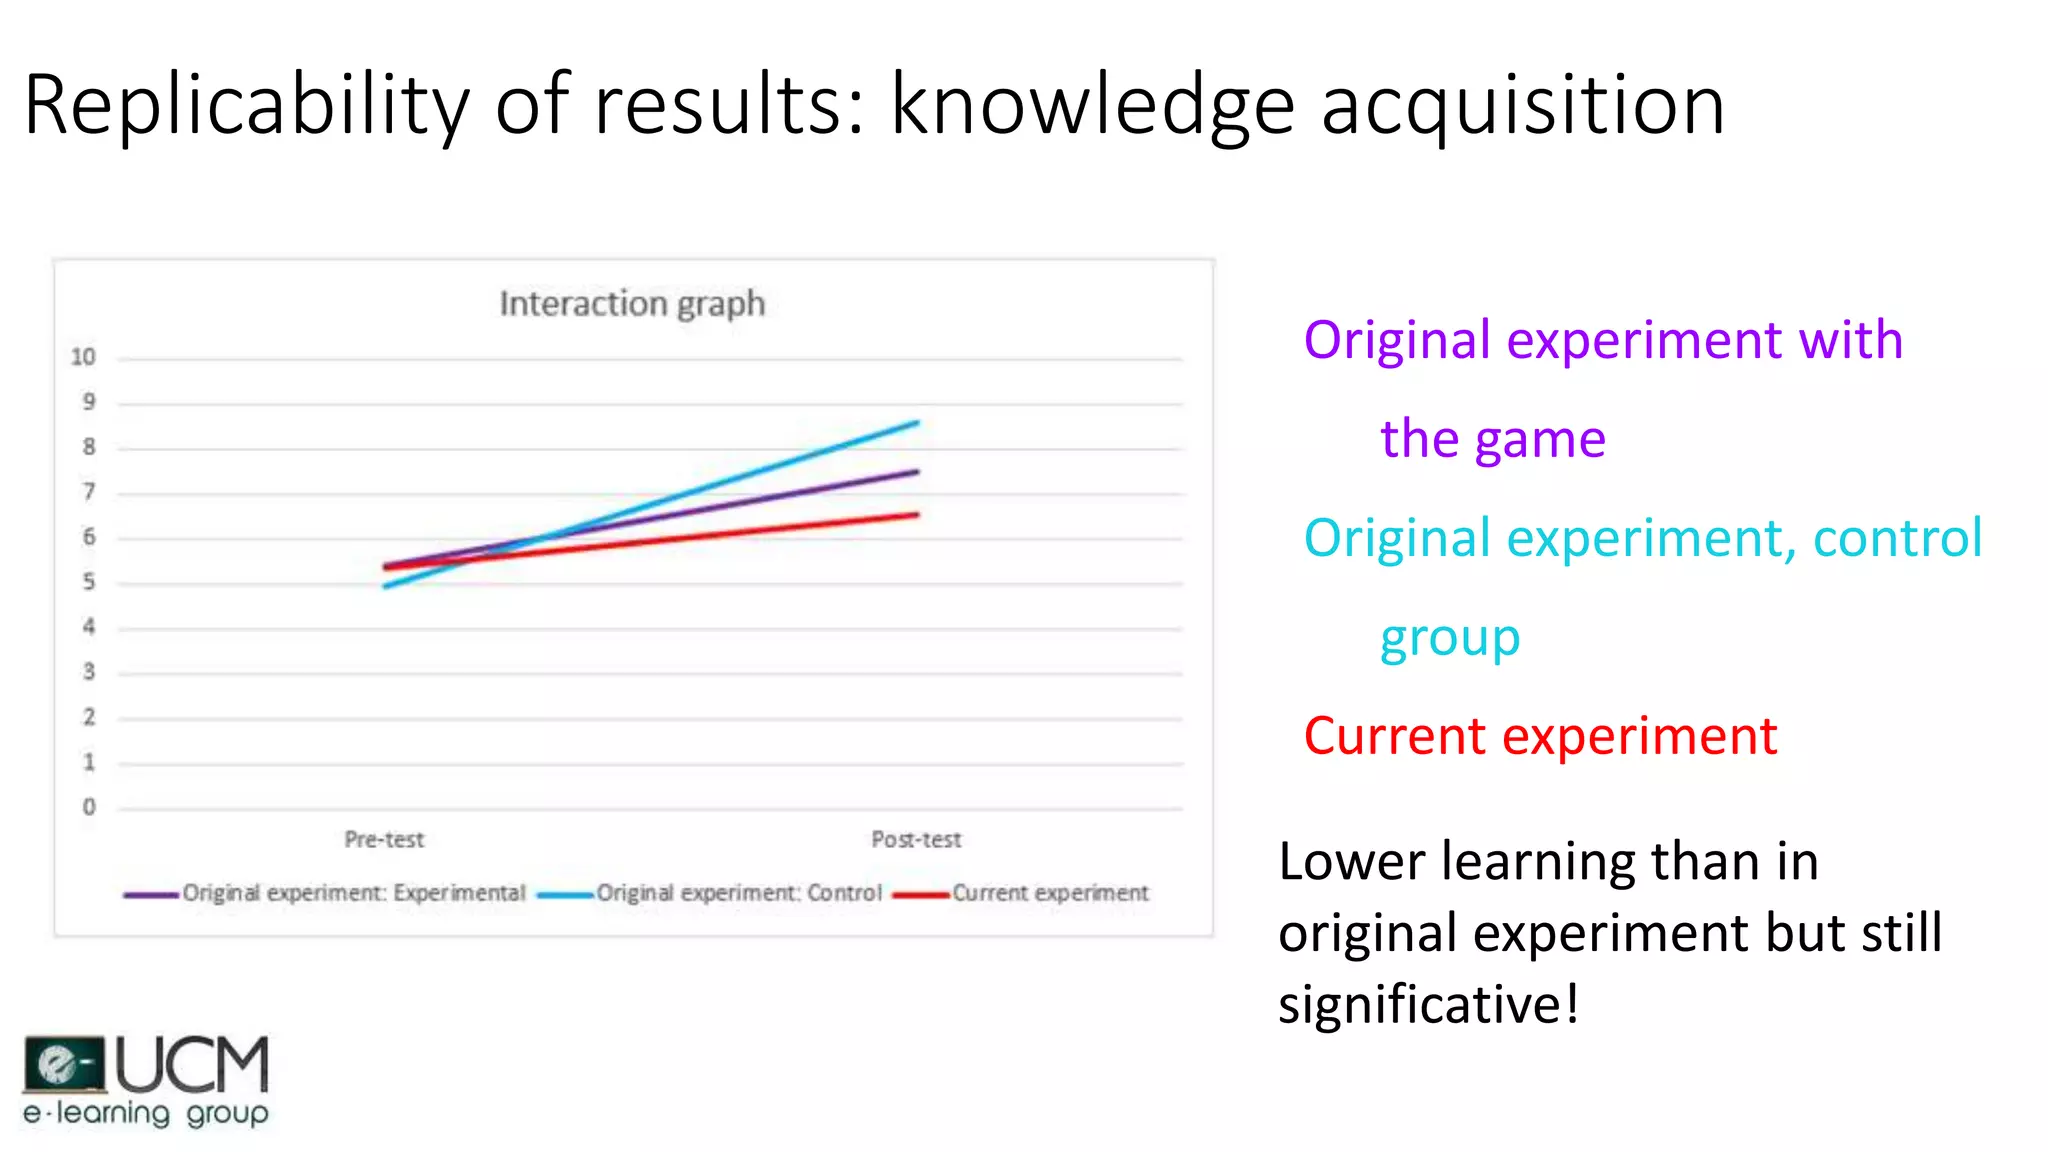
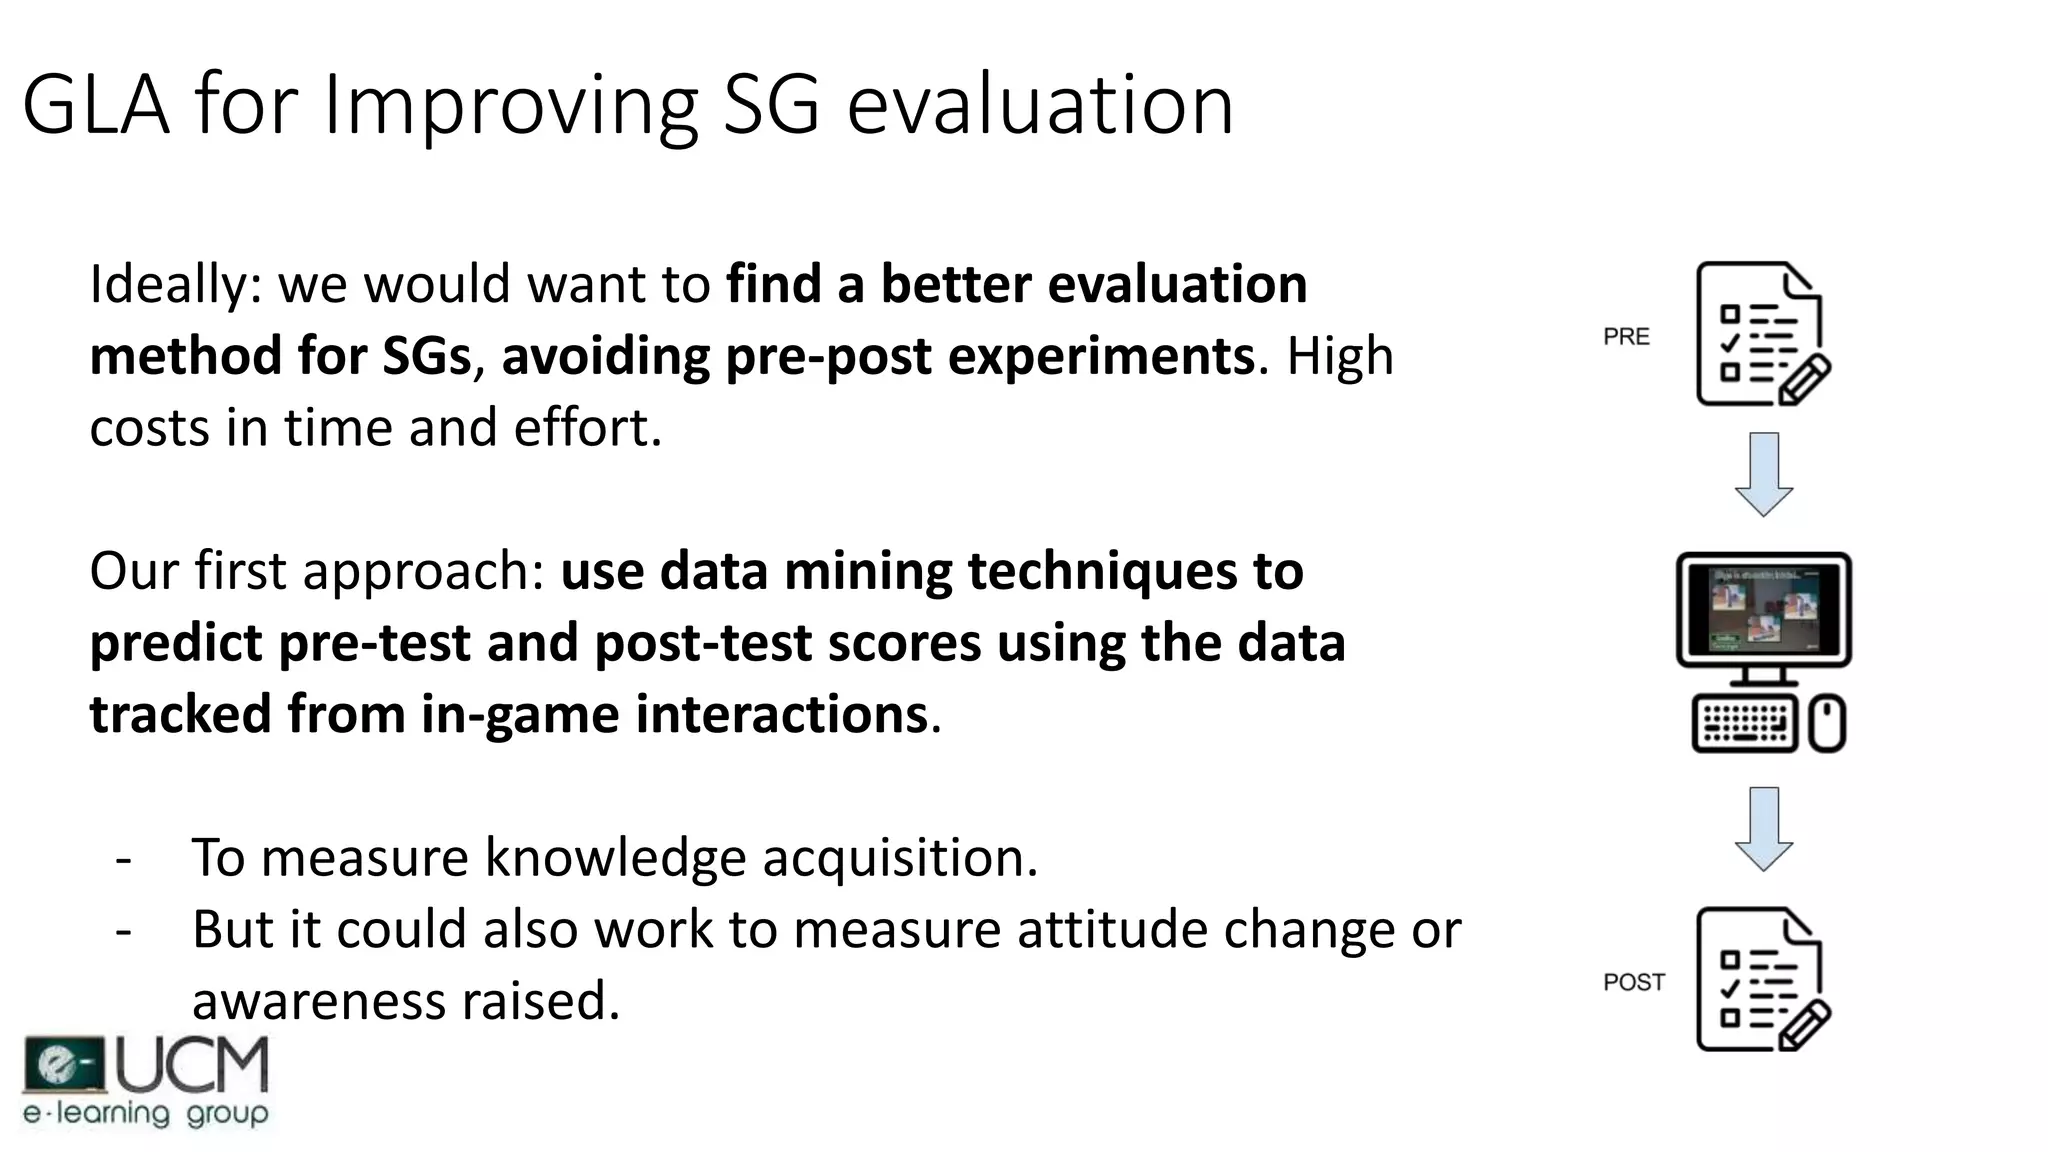
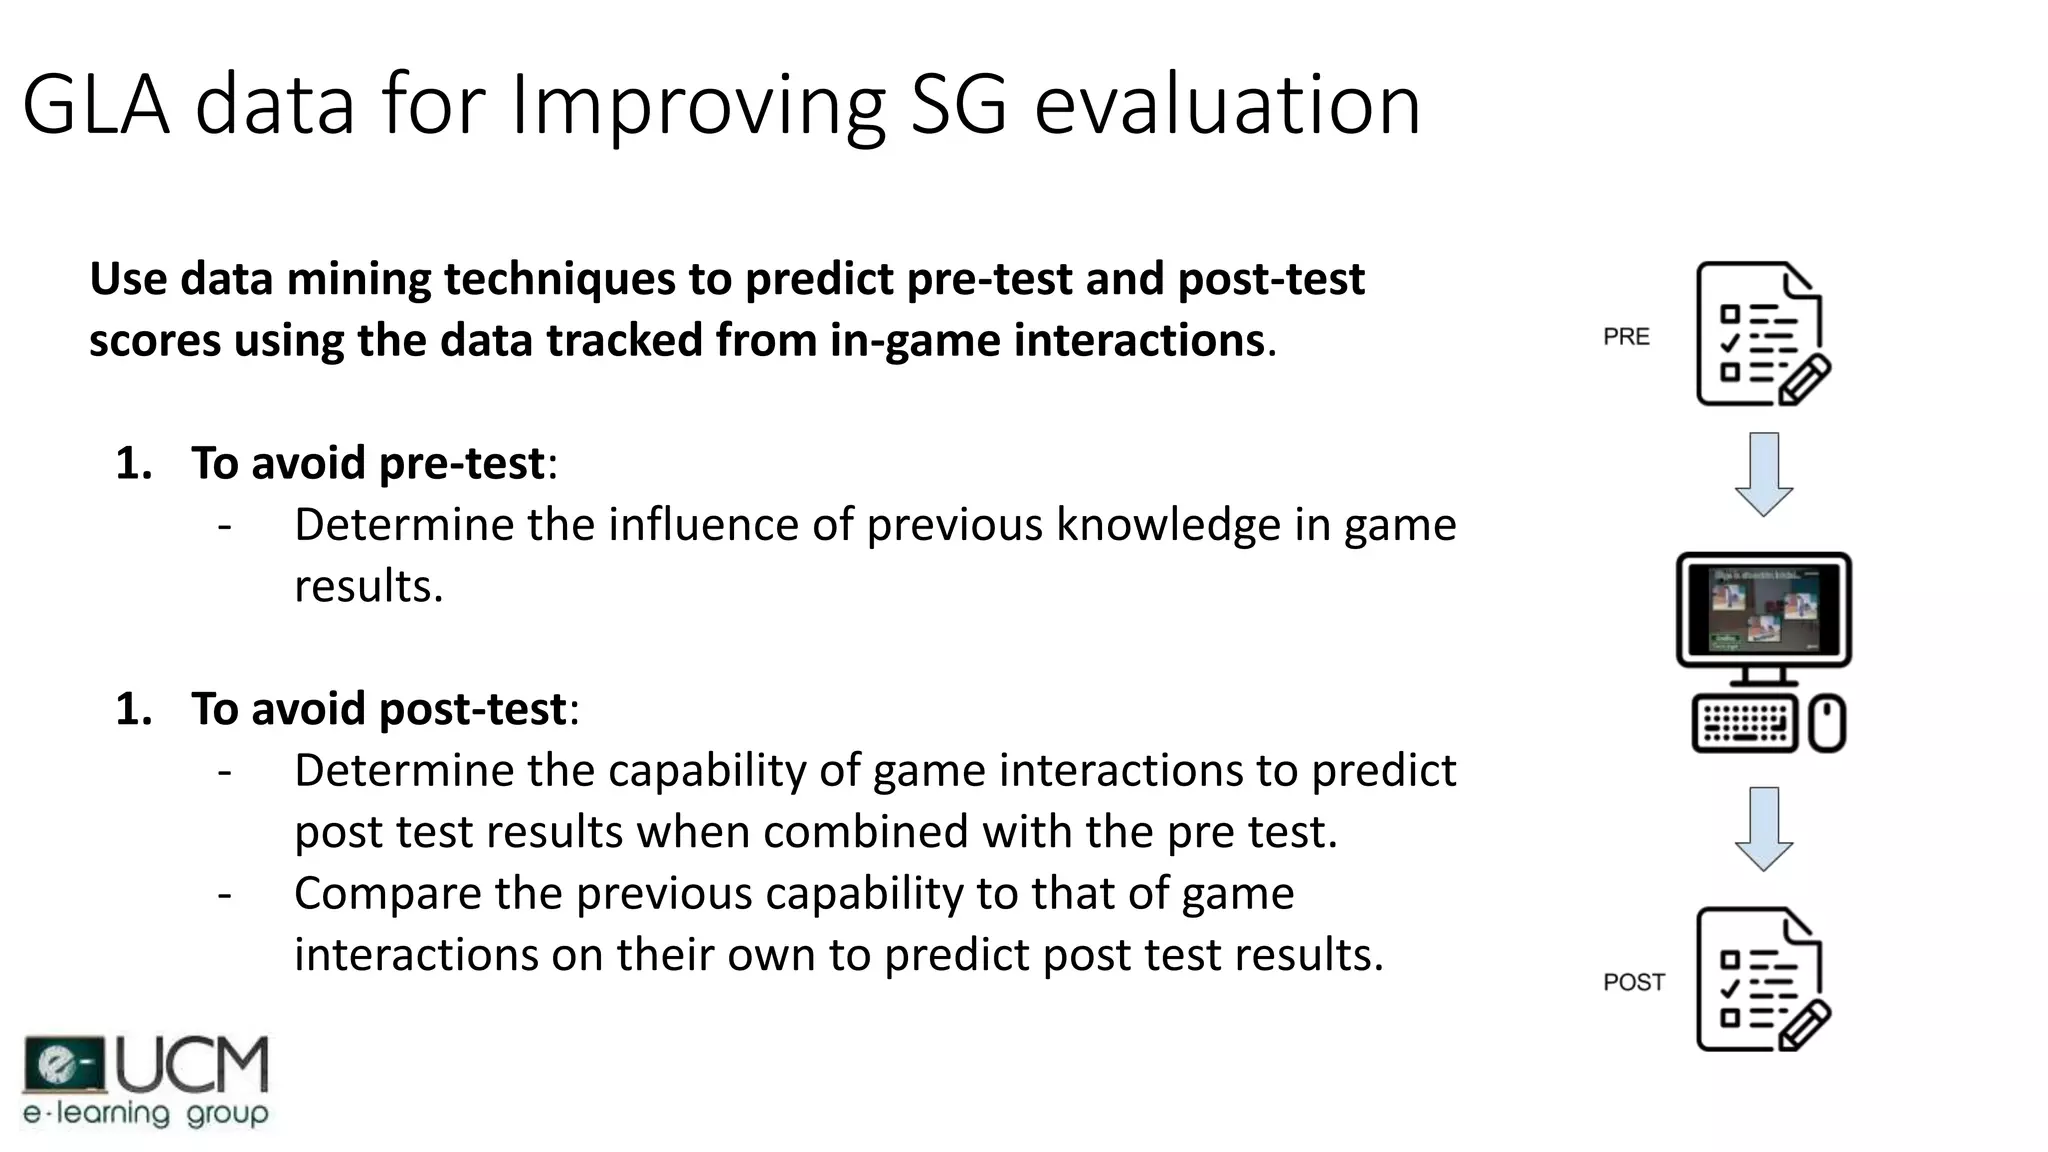
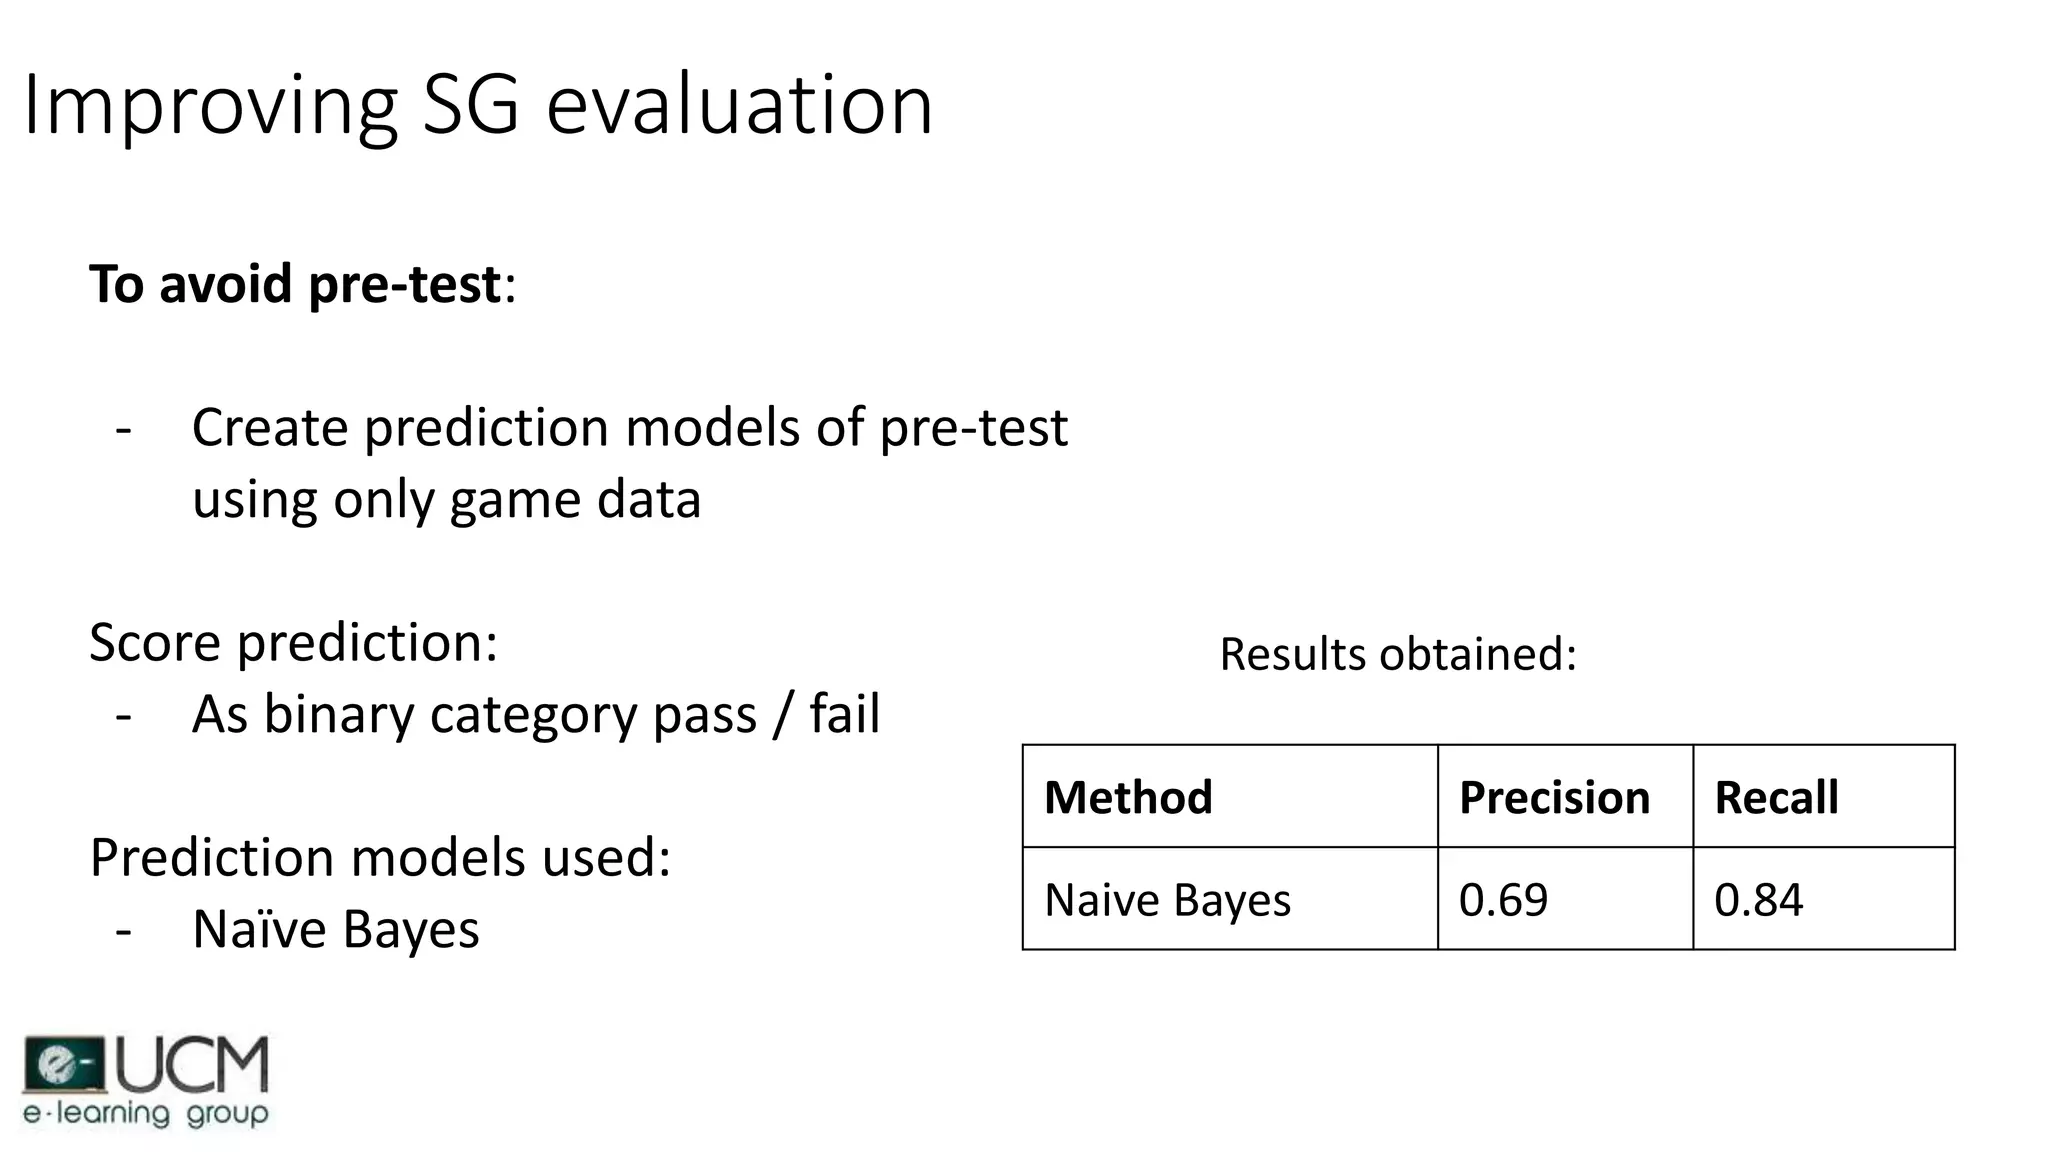
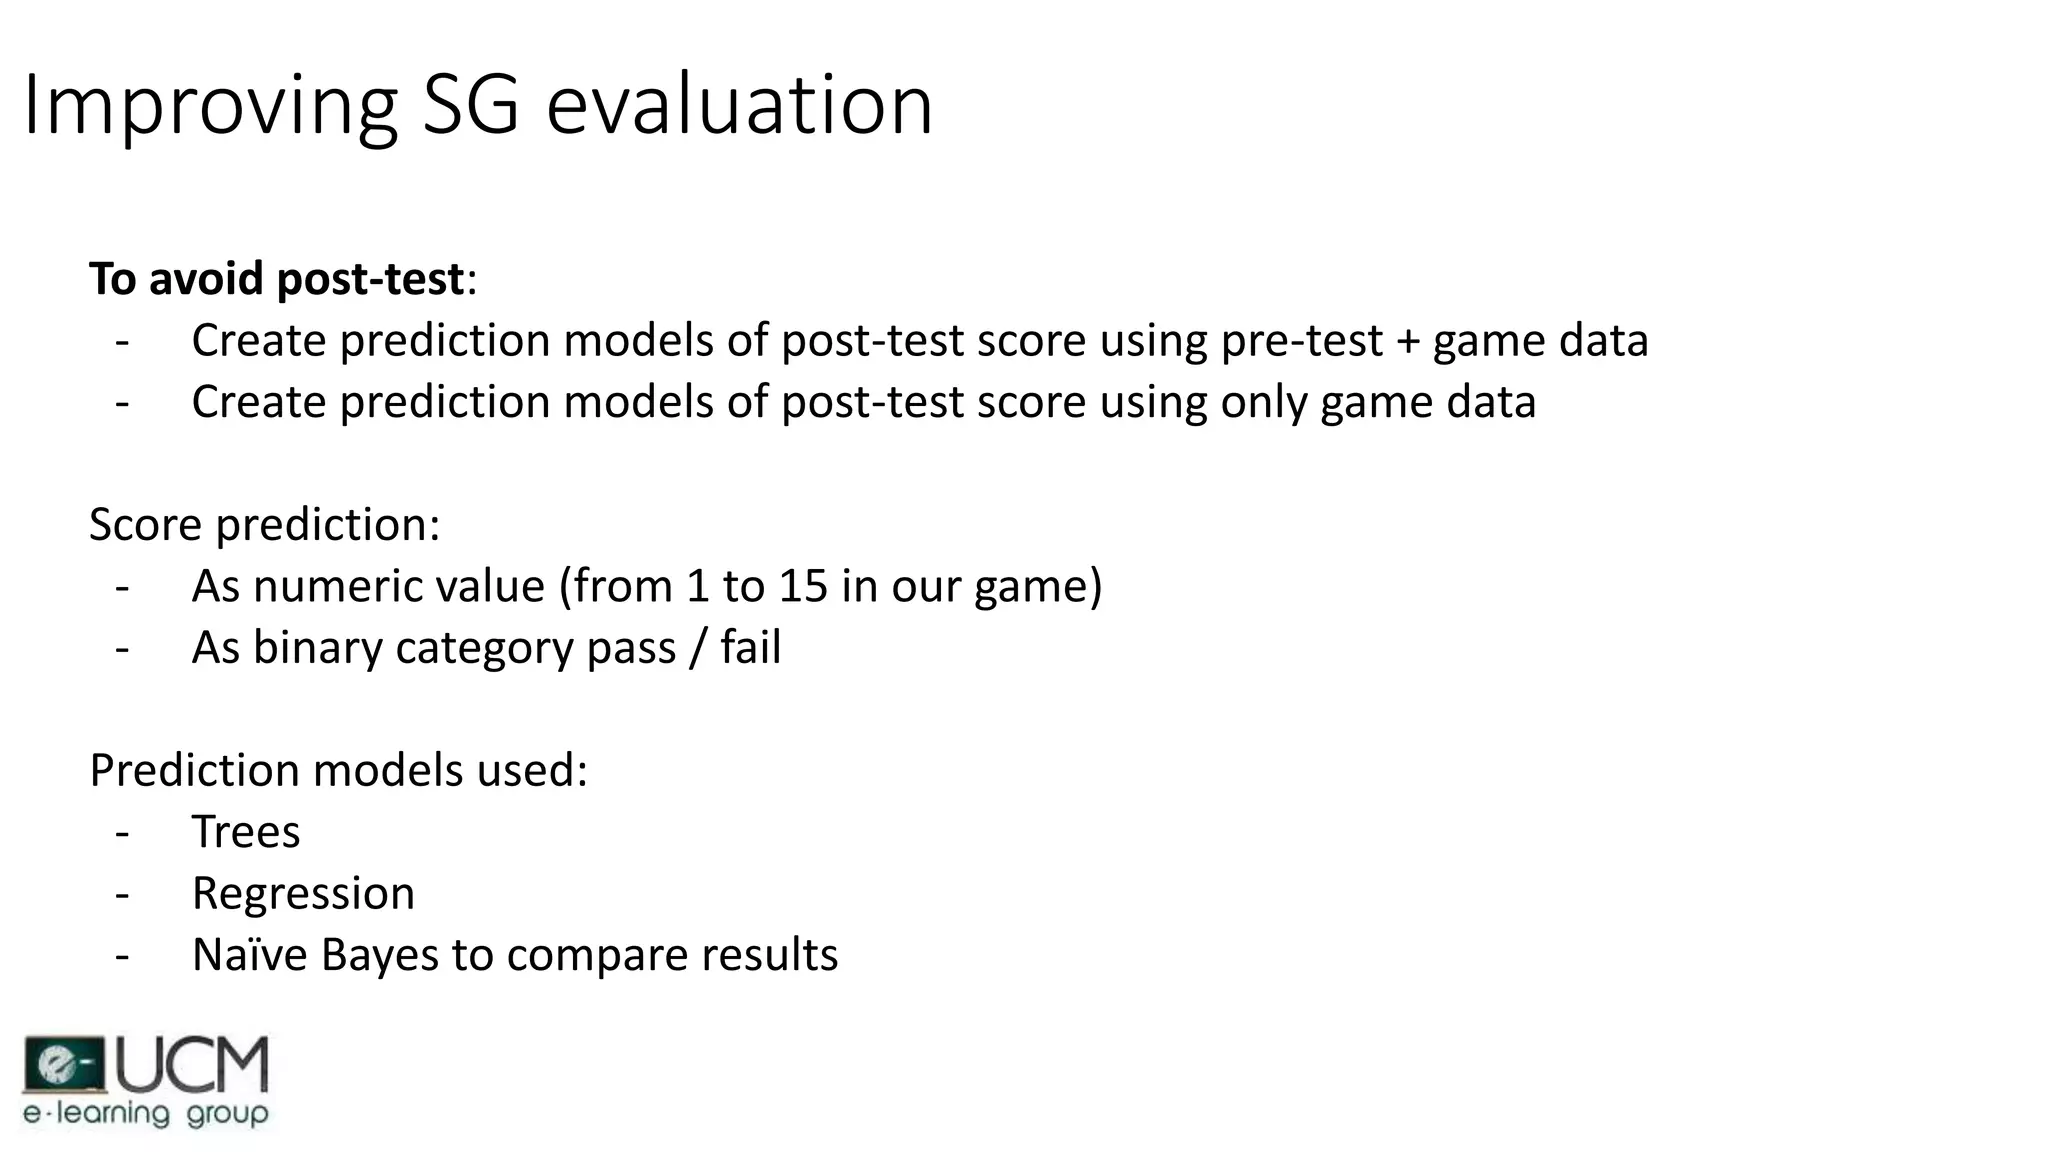
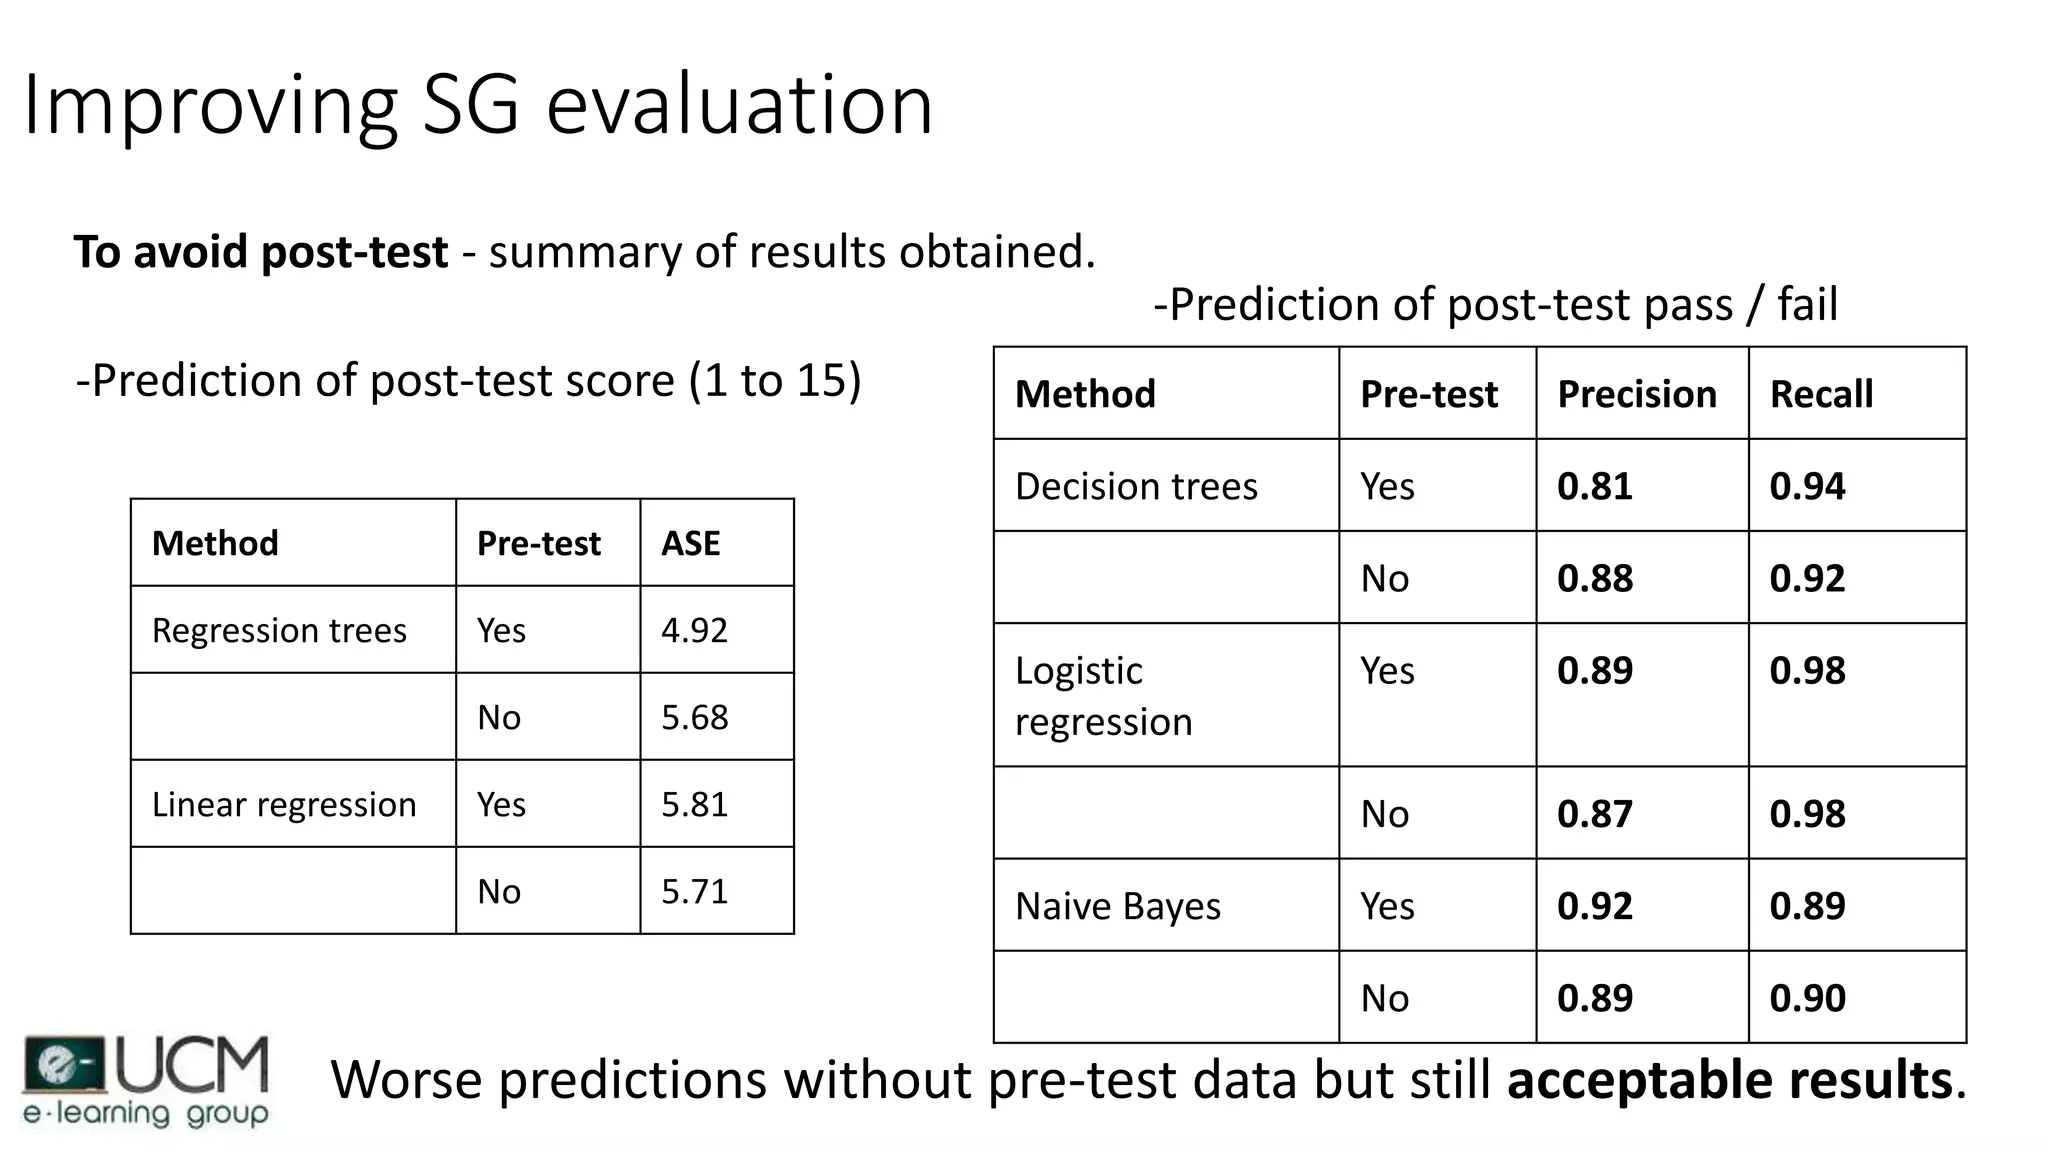
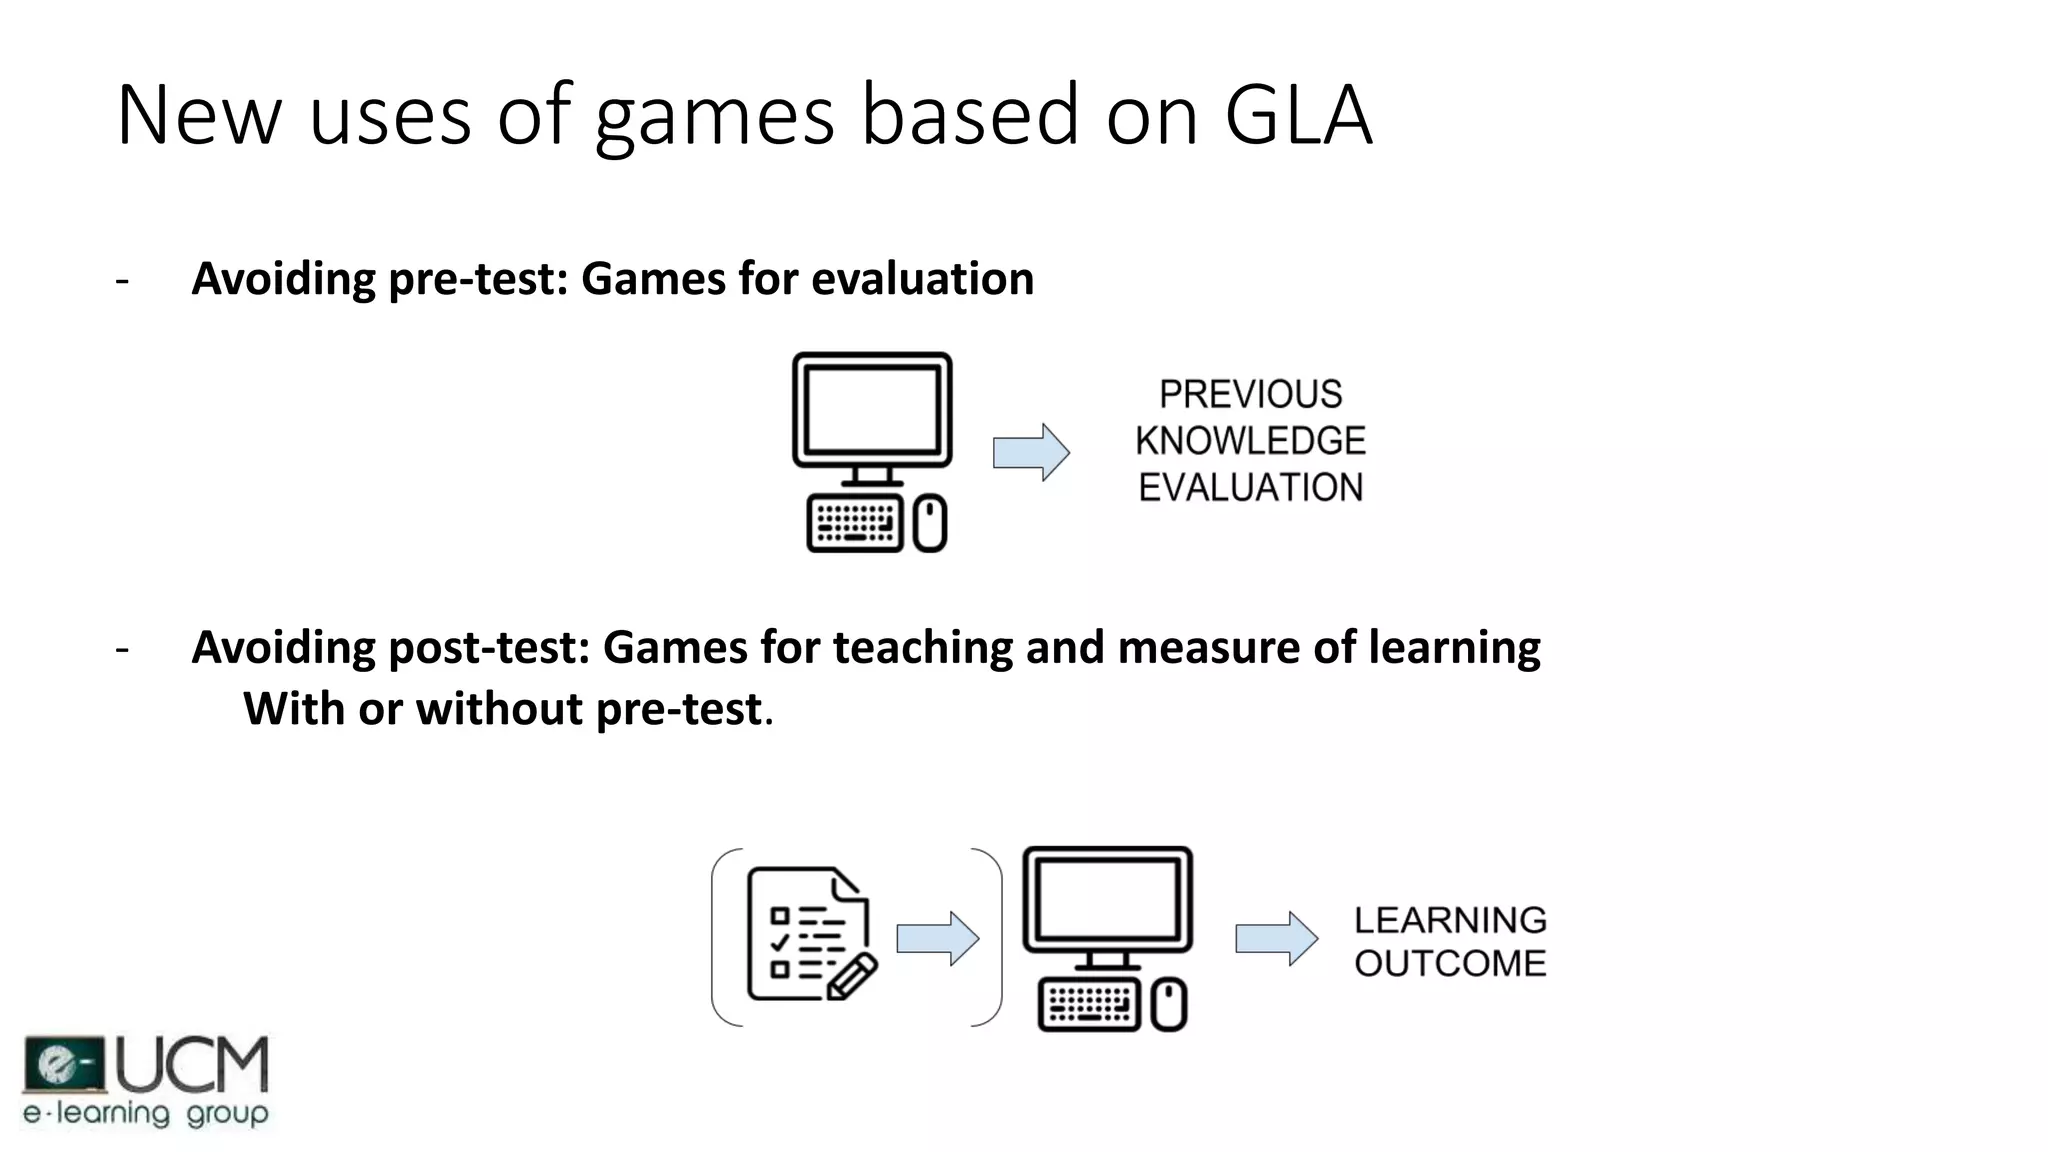
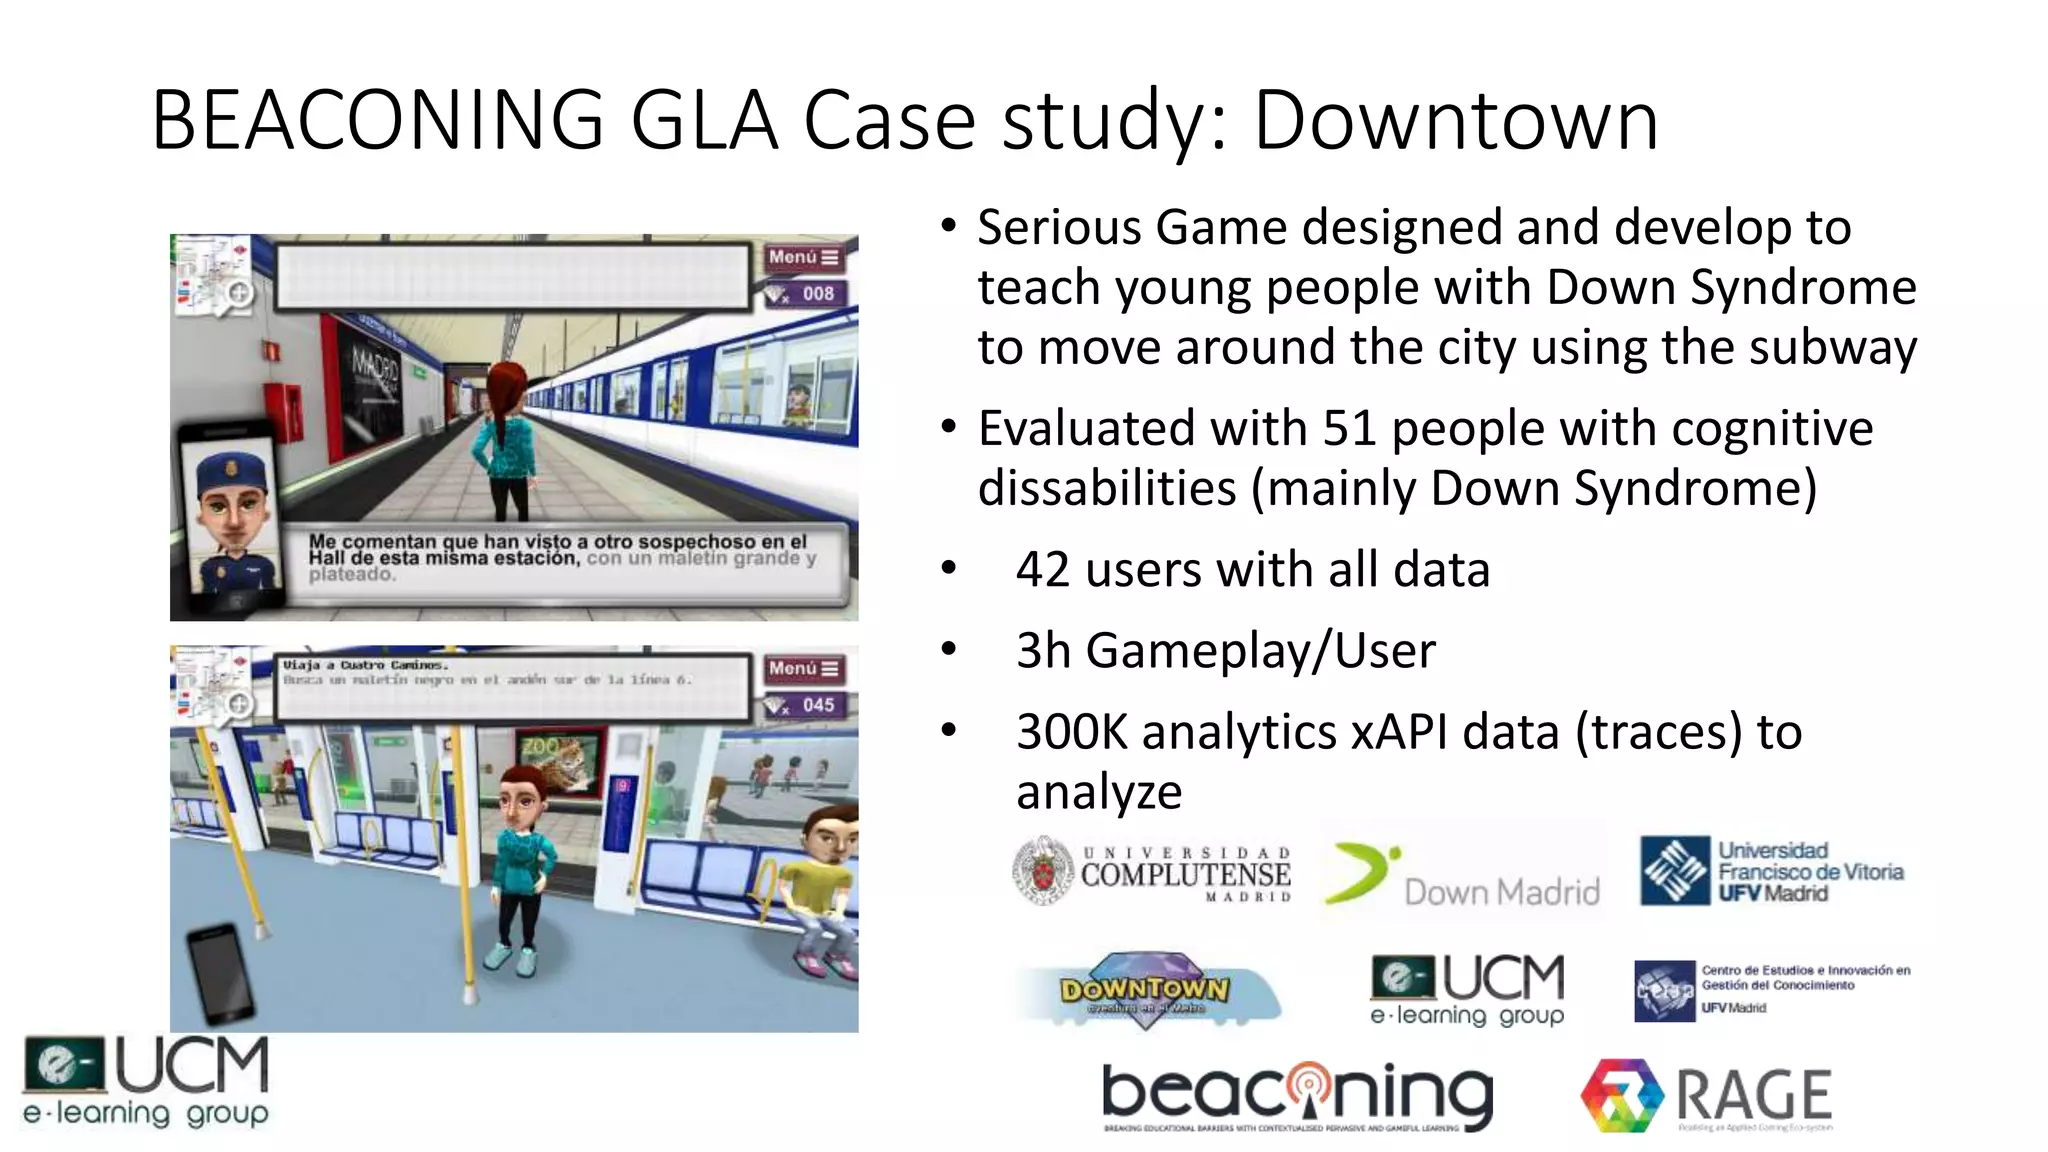
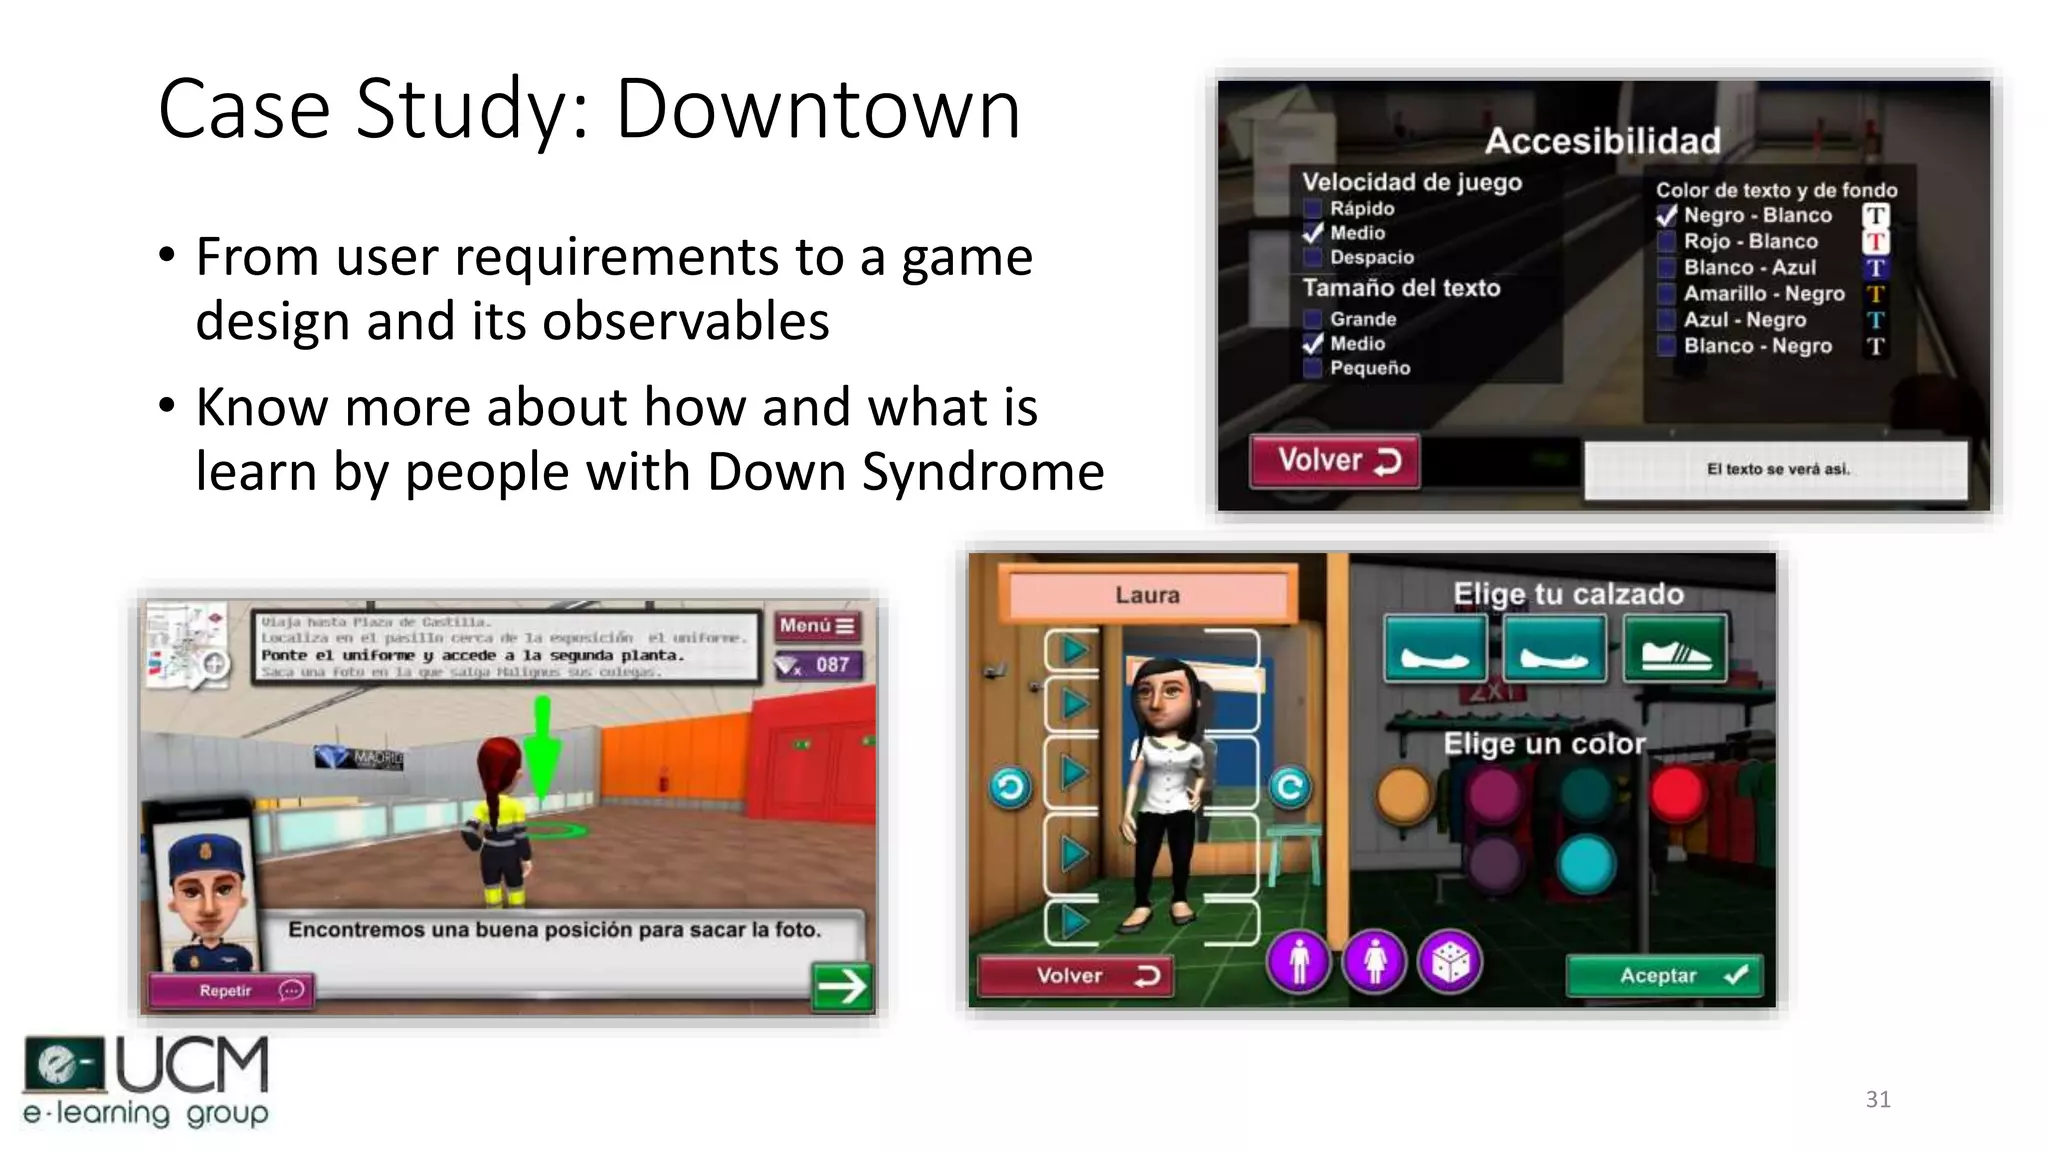
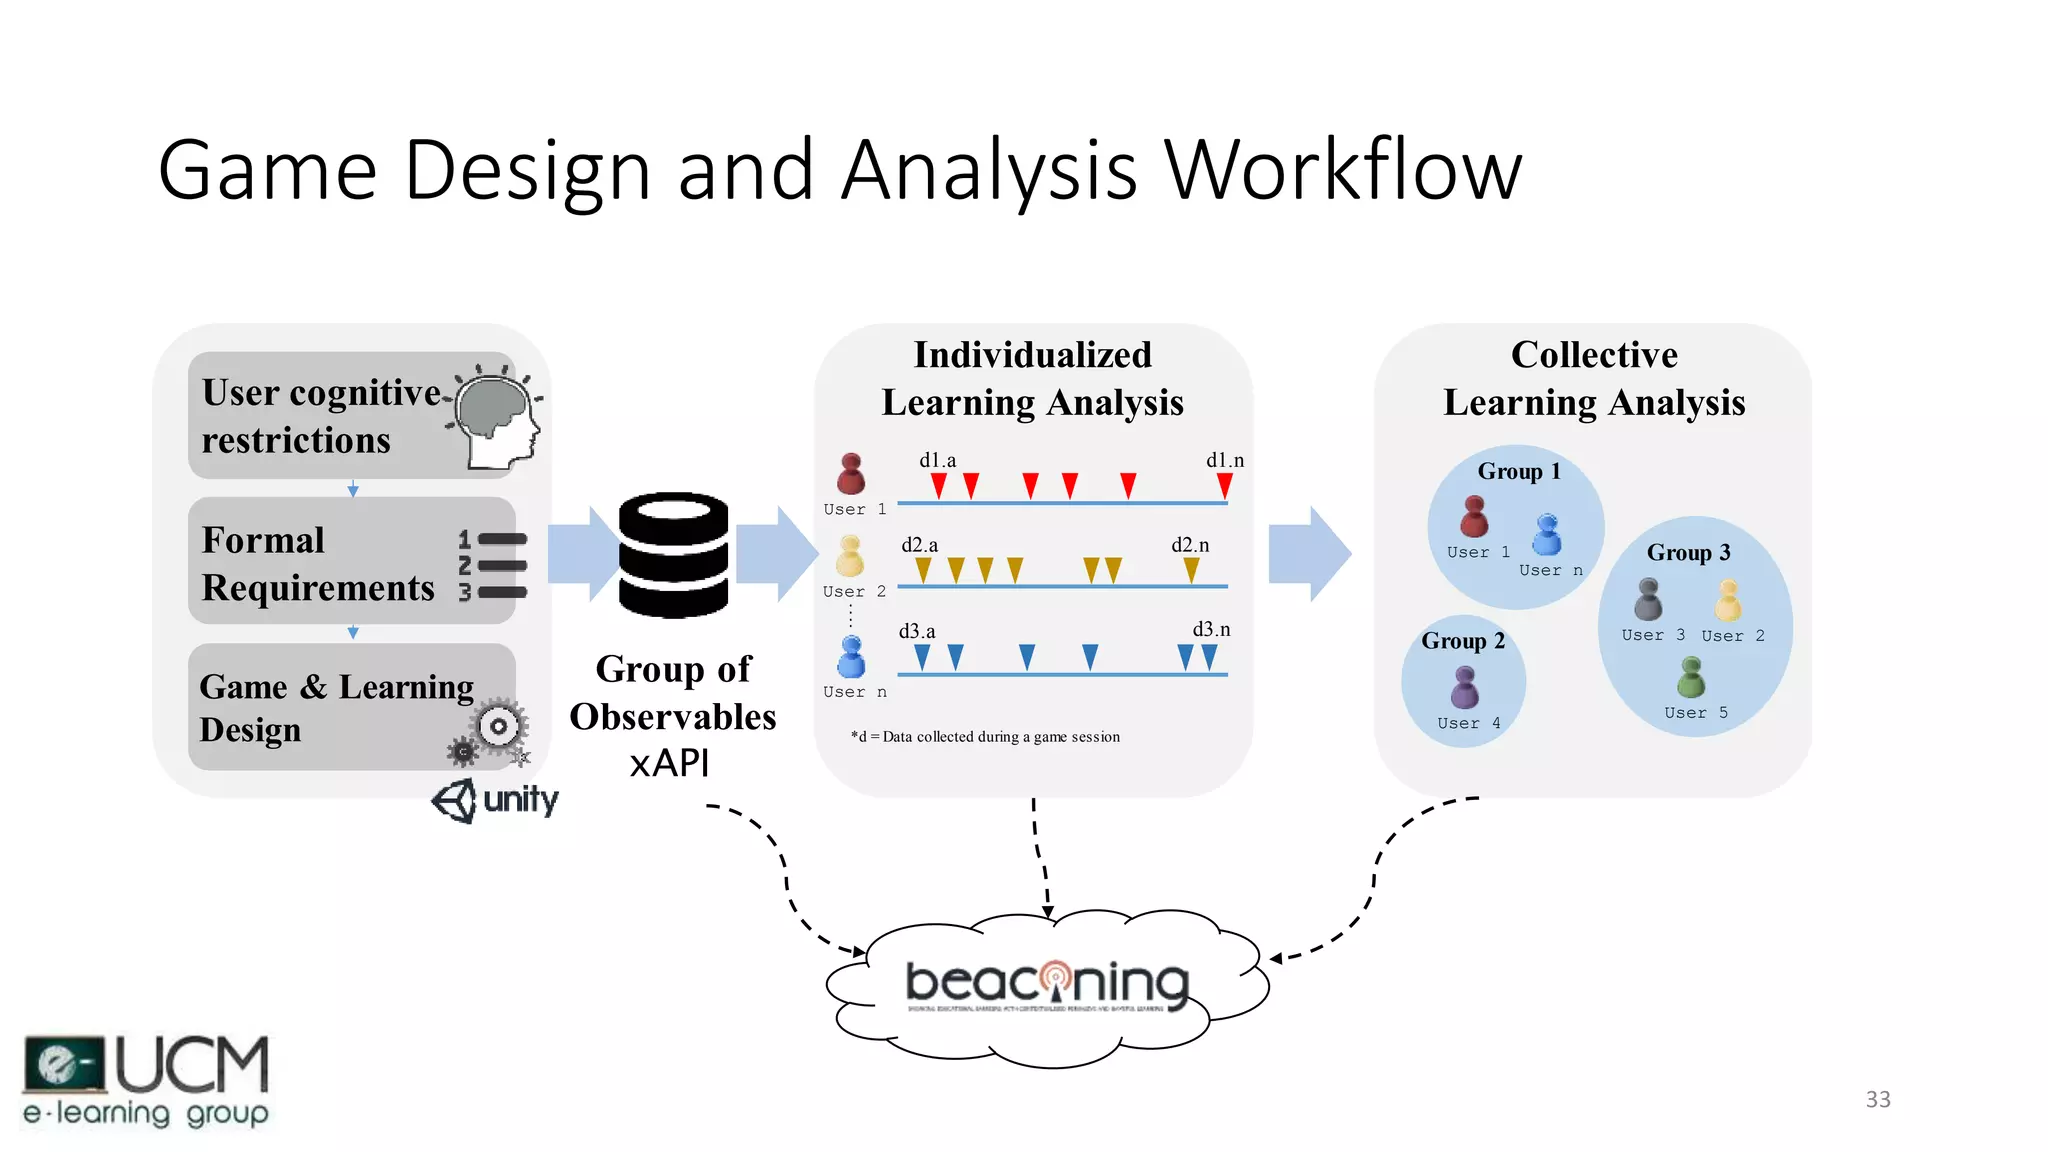
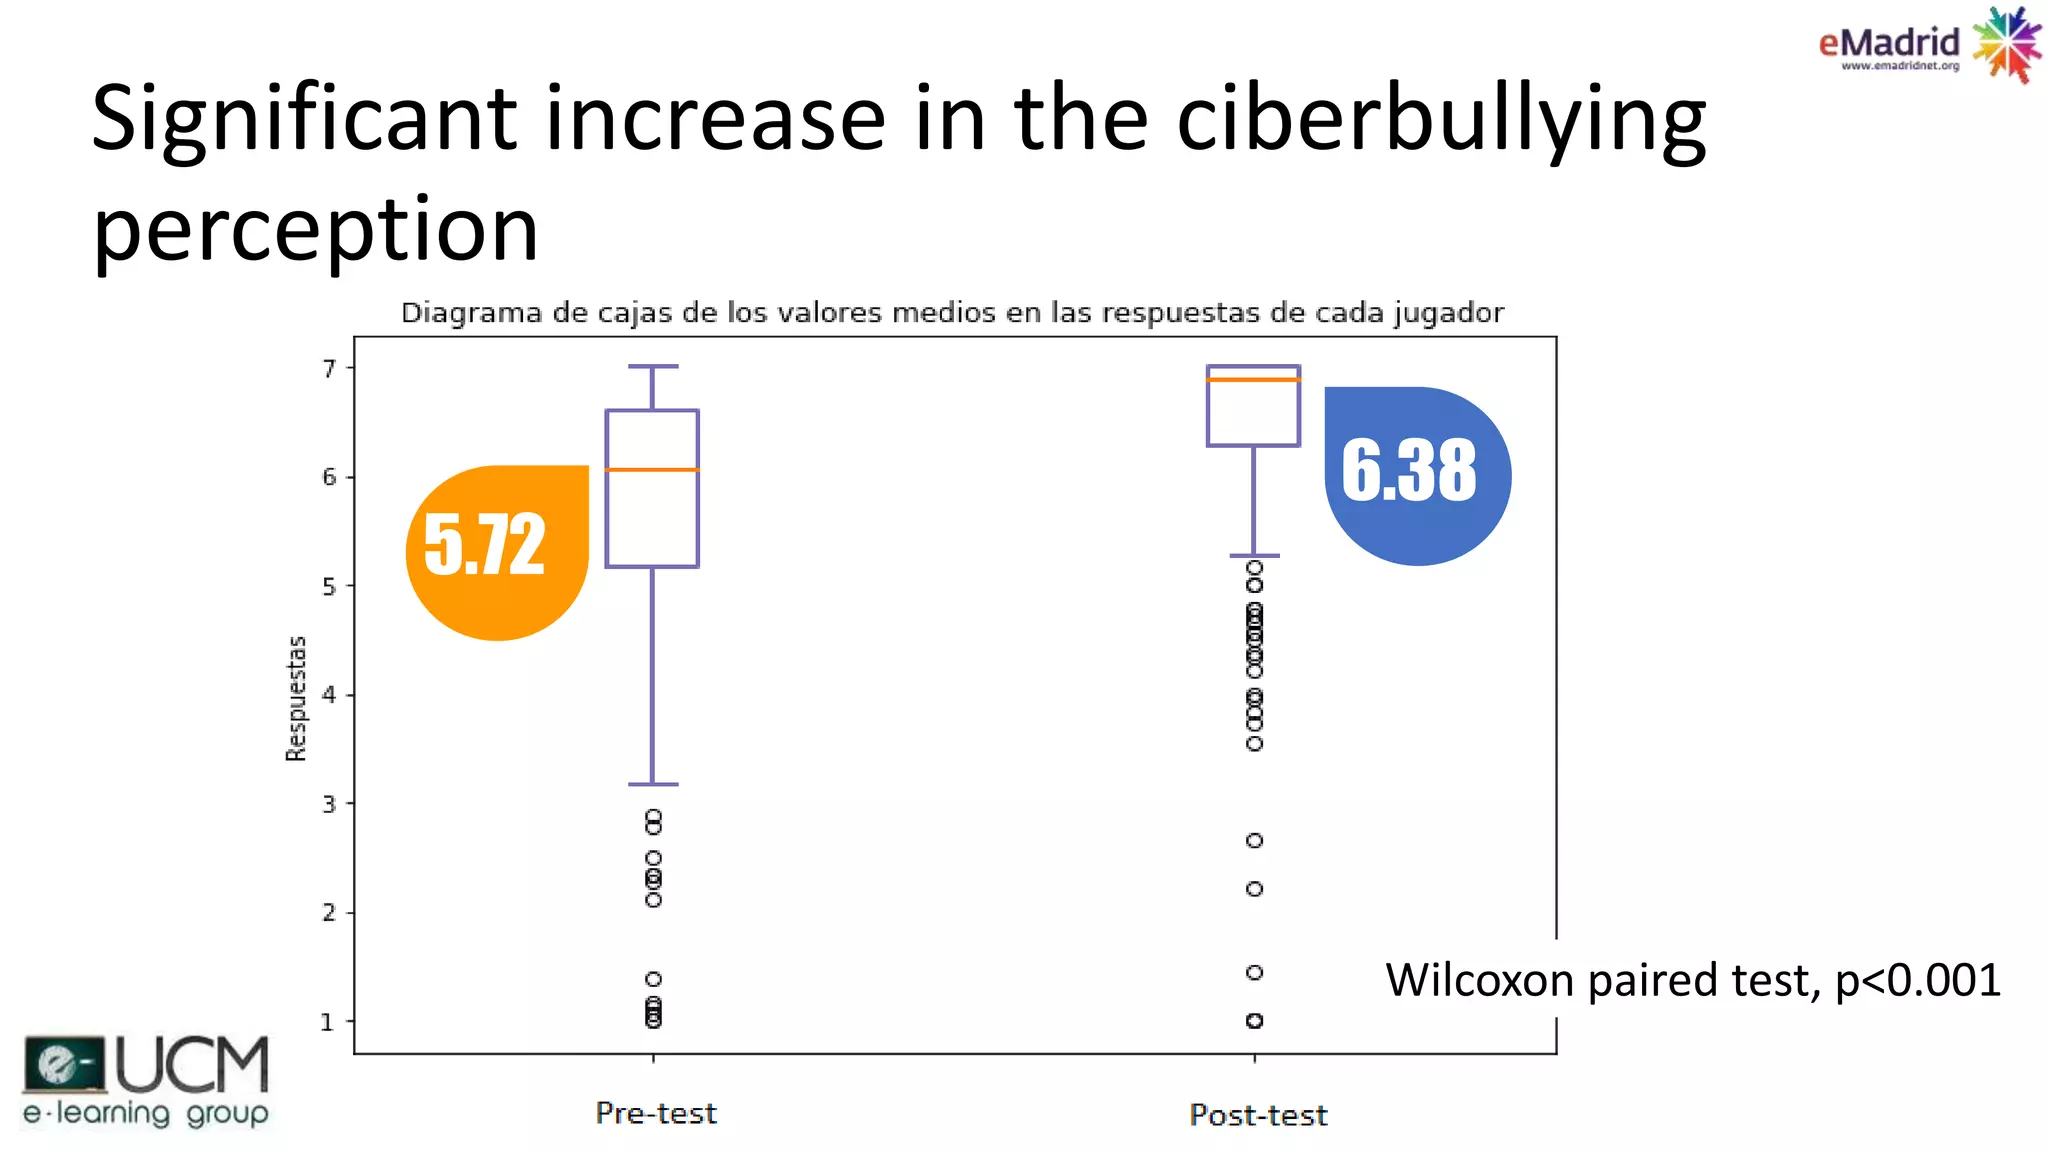
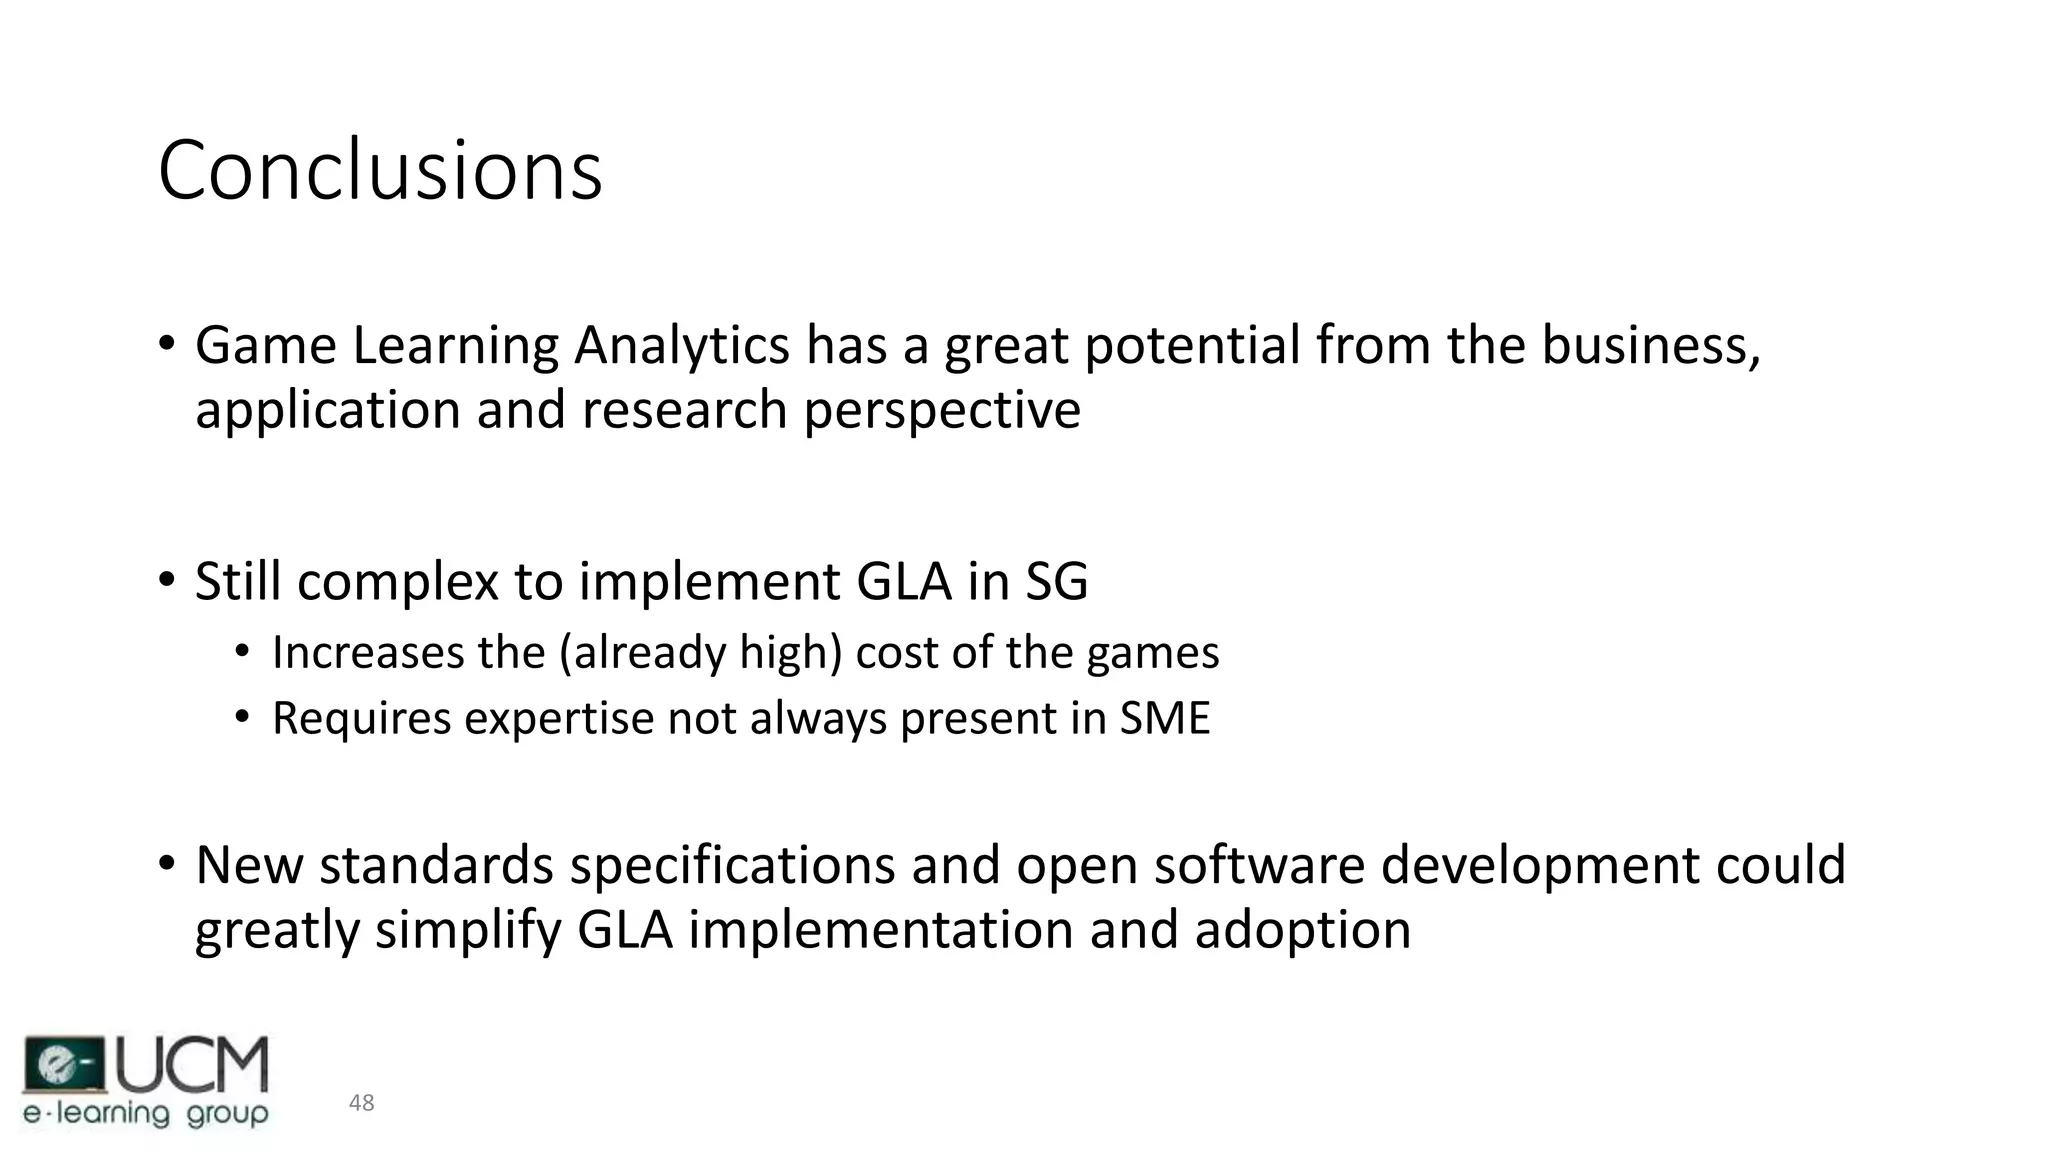
Using Learning Analytics to improve
Serious Games
Baltasar Fernandez-Manjon
balta@fdi.ucm.es , @BaltaFM
e-UCM Research Group , www.e-ucm.es
Jornadas eMadrid, 2017, 04/07/2017
Realising an Applied Gaming Eco-System
JCSG 2017, Universidad Politécnica de Valencia
Open issues with serious games
- Do serious games actually work?
- Very few SG have a full formal evaluation (e.g. pre-post)
- Usually tested with a very limited number of users
- Formal evaluation could be as expensive as creating
the game (or even more expensive)
- Evaluation is not considered as a strong requirement
- Difficult to deploy games in the classroom
- Teachers have very little info about what is happening
when a game is being used
Learning analytics
• Improving education based on data analysis
• Data driven
• From only theory-driven to evidence-based
• Off-line
• Analyzing data after use
• Discovering patterns of use
• Allows to improve the educacional experience for future
• Real time
• Analyzing data while the system is in use to improve/adapt the current learning
experience
• Allows to also use it in actual presential classes
Game Analytics
• Application of analytics to game
development and research
• Telemetry
• Data obtained over distance
• Mobile games, MMOG
• Game metrics
• Interpretable measures of data related
to games
• Player behaviour
Game Learning Analytics (GLA) or Informagic?
• GLA is learning analytics applied to serious games
• collect, analyze and visualize data from learners’ interactions with SG
• Informagic
• False expectations of gaining full insight on the game educational
experience based only on very shallow game interaction data
• Set more realistic expectations about learning analytics with serious games
• Requirements
• Outcomes
• Uses
• Cost/Complexity
Perez-Colado, I. J., Alonso-Fernández, C., Freire-Moran, M., Martinez-Ortiz, I., & Fernández-Manjón, B. (2018). Game
Learning Analytics is not informagic! In IEEE Global Engineering Education Conference (EDUCON).
Uses of Gaming Learning Analytics in
educational games
• Game testing – game analytics
• It is the game realiable?
• How many students finish the game?
• Average time to complete the game?
• Game deployment in the class – tools for teachers
• Real-time information for supporting the teacher
• Knowing what is happening when the game is deployed in the class
• “Stealth” student evaluation
• Formal Game evaluation
• From pre-post test to evaluation based on game learning analytics??
Minimun Game Requirements for GLA
• Most of games are black boxes.
• No access to what is going on during game play
• We need access to game “guts”
• User interactions
• Changes of the game state or game variables
• Or the game must communicate with the outside world
• Using some logging framework
• What is the meaning of the that data?
• Adequate experimental design and setting
• Are users informed?
• Anonymization of data could be required
Game Learning Analytics
Evidence-centered assessment design (ECD)
The Conceptual Assessment Framework (CAF)
Student Model: What Are We Measuring?
Evidence Model: How Do We Measure It?
Task Model: Where Do We Measure It?
Assembly Model: How Much Do We Need
to Measure It?
(Mislevy, Riconscente, 2005)
Learning Analytics Model (LAM)
LAM: stakeholders, activities, outcomes
xAPI Serious Games application profile
Standard interactions model developed and implemented in
Experience API (xAPI) by UCM with ADL
(Ángel Serrano et al, 2017).
The model allows tracking of all
in-game interactions as xAPI traces
(e.g. level started or completed)
Now being extended in BEACONING
to geolocalized games
IEEE stardarization group on xAPI
https://www.adlnet.gov/serious-games-cop
Game Learning Analytics
Can GLA be systematized?
Realising an Applied Gaming Eco-System
Java
xApi Tracker
Unity
xApi Tracker
C#
xApi Tracker
Game trackers and cloud analytics frameworks as open code (github)
https://github.com/e-ucm
Client A2 Applications
Games
Analytics
Frontend
A2
Frontend
PlayersDevs,Students,
Teachers.
Admins
Users
Roles
Resources
Permissions
Applications
Authentication
Authorization
JWT
JSON
WEB
TOKEN
Topology
Analytics Backend
Games
Sessions
Collector
Results
Application 1
Application N
KafkaQueue
Games
Sessions
Results
Visualization
Architecture and technologies
Open code to be deployed in your server
You own all your game analytics data
Systematization of Analytics Dashboards
As long as traces follow xAPI format, these analysis
do not require further configuration!
Also possible to configure game-dependent analysis and
visualizations for specific games and game characteristics.
Real-time analytics: Alerts and Warnings
• Identify situations that may require teacher intervention
• Fully customizable alert and warning system for real-time teacher
feedback
24/11/RAGE Project presentation17
Inactive learner: triggers when no traces received in #number of
minutes (e.g. 2 minutes)
> High % incorrect answers: after a minimum amount of
questions answered, if more than # %of the answers are wrong
Students that need attention
View for an specific student
(name anonymized)
xAPI GLA in games authoring
Previous game engine eAdventure (in Java)
• Helps to create educational
point & click adventure games
Platform updated to uAdventure (in Unity)
Full integration of game learning analytics
into uAdventure authoring tool
uAdventure games with default analytics
Include geolocalized games
uAdventure: geolocalized serious games
Geolocalized default analytics visualization
New Geolocalized game scenes and actions
Examples: First Aid - CPR validated game
• Collaboration with Centro de Tecnologias Educativas de Aragon, Spain
• Identify a cardiac arrest and teach how to do a cardiopulmonary
resuscitation to middle and high school students
• Validated game, in 2011, 4 schools with 340 students
Marchiori EJ, Ferrer G, Fernández-Manjón B, Povar Marco J, Suberviola González JF, Giménez Valverde A. Video-
game instruction in basic life support maneuvers. Emergencias. 2012;24:433-7.
BEACONING Experiments: data collection
227 students from 12 to 17 years old
Game rebuilt with uAdventure
Each student completed:
1. Pre-test (multiple-choice questions)
2. Complete gameplay (xAPI traces)
3. Post-test (multiple-choice questions)
104 variables identified for each player.
Replicability of results: knowledge acquisition
Original experiment with
the game
Original experiment, control
group
Current experiment
Lower learning than in
original experiment but still
significative!
GLA for Improving SG evaluation
Ideally: we would want to find a better evaluation
method for SGs, avoiding pre-post experiments. High
costs in time and effort.
Our first approach: use data mining techniques to
predict pre-test and post-test scores using the data
tracked from in-game interactions.
- To measure knowledge acquisition.
- But it could also work to measure attitude change or
awareness raised.
GLA data for Improving SG evaluation
Use data mining techniques to predict pre-test and post-test
scores using the data tracked from in-game interactions.
1. To avoid pre-test:
- Determine the influence of previous knowledge in game
results.
1. To avoid post-test:
- Determine the capability of game interactions to predict
post test results when combined with the pre test.
- Compare the previous capability to that of game
interactions on their own to predict post test results.
Improving SG evaluation
To avoid pre-test:
- Create prediction models of pre-test
using only game data
Score prediction:
- As binary category pass / fail
Prediction models used:
- Naïve Bayes
Method Precision Recall
Naive Bayes 0.69 0.84
Results obtained:
Improving SG evaluation
To avoid post-test:
- Create prediction models of post-test score using pre-test + game data
- Create prediction models of post-test score using only game data
Score prediction:
- As numeric value (from 1 to 15 in our game)
- As binary category pass / fail
Prediction models used:
- Trees
- Regression
- Naïve Bayes to compare results
Improving SG evaluation
To avoid post-test - summary of results obtained.
-Prediction of post-test score (1 to 15)
-Prediction of post-test pass / fail
Worse predictions without pre-test data but still acceptable results.
Method Pre-test ASE
Regression trees Yes 4.92
No 5.68
Linear regression Yes 5.81
No 5.71
Method Pre-test Precision Recall
Decision trees Yes 0.81 0.94
No 0.88 0.92
Logistic
regression
Yes 0.89 0.98
No 0.87 0.98
Naive Bayes Yes 0.92 0.89
No 0.89 0.90
New uses of games based on GLA
- Avoiding pre-test: Games for evaluation
- Avoiding post-test: Games for teaching and measure of learning
With or without pre-test.
BEACONING GLA Case study: Downtown
• Serious Game designed and develop to
teach young people with Down Syndrome
to move around the city using the subway
• Evaluated with 51 people with cognitive
dissabilities (mainly Down Syndrome)
• 42 users with all data
• 3h Gameplay/User
• 300K analytics xAPI data (traces) to
analyze
Case Study: Downtown
• From user requirements to a game
design and its observables
• Know more about how and what is
learn by people with Down Syndrome
31
Media Coverage
32
Game Design and Analysis Workflow
Present
Individualized
Learning Analysis
Collective
Learning Analysis Lea
….
Group 1
Group 2
Group 3
LearningProgress
d1.a d1.n
d2.a
d3.a
d2.n
d3.n
*d = Data collected during a game session
GLAID (Game Learning Analytics for Intellectual Disabilities
Analytics Framework
User 1
User 2
User n
User 1
User n
User 3 User 2
User 5
User 4
Data Handling
Designer Perspective Educator Perspe
User cognitive
restrictions
Formal
Requirements
Game & Learning
Design
Group of
Observables
Group of
Observables
Descriptive
Analytics
Clustering
Analytics
Predic
xAPI
33
Hyp 1: Users prefer to identify themselves
with the avatar • REFUTED
• None of the users selected the avatar with
Down features despite the trainers showed
them the avatar and pointed that that
character was Down.
• The majority of the users used the
preconfigured character despite they were
asked to customize the avatars at the beginning
of the game session.
• We are not observing significative evidences in
the users’ play patterns between those who
customize the character and those who don’t,
but it may be significative that the majority of
the users that changed the avatar were Down.
34
Hyp: High-Functioning users do a better
performance using the game
• To determine the cognitive skills and autonomy of the users we asked the
trainers to complete a test about each student
• 6 intelectual dimensions were measured (5-point Likert scale)
• General cognitive/intellectual ability
• Language and communication
• Memory acquisition
• Attention and distractibility
• Processing speed
• Executive functioning
• Users were divided in two groups: Medium-Functioning (≤ 3 avg.) and
High-Functioning (>3 avg.).
• MF = 19 (45.2%) HF = 23 (54.8%)
35
Hyp 2: High-Functioning users do a better
performance using the game
36
Number of MF users that played each level Number of HF users that played each level
Hyp 2: High-Functioning users do a better
performance using the game
37
Average time completing levels for MF Average time completing levels for HF
12:31:21
AM
12:37:02
AM
12:33:16
AM
EASY MEDIUM EXPERT
12:32:44 AM
12:28:33 AM
12:36:51 AM
12:25:58 AM
EASY MEDIUM HARD EXPERT
Hyp: ID users are engaged and motivated
while learning with a videogame
38
12:01:30 AM
12:01:03 AM
12:00:59 AM12:00:59 AM
12:00:50 AM
12:01:00 AM
12:00:36 AM12:00:38 AM
0:00
0:17
0:35
0:52
1:09
1:26
1:44
1 2 3 4 5 6 7 8
• Inactivity times reduced
in a 70,7% avg. from
session #1 to session #8
• Positive and motivational
learning environment
(98,2% users show
improvement and
engagement performing
the videogame tasks)
Average inactivity time evolution
avgtime
game session
Hyp: The game design of Downtown is
effective as a learning tool
39
• 100% of the trainers agree
that the use of Downtown
would enhance the user
learning adquisition
(Perceived Usefulness)
• 85,8% of the users were
able to follow the right
path (both LF and HF)
• 50,8% of the wrong path
occured during the first 30
min. of playing
0
20
40
60
80
100
120
140
160
180
1 2 3 4 5 6
Correct vs Incorrect Path per Game session
(#correct stations vs #incorrect stations)
count
game session
Cyberbullying: Conectado game
Educational desing
● Adventure game- sentiments and emotions are important
● Real situations familiar for students
● Events based on user decision making (but no agression options)
● Scenarios based on research about bullying and cyberbullying
● Different roles of bullying represented
● Designed to be used at classroom
Game mechanics
Seminario eMadrid sobre Serious gaes 2017-02-24 42
New student in school
Occurs during 5 days
Minigames as “nightmares”
Implications of the social networks
The experiment: initial validation
With students from 3 schools( Madrid, Zaragoza, Teruel)
257 students
223 Valid pre-post and gameplays (121 males, 102 females)
Significant increase in the ciberbullying
perception
Wilcoxon paired test, p<0.001
5.72
6.38
Next steps in the project
•Currently validating its use as a tool for teachers
• Al least with 100 teachers
• At least with 100 educational sciences students
• Validating the dashboards with the teachers
• Does the dashboard provide the right and meaningful information
• Does the average teacher understand the dashboard
• Are the errors and warnings useful for teachers?
• Next: Go into full scale final validation with at least 1000 students
• Teachers use the game with their students at class
• We got all the analytics data
First validation experience with teachers: perception
13 teachers (11 complete data sets)
Experiment with teachers: applicability of the game
Conclusions
• Game Learning Analytics has a great potential from the business,
application and research perspective
• Still complex to implement GLA in SG
• Increases the (already high) cost of the games
• Requires expertise not always present in SME
• New standards specifications and open software development could
greatly simplify GLA implementation and adoption
48
49
Thank You!
Gracias!
¿Questions?
• Mail: balta@fdi.ucm.es
• Twitter: @BaltaFM
• GScholar: https://scholar.google.es/citations?user=eNJxjcwAAAAJ&hl=en&oi=ao
• ResearchGate: www.researchgate.net/profile/Baltasar_Fernandez-Manjon
• Slideshare: http://www.slideshare.net/BaltasarFernandezManjon
Hyp 3: Users with previous experience in transportation
training have a better performance using the game
50
12:30:15 AM
12:32:03 AM
12:00:00 AM
12:07:12 AM
12:14:24 AM
12:21:36 AM
12:28:48 AM
12:36:00 AM
12:43:12 AM
12:50:24 AM
No trained Previously trained
Average time completing tasks
Users with no training vs users previously trained
REFUTED
• Almost no differences
between trained and no
trained users regarding
time completing tasks
• Learning curve using the
videogame is independant
of the previous experience
using the public
transportation system
avgtime
Hyp 4: Technology-trained users do a better
performance using the game
51
12:32:16 AM
12:28:18 AM
12:00:00 AM
12:07:12 AM
12:14:24 AM
12:21:36 AM
12:28:48 AM
12:36:00 AM
No Videogame Players Videogame Players
Average time completing tasks
No videogame players vs videogame players
CONFIRMED
• Users that play videogames
often completed the game
sessions faster than users
that are not used to play
videogames at home
avgtime
http://www.celt.iastate.edu/teaching-resources/effective-practice/revised-blooms-taxonomy/

Learning analytics for improving educational games jcsg2017

  • 1.
    Using Learning Analyticsto improve Serious Games Baltasar Fernandez-Manjon balta@fdi.ucm.es , @BaltaFM e-UCM Research Group , www.e-ucm.es Jornadas eMadrid, 2017, 04/07/2017 Realising an Applied Gaming Eco-System JCSG 2017, Universidad Politécnica de Valencia
  • 2.
    Open issues withserious games - Do serious games actually work? - Very few SG have a full formal evaluation (e.g. pre-post) - Usually tested with a very limited number of users - Formal evaluation could be as expensive as creating the game (or even more expensive) - Evaluation is not considered as a strong requirement - Difficult to deploy games in the classroom - Teachers have very little info about what is happening when a game is being used
  • 3.
    Learning analytics • Improvingeducation based on data analysis • Data driven • From only theory-driven to evidence-based • Off-line • Analyzing data after use • Discovering patterns of use • Allows to improve the educacional experience for future • Real time • Analyzing data while the system is in use to improve/adapt the current learning experience • Allows to also use it in actual presential classes
  • 4.
    Game Analytics • Applicationof analytics to game development and research • Telemetry • Data obtained over distance • Mobile games, MMOG • Game metrics • Interpretable measures of data related to games • Player behaviour
  • 5.
    Game Learning Analytics(GLA) or Informagic? • GLA is learning analytics applied to serious games • collect, analyze and visualize data from learners’ interactions with SG • Informagic • False expectations of gaining full insight on the game educational experience based only on very shallow game interaction data • Set more realistic expectations about learning analytics with serious games • Requirements • Outcomes • Uses • Cost/Complexity Perez-Colado, I. J., Alonso-Fernández, C., Freire-Moran, M., Martinez-Ortiz, I., & Fernández-Manjón, B. (2018). Game Learning Analytics is not informagic! In IEEE Global Engineering Education Conference (EDUCON).
  • 6.
    Uses of GamingLearning Analytics in educational games • Game testing – game analytics • It is the game realiable? • How many students finish the game? • Average time to complete the game? • Game deployment in the class – tools for teachers • Real-time information for supporting the teacher • Knowing what is happening when the game is deployed in the class • “Stealth” student evaluation • Formal Game evaluation • From pre-post test to evaluation based on game learning analytics??
  • 7.
    Minimun Game Requirementsfor GLA • Most of games are black boxes. • No access to what is going on during game play • We need access to game “guts” • User interactions • Changes of the game state or game variables • Or the game must communicate with the outside world • Using some logging framework • What is the meaning of the that data? • Adequate experimental design and setting • Are users informed? • Anonymization of data could be required
  • 8.
  • 9.
    Evidence-centered assessment design(ECD) The Conceptual Assessment Framework (CAF) Student Model: What Are We Measuring? Evidence Model: How Do We Measure It? Task Model: Where Do We Measure It? Assembly Model: How Much Do We Need to Measure It? (Mislevy, Riconscente, 2005)
  • 10.
  • 11.
  • 12.
    xAPI Serious Gamesapplication profile Standard interactions model developed and implemented in Experience API (xAPI) by UCM with ADL (Ángel Serrano et al, 2017). The model allows tracking of all in-game interactions as xAPI traces (e.g. level started or completed) Now being extended in BEACONING to geolocalized games IEEE stardarization group on xAPI https://www.adlnet.gov/serious-games-cop
  • 13.
    Game Learning Analytics CanGLA be systematized? Realising an Applied Gaming Eco-System
  • 14.
    Java xApi Tracker Unity xApi Tracker C# xApiTracker Game trackers and cloud analytics frameworks as open code (github) https://github.com/e-ucm
  • 15.
    Client A2 Applications Games Analytics Frontend A2 Frontend PlayersDevs,Students, Teachers. Admins Users Roles Resources Permissions Applications Authentication Authorization JWT JSON WEB TOKEN Topology AnalyticsBackend Games Sessions Collector Results Application 1 Application N KafkaQueue Games Sessions Results Visualization Architecture and technologies Open code to be deployed in your server You own all your game analytics data
  • 16.
    Systematization of AnalyticsDashboards As long as traces follow xAPI format, these analysis do not require further configuration! Also possible to configure game-dependent analysis and visualizations for specific games and game characteristics.
  • 17.
    Real-time analytics: Alertsand Warnings • Identify situations that may require teacher intervention • Fully customizable alert and warning system for real-time teacher feedback 24/11/RAGE Project presentation17 Inactive learner: triggers when no traces received in #number of minutes (e.g. 2 minutes) > High % incorrect answers: after a minimum amount of questions answered, if more than # %of the answers are wrong Students that need attention View for an specific student (name anonymized)
  • 18.
    xAPI GLA ingames authoring Previous game engine eAdventure (in Java) • Helps to create educational point & click adventure games Platform updated to uAdventure (in Unity) Full integration of game learning analytics into uAdventure authoring tool uAdventure games with default analytics Include geolocalized games
  • 19.
    uAdventure: geolocalized seriousgames Geolocalized default analytics visualization New Geolocalized game scenes and actions
  • 21.
    Examples: First Aid- CPR validated game • Collaboration with Centro de Tecnologias Educativas de Aragon, Spain • Identify a cardiac arrest and teach how to do a cardiopulmonary resuscitation to middle and high school students • Validated game, in 2011, 4 schools with 340 students Marchiori EJ, Ferrer G, Fernández-Manjón B, Povar Marco J, Suberviola González JF, Giménez Valverde A. Video- game instruction in basic life support maneuvers. Emergencias. 2012;24:433-7.
  • 22.
    BEACONING Experiments: datacollection 227 students from 12 to 17 years old Game rebuilt with uAdventure Each student completed: 1. Pre-test (multiple-choice questions) 2. Complete gameplay (xAPI traces) 3. Post-test (multiple-choice questions) 104 variables identified for each player.
  • 23.
    Replicability of results:knowledge acquisition Original experiment with the game Original experiment, control group Current experiment Lower learning than in original experiment but still significative!
  • 24.
    GLA for ImprovingSG evaluation Ideally: we would want to find a better evaluation method for SGs, avoiding pre-post experiments. High costs in time and effort. Our first approach: use data mining techniques to predict pre-test and post-test scores using the data tracked from in-game interactions. - To measure knowledge acquisition. - But it could also work to measure attitude change or awareness raised.
  • 25.
    GLA data forImproving SG evaluation Use data mining techniques to predict pre-test and post-test scores using the data tracked from in-game interactions. 1. To avoid pre-test: - Determine the influence of previous knowledge in game results. 1. To avoid post-test: - Determine the capability of game interactions to predict post test results when combined with the pre test. - Compare the previous capability to that of game interactions on their own to predict post test results.
  • 26.
    Improving SG evaluation Toavoid pre-test: - Create prediction models of pre-test using only game data Score prediction: - As binary category pass / fail Prediction models used: - Naïve Bayes Method Precision Recall Naive Bayes 0.69 0.84 Results obtained:
  • 27.
    Improving SG evaluation Toavoid post-test: - Create prediction models of post-test score using pre-test + game data - Create prediction models of post-test score using only game data Score prediction: - As numeric value (from 1 to 15 in our game) - As binary category pass / fail Prediction models used: - Trees - Regression - Naïve Bayes to compare results
  • 28.
    Improving SG evaluation Toavoid post-test - summary of results obtained. -Prediction of post-test score (1 to 15) -Prediction of post-test pass / fail Worse predictions without pre-test data but still acceptable results. Method Pre-test ASE Regression trees Yes 4.92 No 5.68 Linear regression Yes 5.81 No 5.71 Method Pre-test Precision Recall Decision trees Yes 0.81 0.94 No 0.88 0.92 Logistic regression Yes 0.89 0.98 No 0.87 0.98 Naive Bayes Yes 0.92 0.89 No 0.89 0.90
  • 29.
    New uses ofgames based on GLA - Avoiding pre-test: Games for evaluation - Avoiding post-test: Games for teaching and measure of learning With or without pre-test.
  • 30.
    BEACONING GLA Casestudy: Downtown • Serious Game designed and develop to teach young people with Down Syndrome to move around the city using the subway • Evaluated with 51 people with cognitive dissabilities (mainly Down Syndrome) • 42 users with all data • 3h Gameplay/User • 300K analytics xAPI data (traces) to analyze
  • 31.
    Case Study: Downtown •From user requirements to a game design and its observables • Know more about how and what is learn by people with Down Syndrome 31
  • 32.
  • 33.
    Game Design andAnalysis Workflow Present Individualized Learning Analysis Collective Learning Analysis Lea …. Group 1 Group 2 Group 3 LearningProgress d1.a d1.n d2.a d3.a d2.n d3.n *d = Data collected during a game session GLAID (Game Learning Analytics for Intellectual Disabilities Analytics Framework User 1 User 2 User n User 1 User n User 3 User 2 User 5 User 4 Data Handling Designer Perspective Educator Perspe User cognitive restrictions Formal Requirements Game & Learning Design Group of Observables Group of Observables Descriptive Analytics Clustering Analytics Predic xAPI 33
  • 34.
    Hyp 1: Usersprefer to identify themselves with the avatar • REFUTED • None of the users selected the avatar with Down features despite the trainers showed them the avatar and pointed that that character was Down. • The majority of the users used the preconfigured character despite they were asked to customize the avatars at the beginning of the game session. • We are not observing significative evidences in the users’ play patterns between those who customize the character and those who don’t, but it may be significative that the majority of the users that changed the avatar were Down. 34
  • 35.
    Hyp: High-Functioning usersdo a better performance using the game • To determine the cognitive skills and autonomy of the users we asked the trainers to complete a test about each student • 6 intelectual dimensions were measured (5-point Likert scale) • General cognitive/intellectual ability • Language and communication • Memory acquisition • Attention and distractibility • Processing speed • Executive functioning • Users were divided in two groups: Medium-Functioning (≤ 3 avg.) and High-Functioning (>3 avg.). • MF = 19 (45.2%) HF = 23 (54.8%) 35
  • 36.
    Hyp 2: High-Functioningusers do a better performance using the game 36 Number of MF users that played each level Number of HF users that played each level
  • 37.
    Hyp 2: High-Functioningusers do a better performance using the game 37 Average time completing levels for MF Average time completing levels for HF 12:31:21 AM 12:37:02 AM 12:33:16 AM EASY MEDIUM EXPERT 12:32:44 AM 12:28:33 AM 12:36:51 AM 12:25:58 AM EASY MEDIUM HARD EXPERT
  • 38.
    Hyp: ID usersare engaged and motivated while learning with a videogame 38 12:01:30 AM 12:01:03 AM 12:00:59 AM12:00:59 AM 12:00:50 AM 12:01:00 AM 12:00:36 AM12:00:38 AM 0:00 0:17 0:35 0:52 1:09 1:26 1:44 1 2 3 4 5 6 7 8 • Inactivity times reduced in a 70,7% avg. from session #1 to session #8 • Positive and motivational learning environment (98,2% users show improvement and engagement performing the videogame tasks) Average inactivity time evolution avgtime game session
  • 39.
    Hyp: The gamedesign of Downtown is effective as a learning tool 39 • 100% of the trainers agree that the use of Downtown would enhance the user learning adquisition (Perceived Usefulness) • 85,8% of the users were able to follow the right path (both LF and HF) • 50,8% of the wrong path occured during the first 30 min. of playing 0 20 40 60 80 100 120 140 160 180 1 2 3 4 5 6 Correct vs Incorrect Path per Game session (#correct stations vs #incorrect stations) count game session
  • 40.
  • 41.
    Educational desing ● Adventuregame- sentiments and emotions are important ● Real situations familiar for students ● Events based on user decision making (but no agression options) ● Scenarios based on research about bullying and cyberbullying ● Different roles of bullying represented ● Designed to be used at classroom
  • 42.
    Game mechanics Seminario eMadridsobre Serious gaes 2017-02-24 42 New student in school Occurs during 5 days Minigames as “nightmares” Implications of the social networks
  • 43.
    The experiment: initialvalidation With students from 3 schools( Madrid, Zaragoza, Teruel) 257 students 223 Valid pre-post and gameplays (121 males, 102 females)
  • 44.
    Significant increase inthe ciberbullying perception Wilcoxon paired test, p<0.001 5.72 6.38
  • 45.
    Next steps inthe project •Currently validating its use as a tool for teachers • Al least with 100 teachers • At least with 100 educational sciences students • Validating the dashboards with the teachers • Does the dashboard provide the right and meaningful information • Does the average teacher understand the dashboard • Are the errors and warnings useful for teachers? • Next: Go into full scale final validation with at least 1000 students • Teachers use the game with their students at class • We got all the analytics data
  • 46.
    First validation experiencewith teachers: perception 13 teachers (11 complete data sets)
  • 47.
    Experiment with teachers:applicability of the game
  • 48.
    Conclusions • Game LearningAnalytics has a great potential from the business, application and research perspective • Still complex to implement GLA in SG • Increases the (already high) cost of the games • Requires expertise not always present in SME • New standards specifications and open software development could greatly simplify GLA implementation and adoption 48
  • 49.
    49 Thank You! Gracias! ¿Questions? • Mail:balta@fdi.ucm.es • Twitter: @BaltaFM • GScholar: https://scholar.google.es/citations?user=eNJxjcwAAAAJ&hl=en&oi=ao • ResearchGate: www.researchgate.net/profile/Baltasar_Fernandez-Manjon • Slideshare: http://www.slideshare.net/BaltasarFernandezManjon
  • 50.
    Hyp 3: Userswith previous experience in transportation training have a better performance using the game 50 12:30:15 AM 12:32:03 AM 12:00:00 AM 12:07:12 AM 12:14:24 AM 12:21:36 AM 12:28:48 AM 12:36:00 AM 12:43:12 AM 12:50:24 AM No trained Previously trained Average time completing tasks Users with no training vs users previously trained REFUTED • Almost no differences between trained and no trained users regarding time completing tasks • Learning curve using the videogame is independant of the previous experience using the public transportation system avgtime
  • 51.
    Hyp 4: Technology-trainedusers do a better performance using the game 51 12:32:16 AM 12:28:18 AM 12:00:00 AM 12:07:12 AM 12:14:24 AM 12:21:36 AM 12:28:48 AM 12:36:00 AM No Videogame Players Videogame Players Average time completing tasks No videogame players vs videogame players CONFIRMED • Users that play videogames often completed the game sessions faster than users that are not used to play videogames at home avgtime
  • 52.

Editor's Notes