Download to read offline

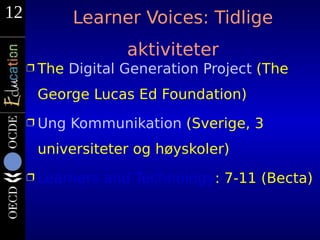

The document discusses a presentation given by Øystein Johannessen from the OECD about capturing "learner voices" on the use of technology in education. The presentation outlines a project to collect student perspectives and experiences through video interviews in order to inform public policy debates. It aims to uncover national differences in how students view and expect to use technology for learning. The presentation also asks the audience for input on what questions to ask students and how teacher education can make use of the collected student perspectives.