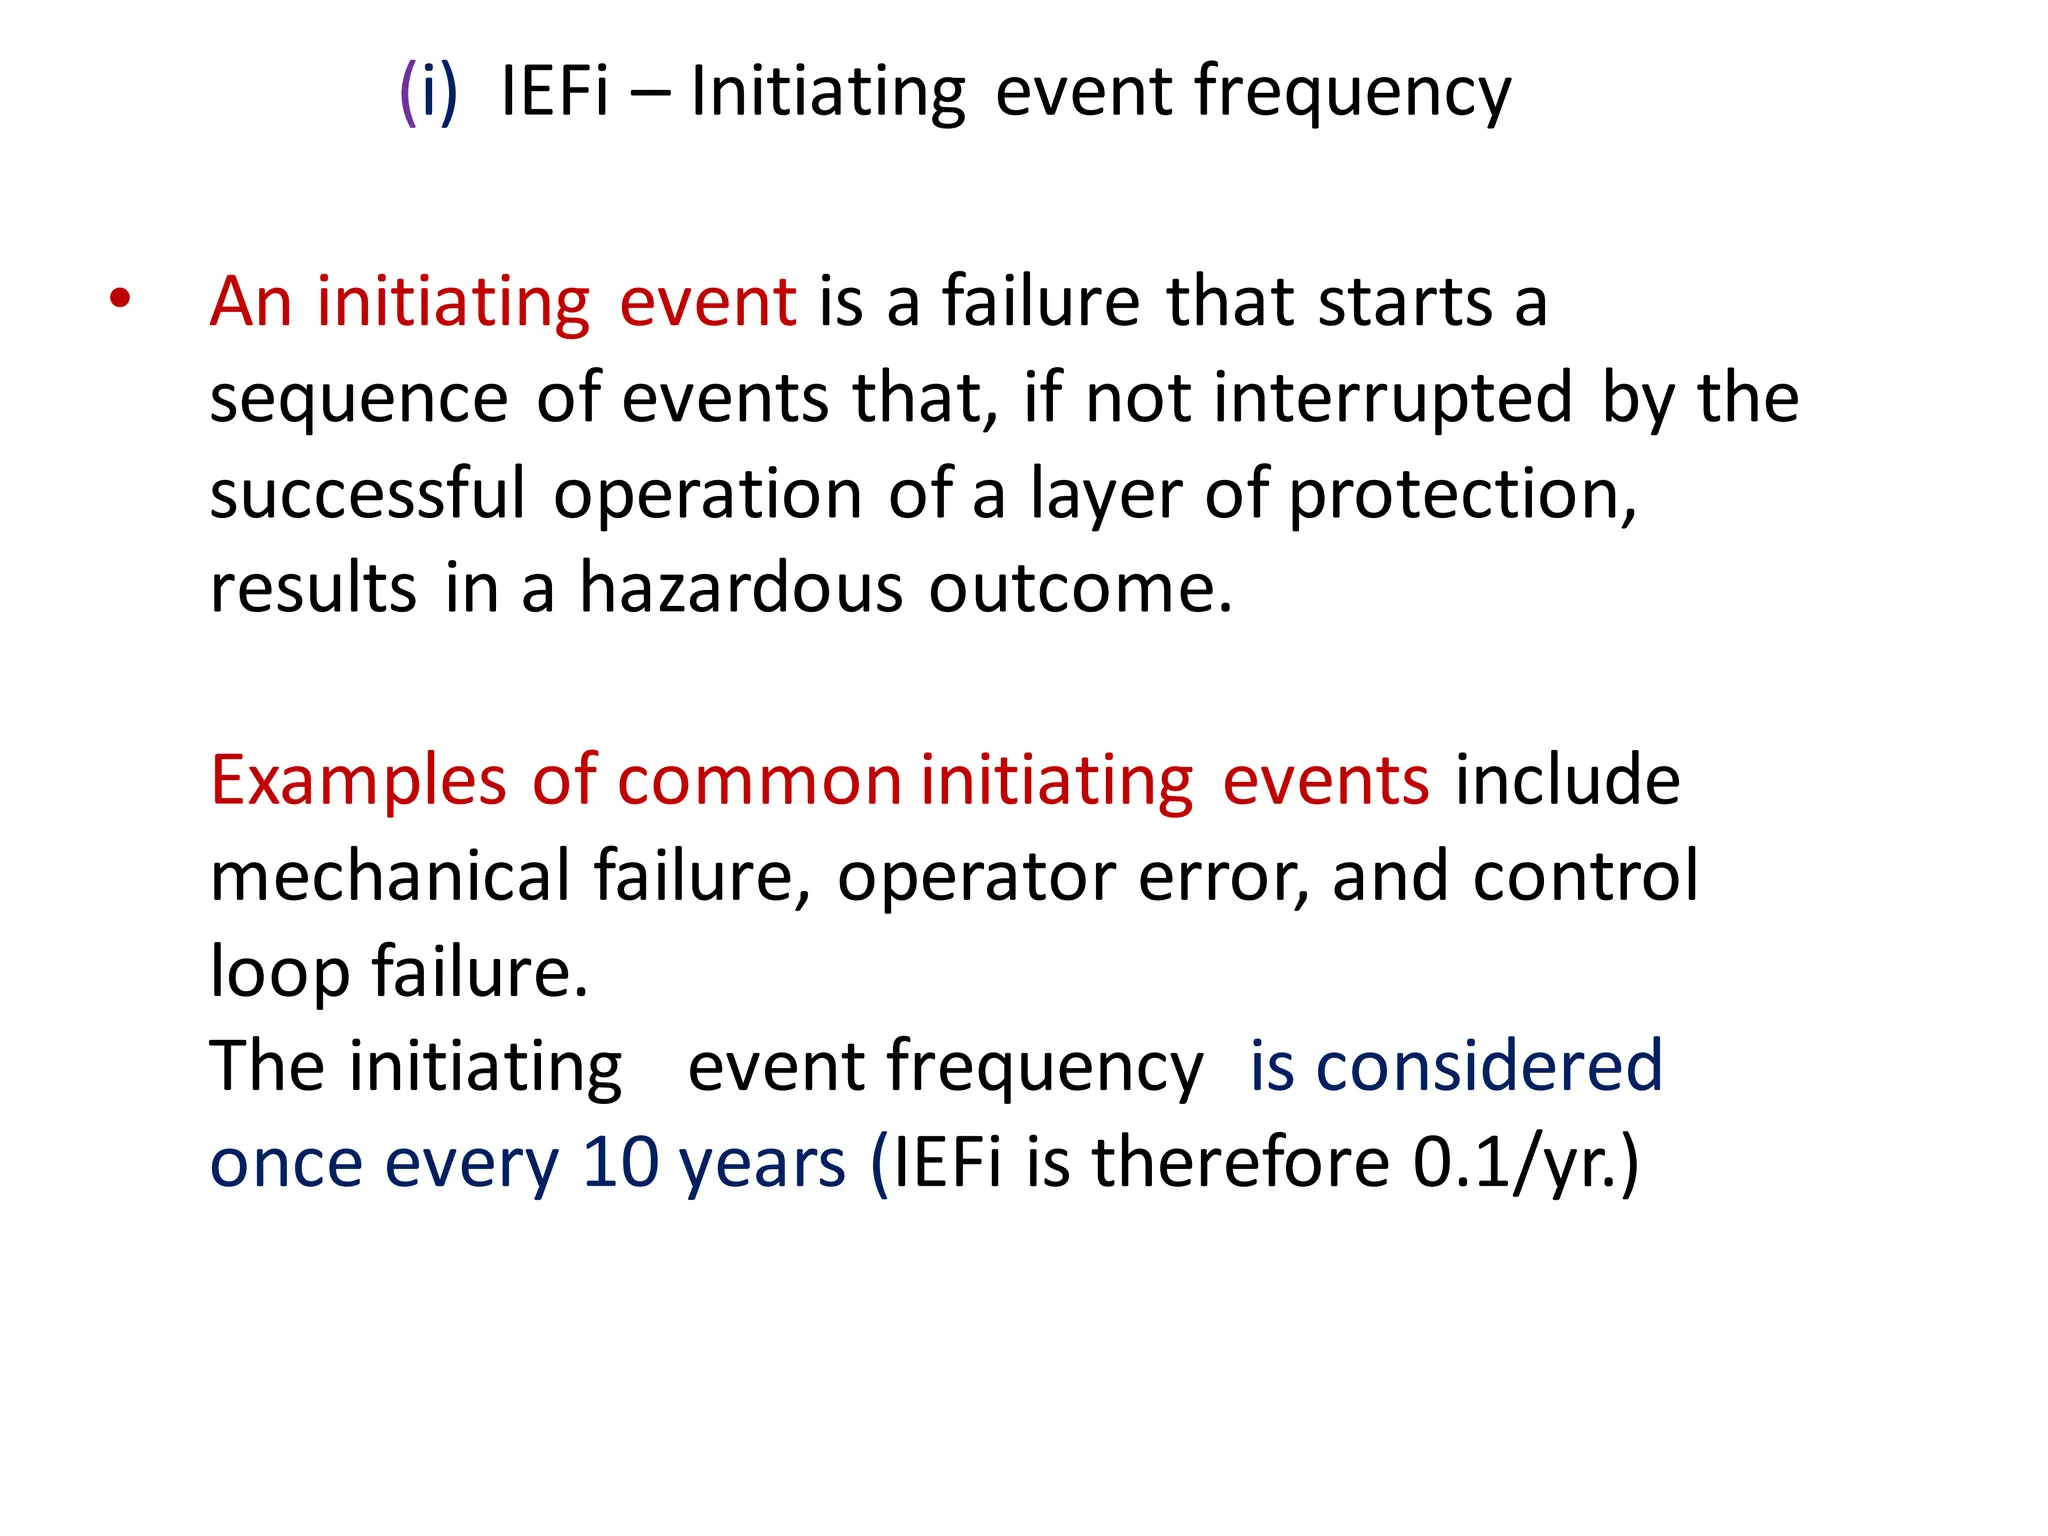
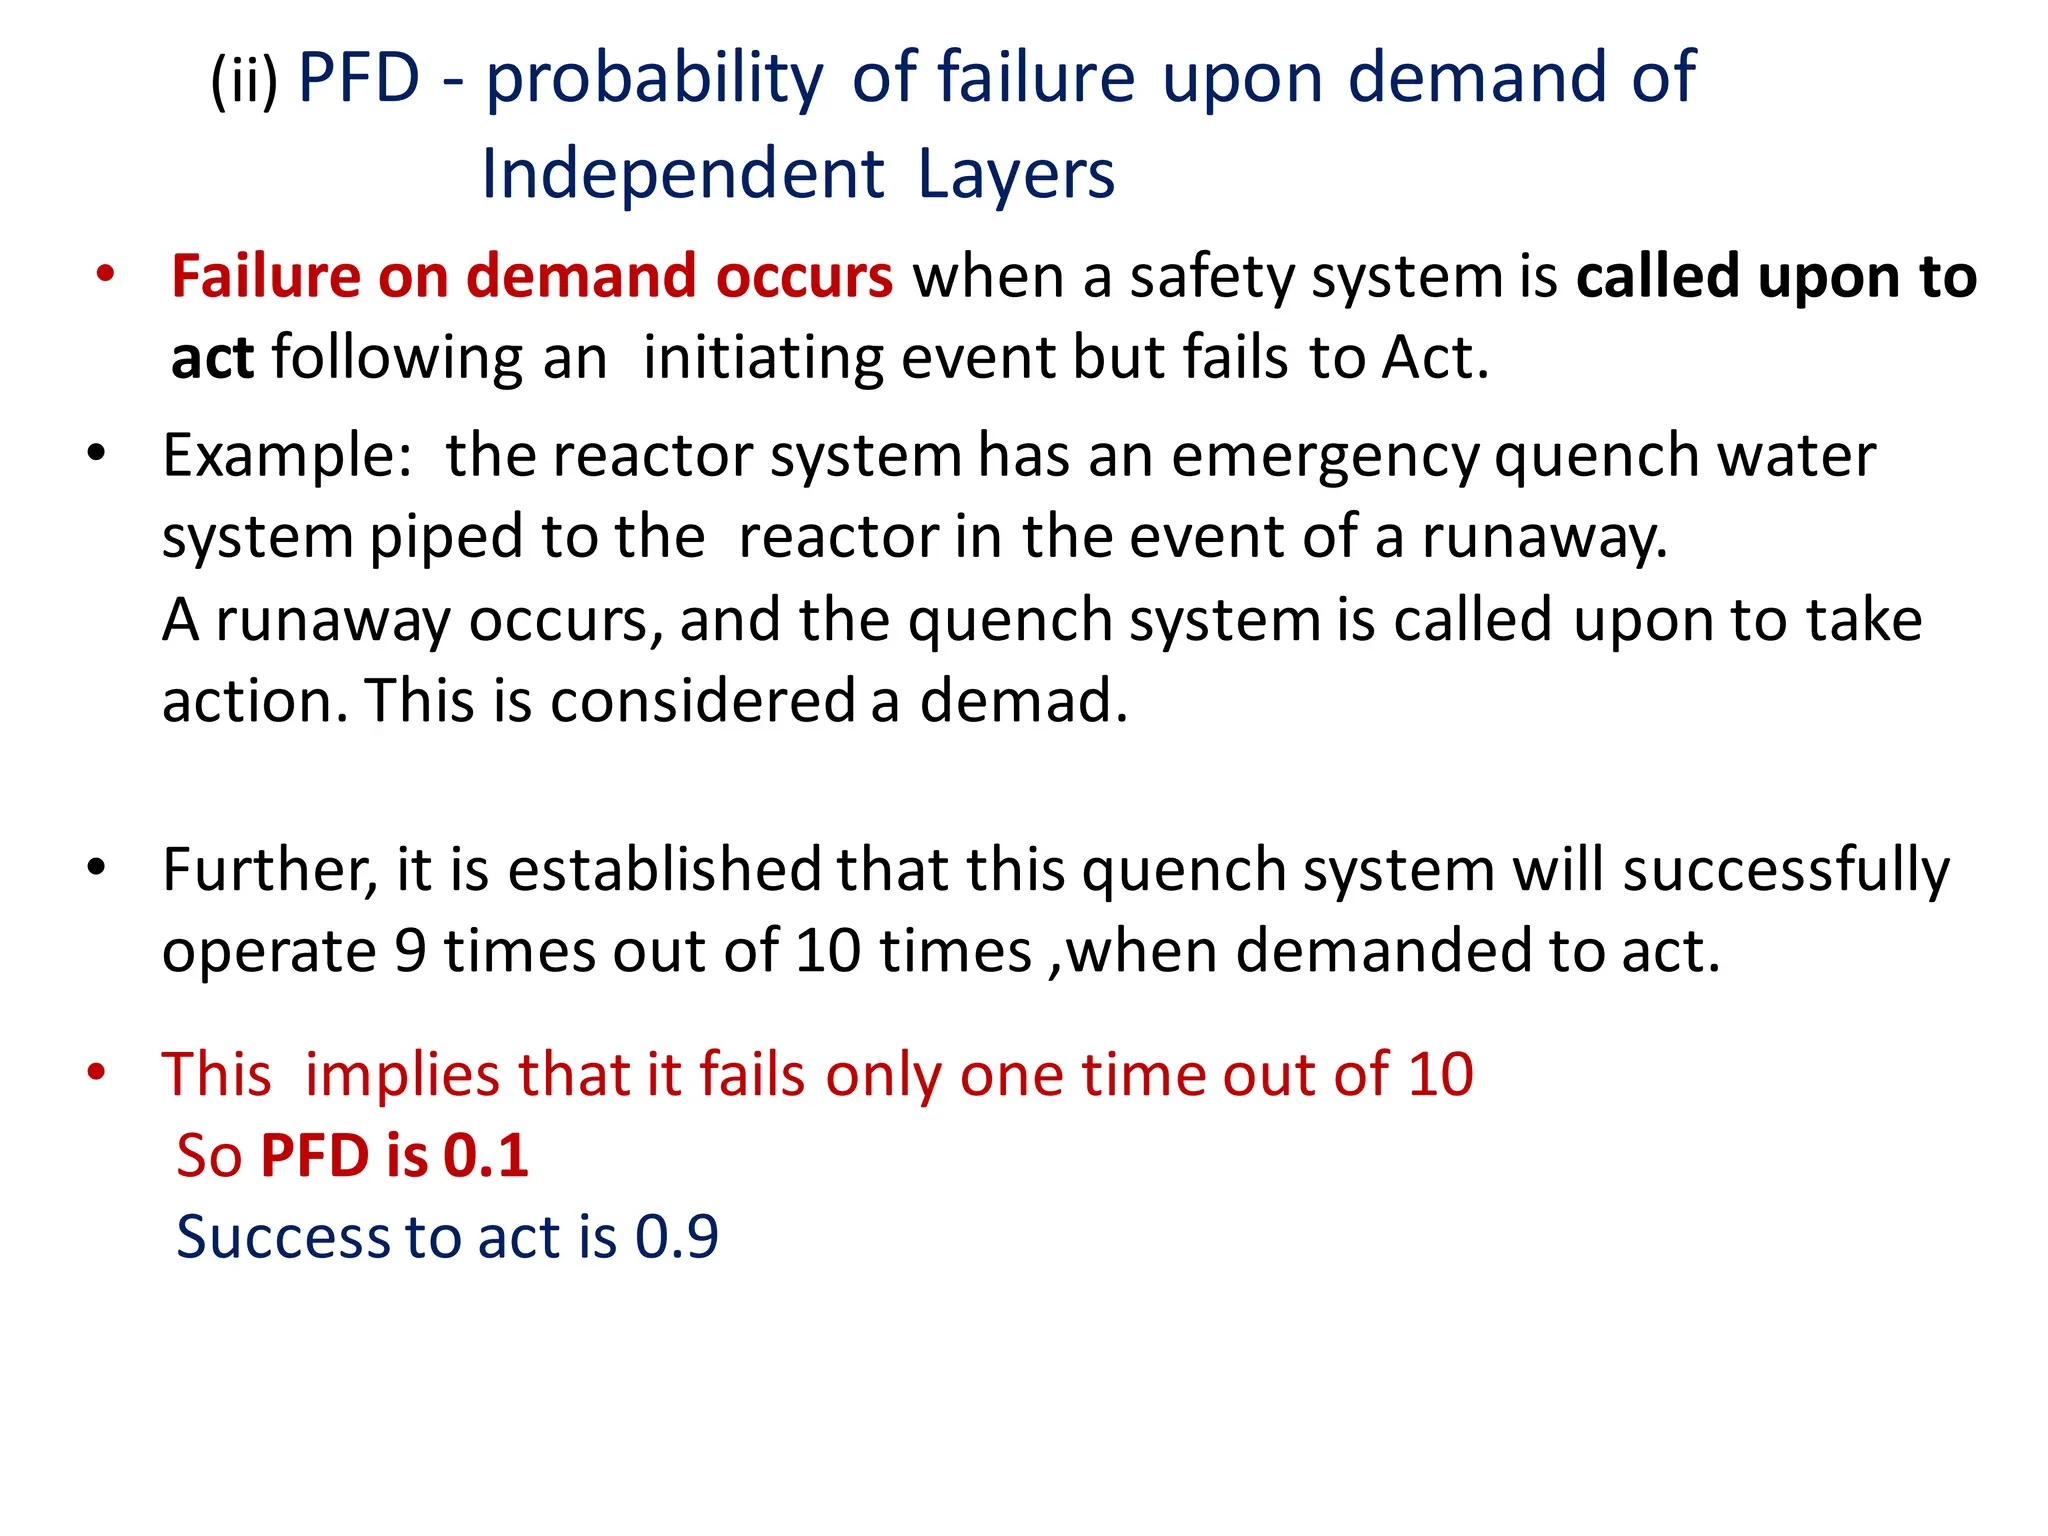
Download as PDF, PPTX
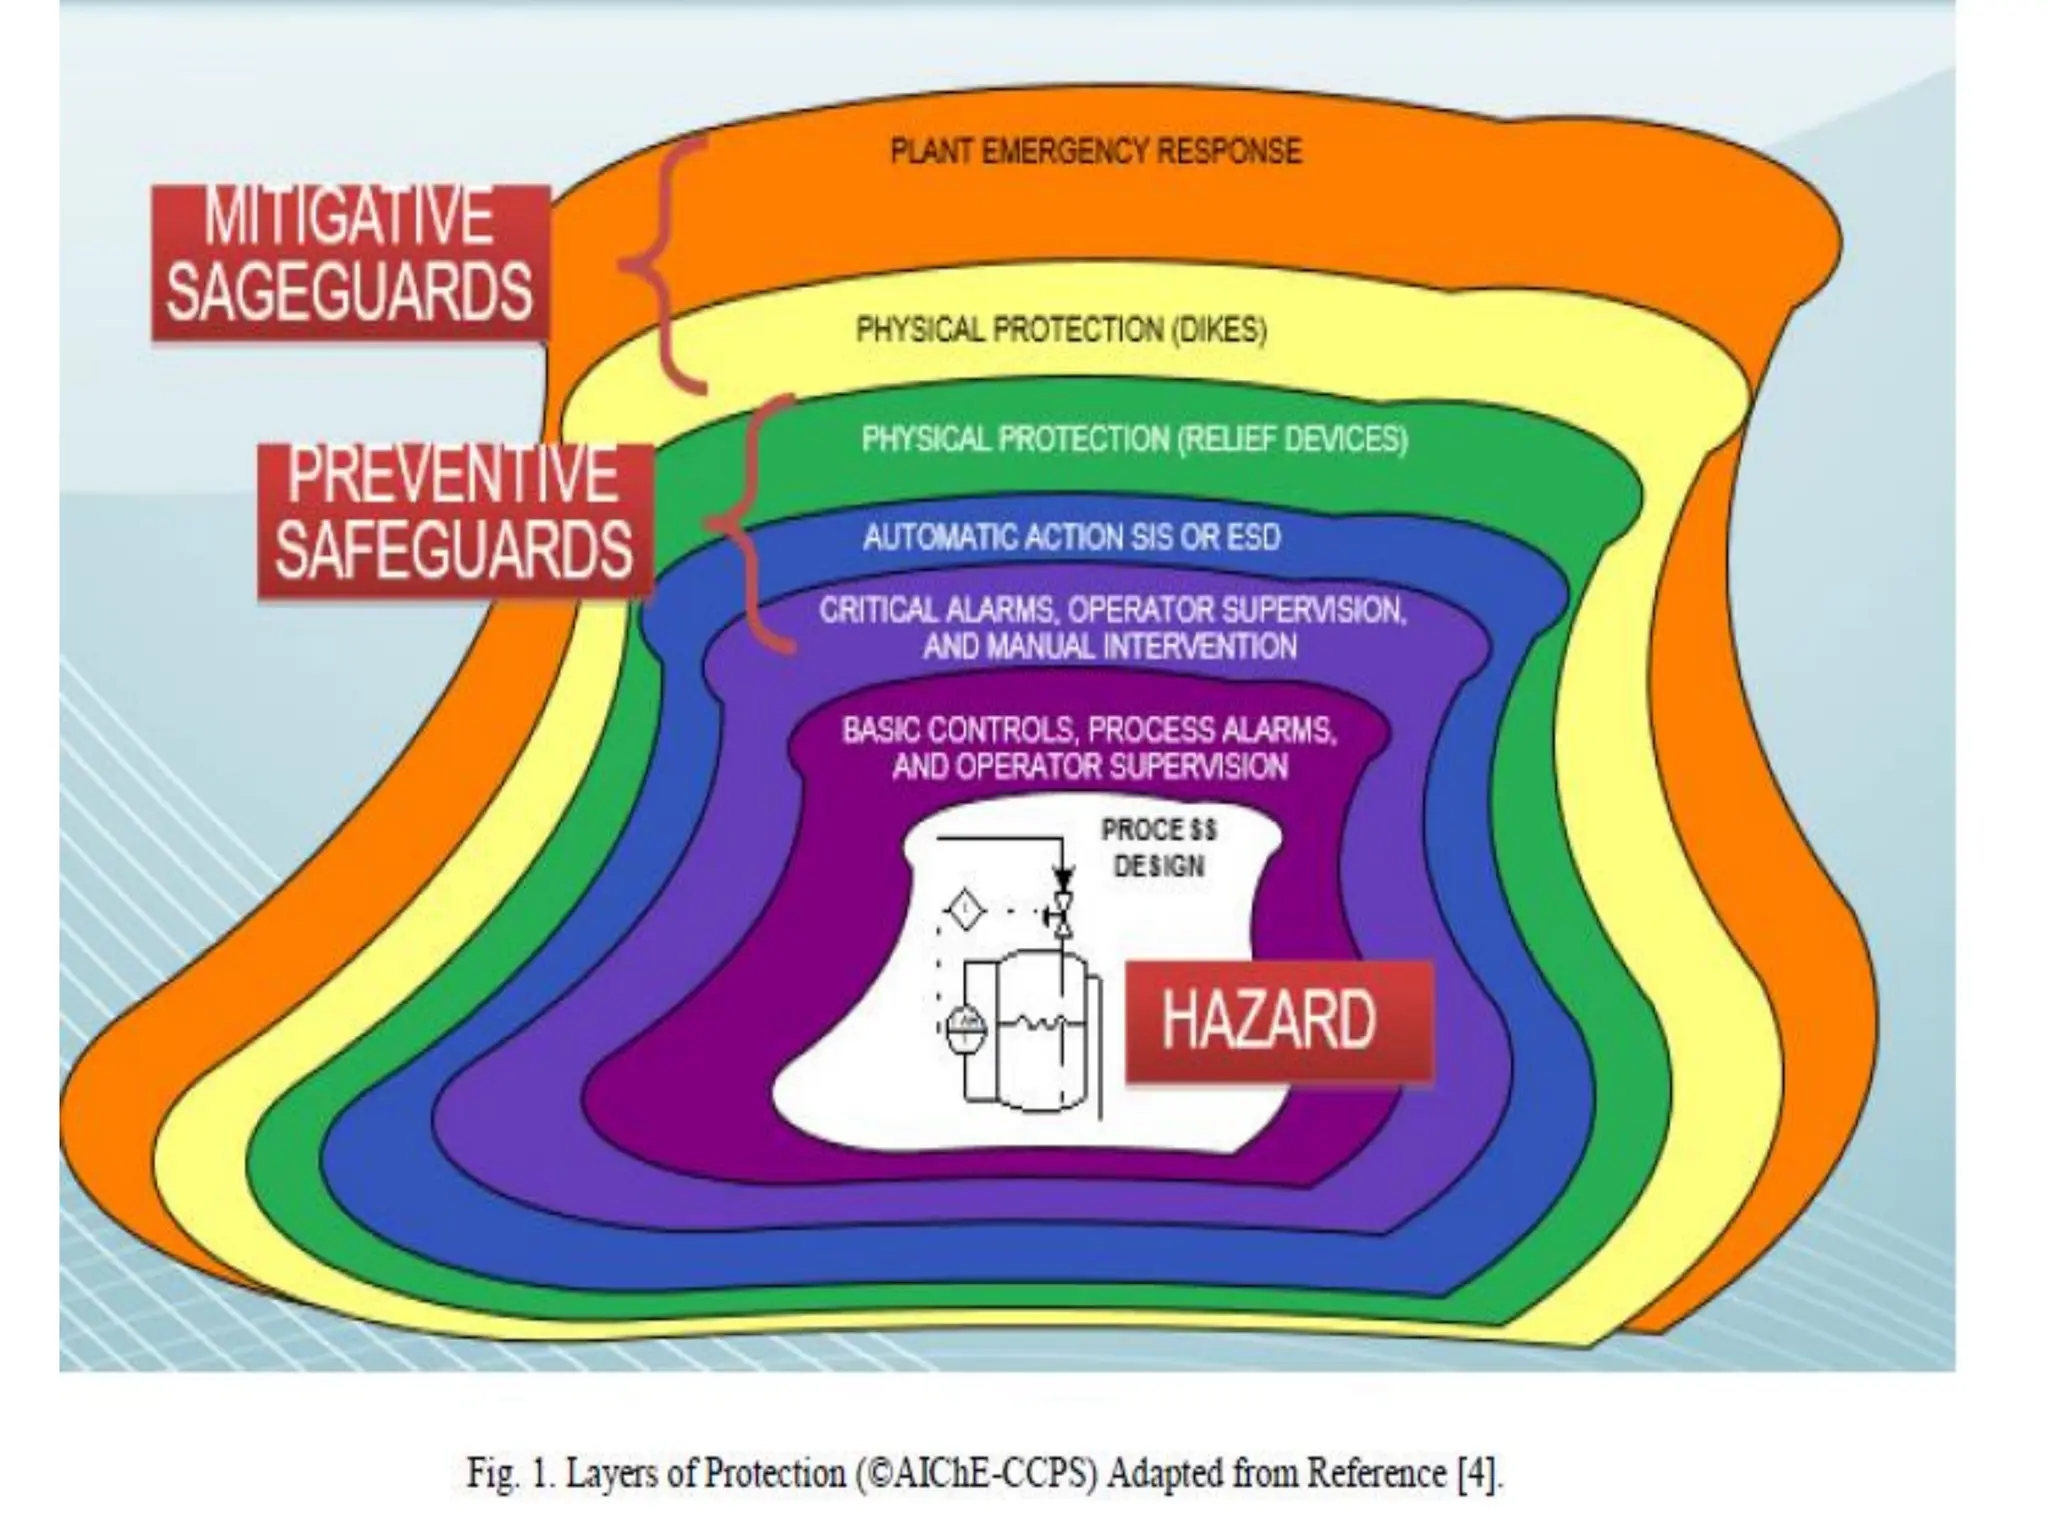
![* Safety protection of a facility or chemical plant is broken
down into layers.
*Seven layers are shown in Fig. 1 and are
generally applied beginning at the center of the diagram.
Layer 1: Process Design (e.g. inherently safer designs);
Layer 2: Basic controls, process alarms, and operator
supervision;
Layer 3: Critical alarms, operator supervision, and manual
intervention;
Layer 4: Automaticaction (e.g. SIS or ESD);
Layer 5: Physical protection (e.g. relief devices);
Layer 6: Physical protection (e.g. dikes);
Layer 7: Plant emergency response; and not shown
Layer 8: Community emergency response[9].
EACH LAYER HAS TO BE INDEPENENT .
Concept of layers of protection( LOPA)](https://image.slidesharecdn.com/lopavshazop-240518135140-cfc88c7c/75/Layers-of-Protection-Analysis-vs-Hazop-pdf-7-2048.jpg)
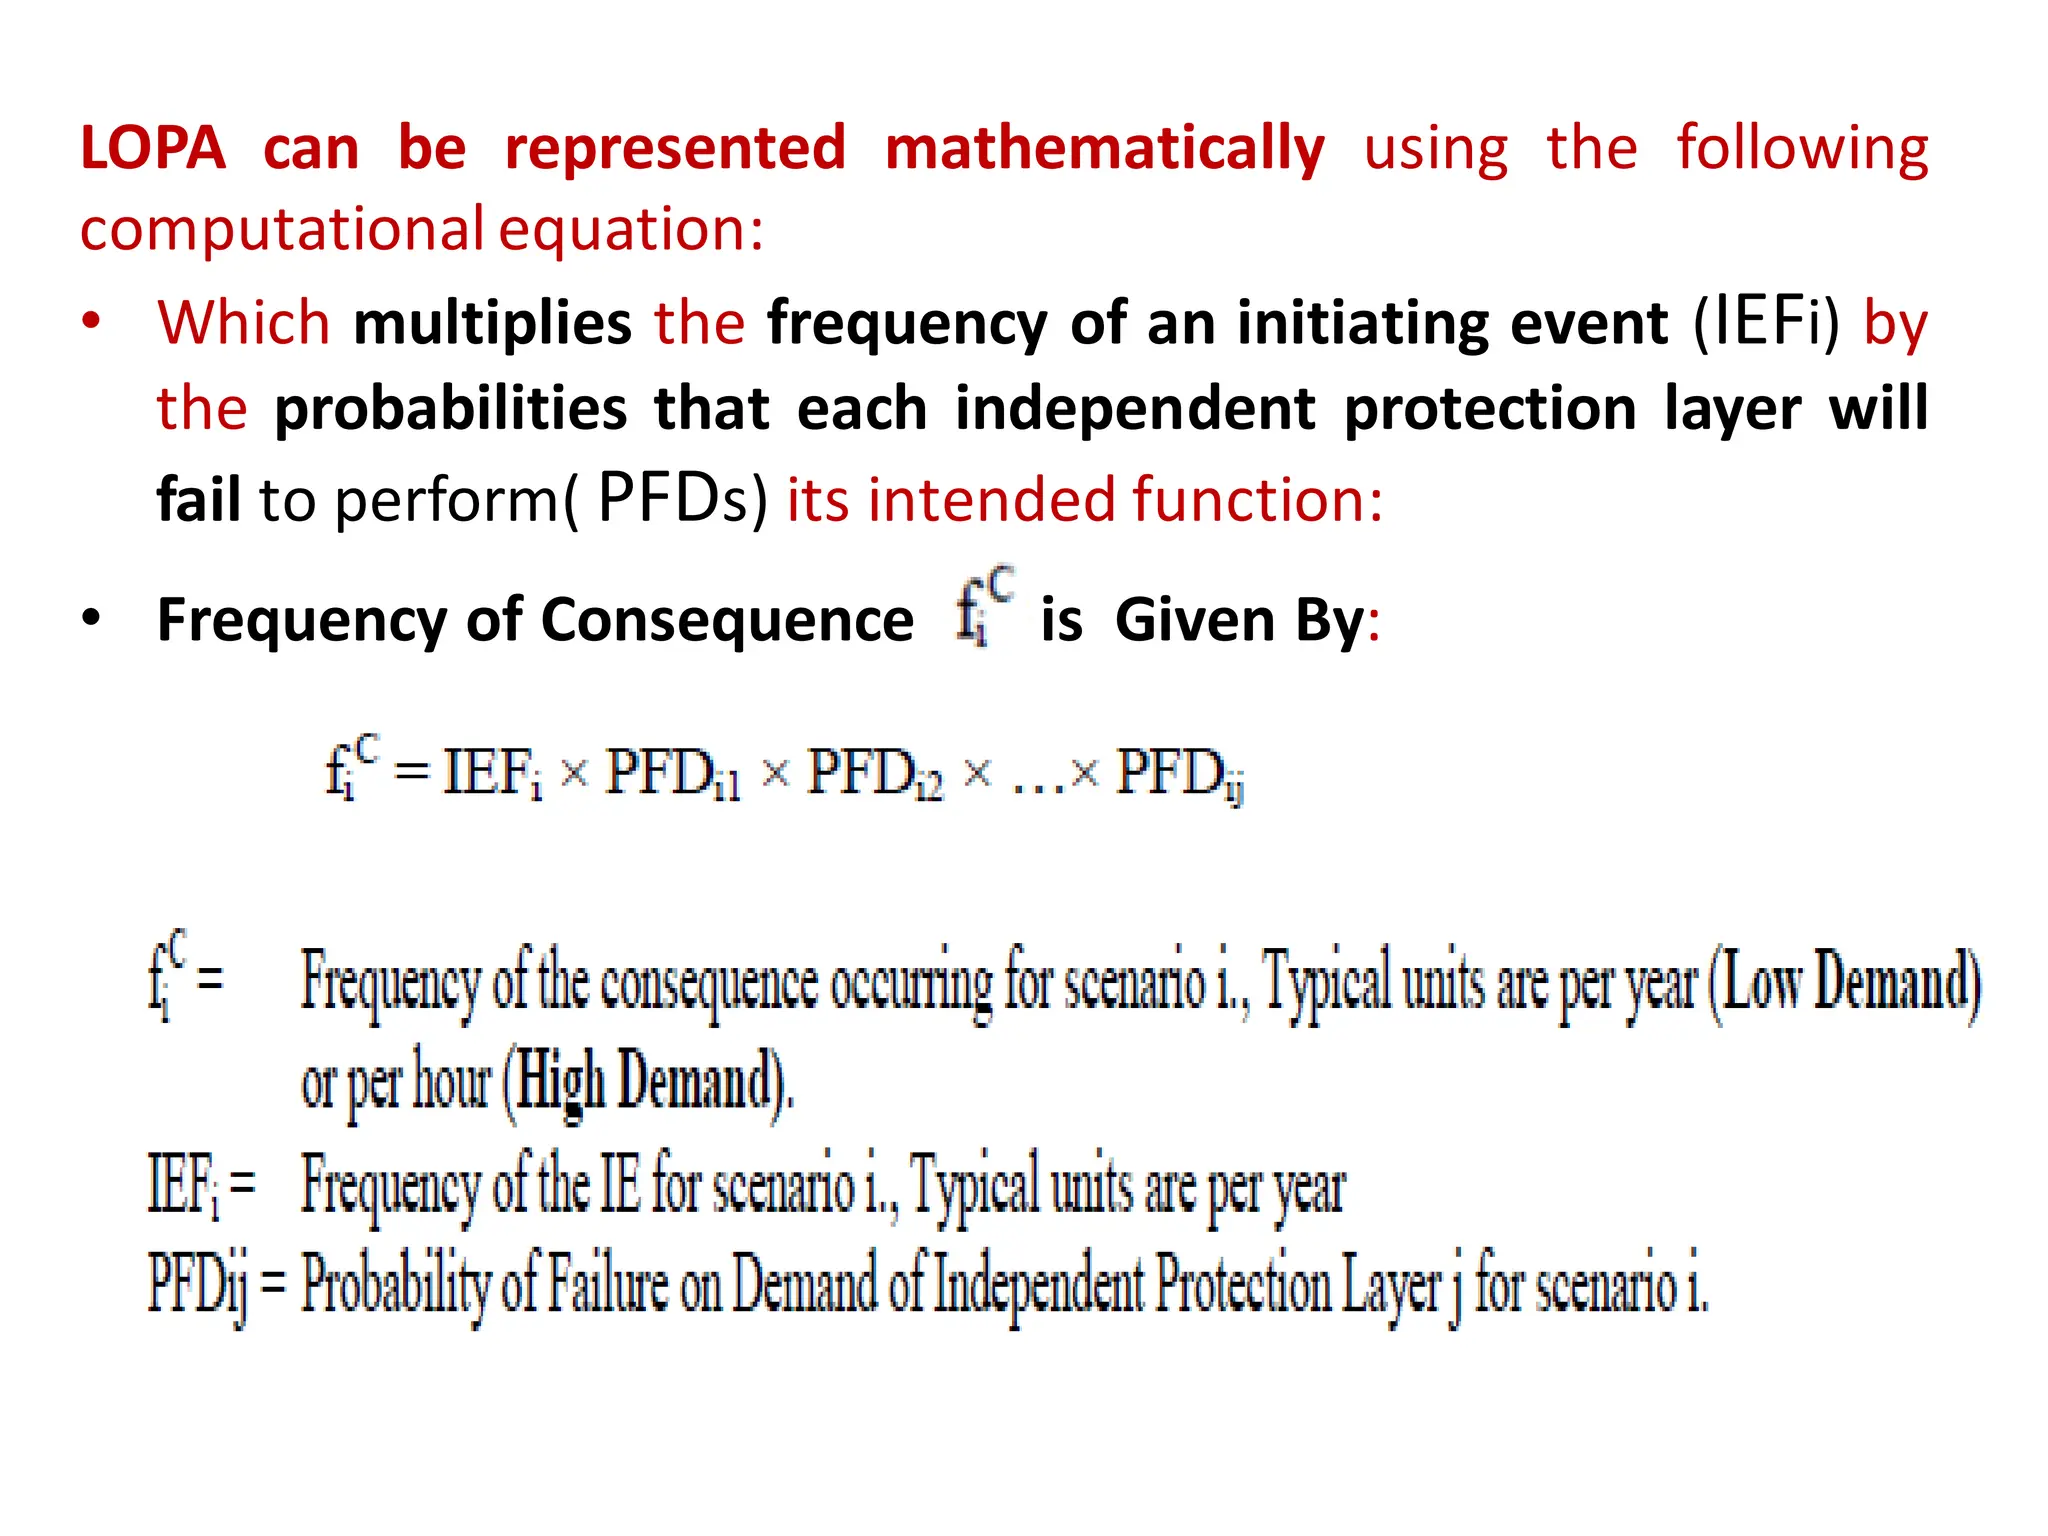
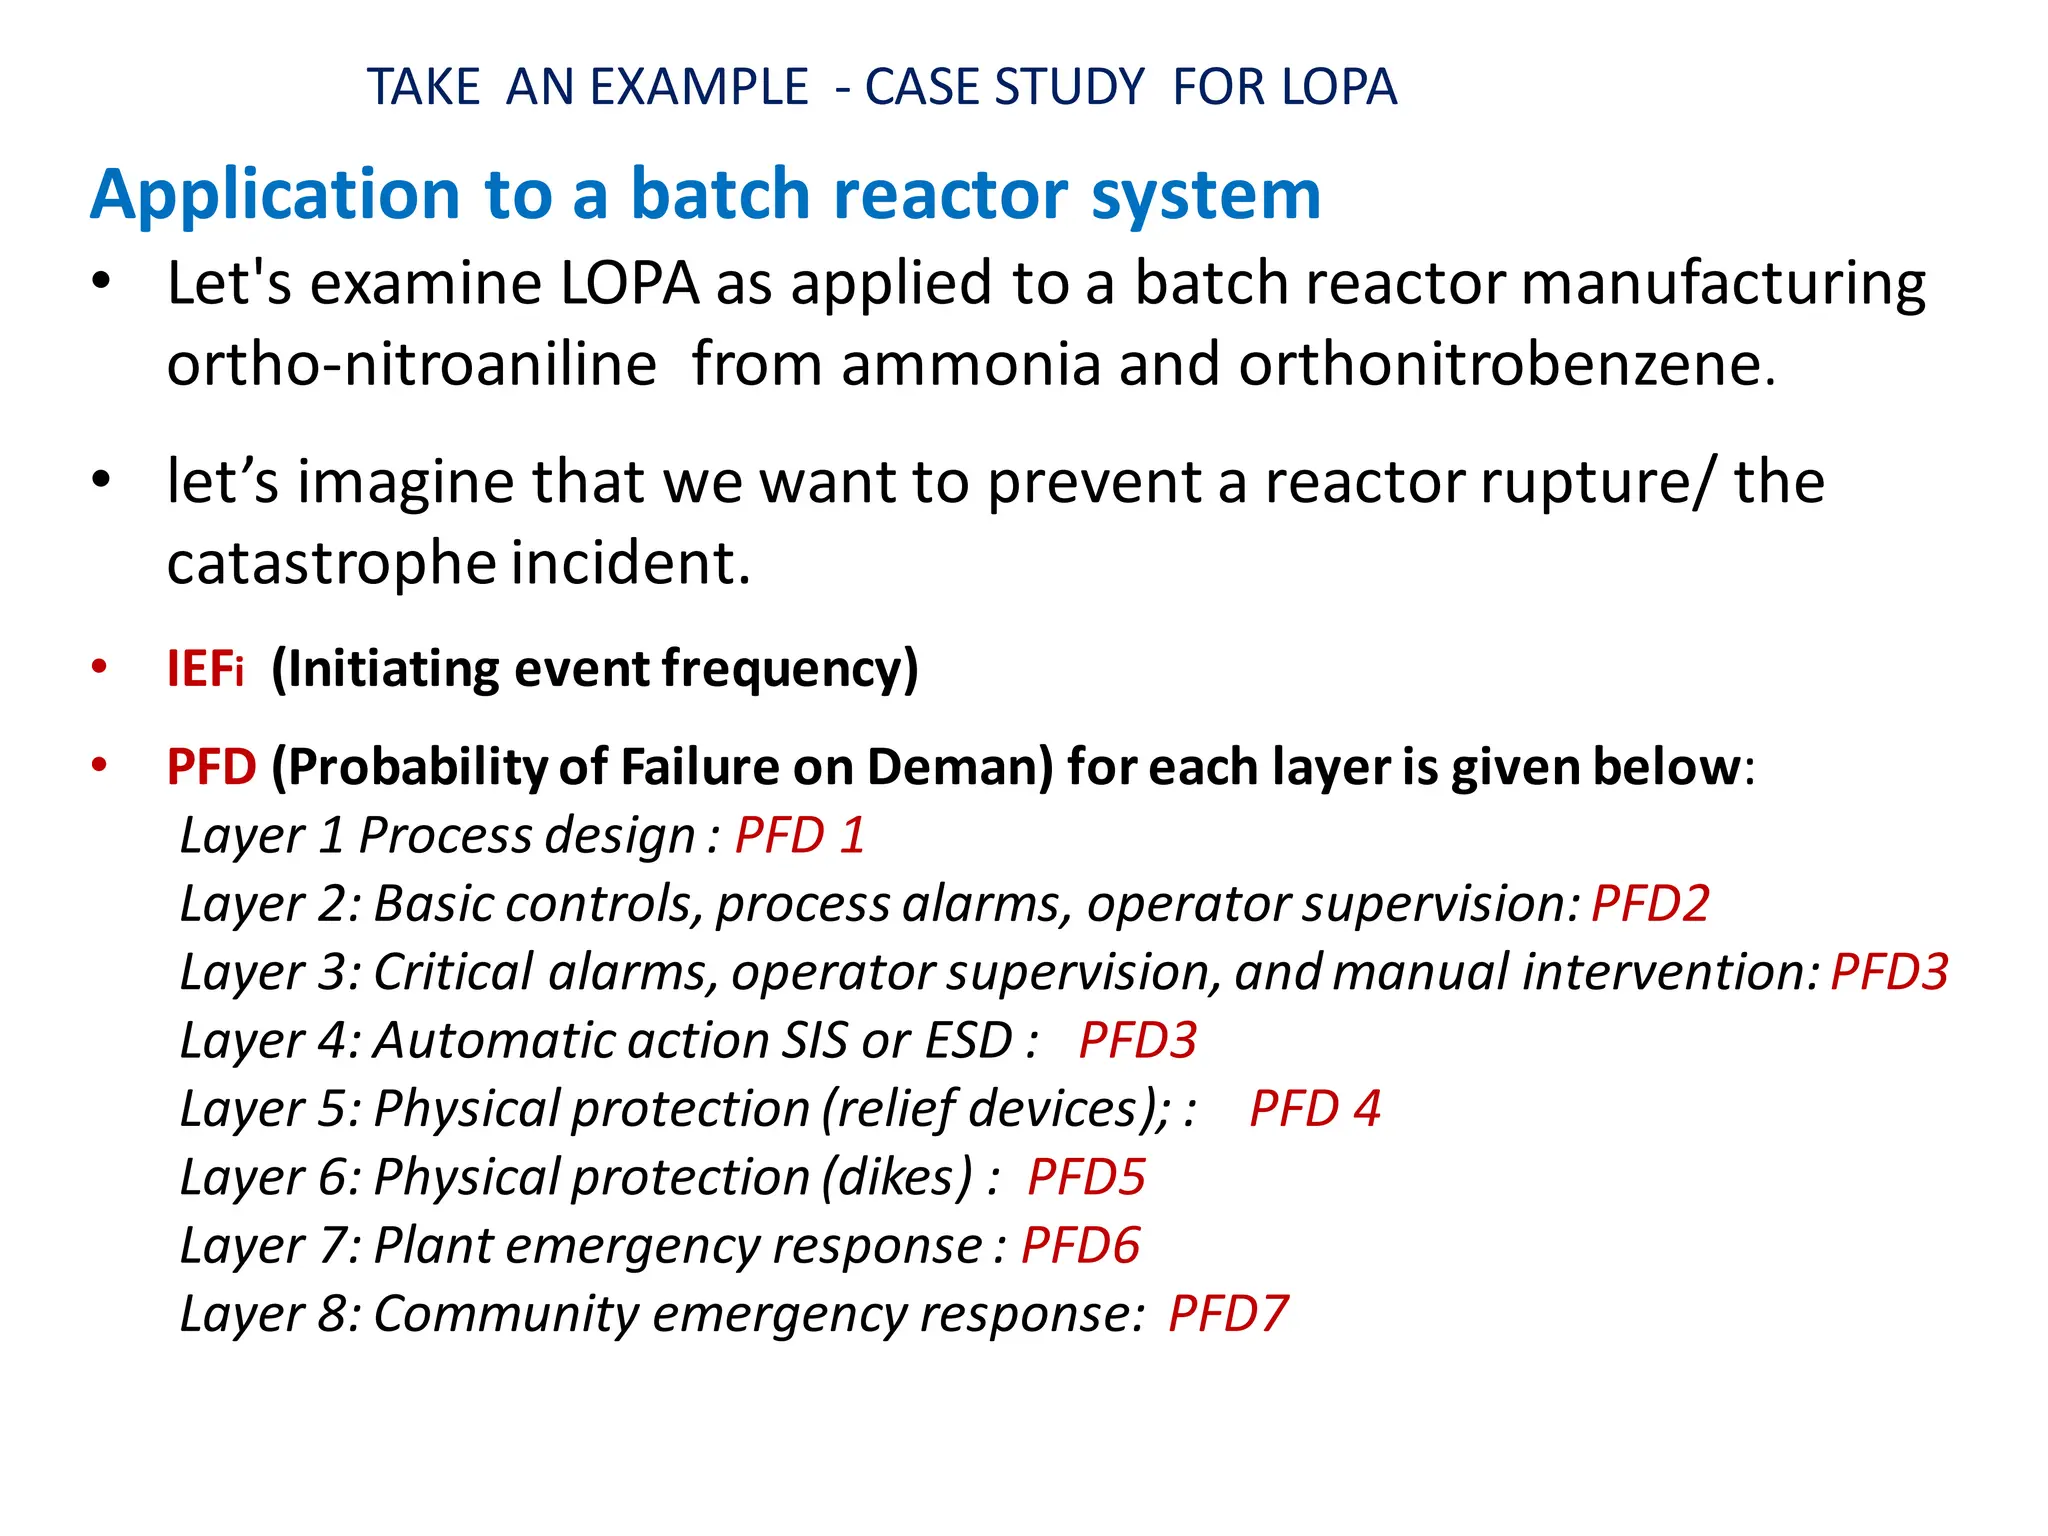
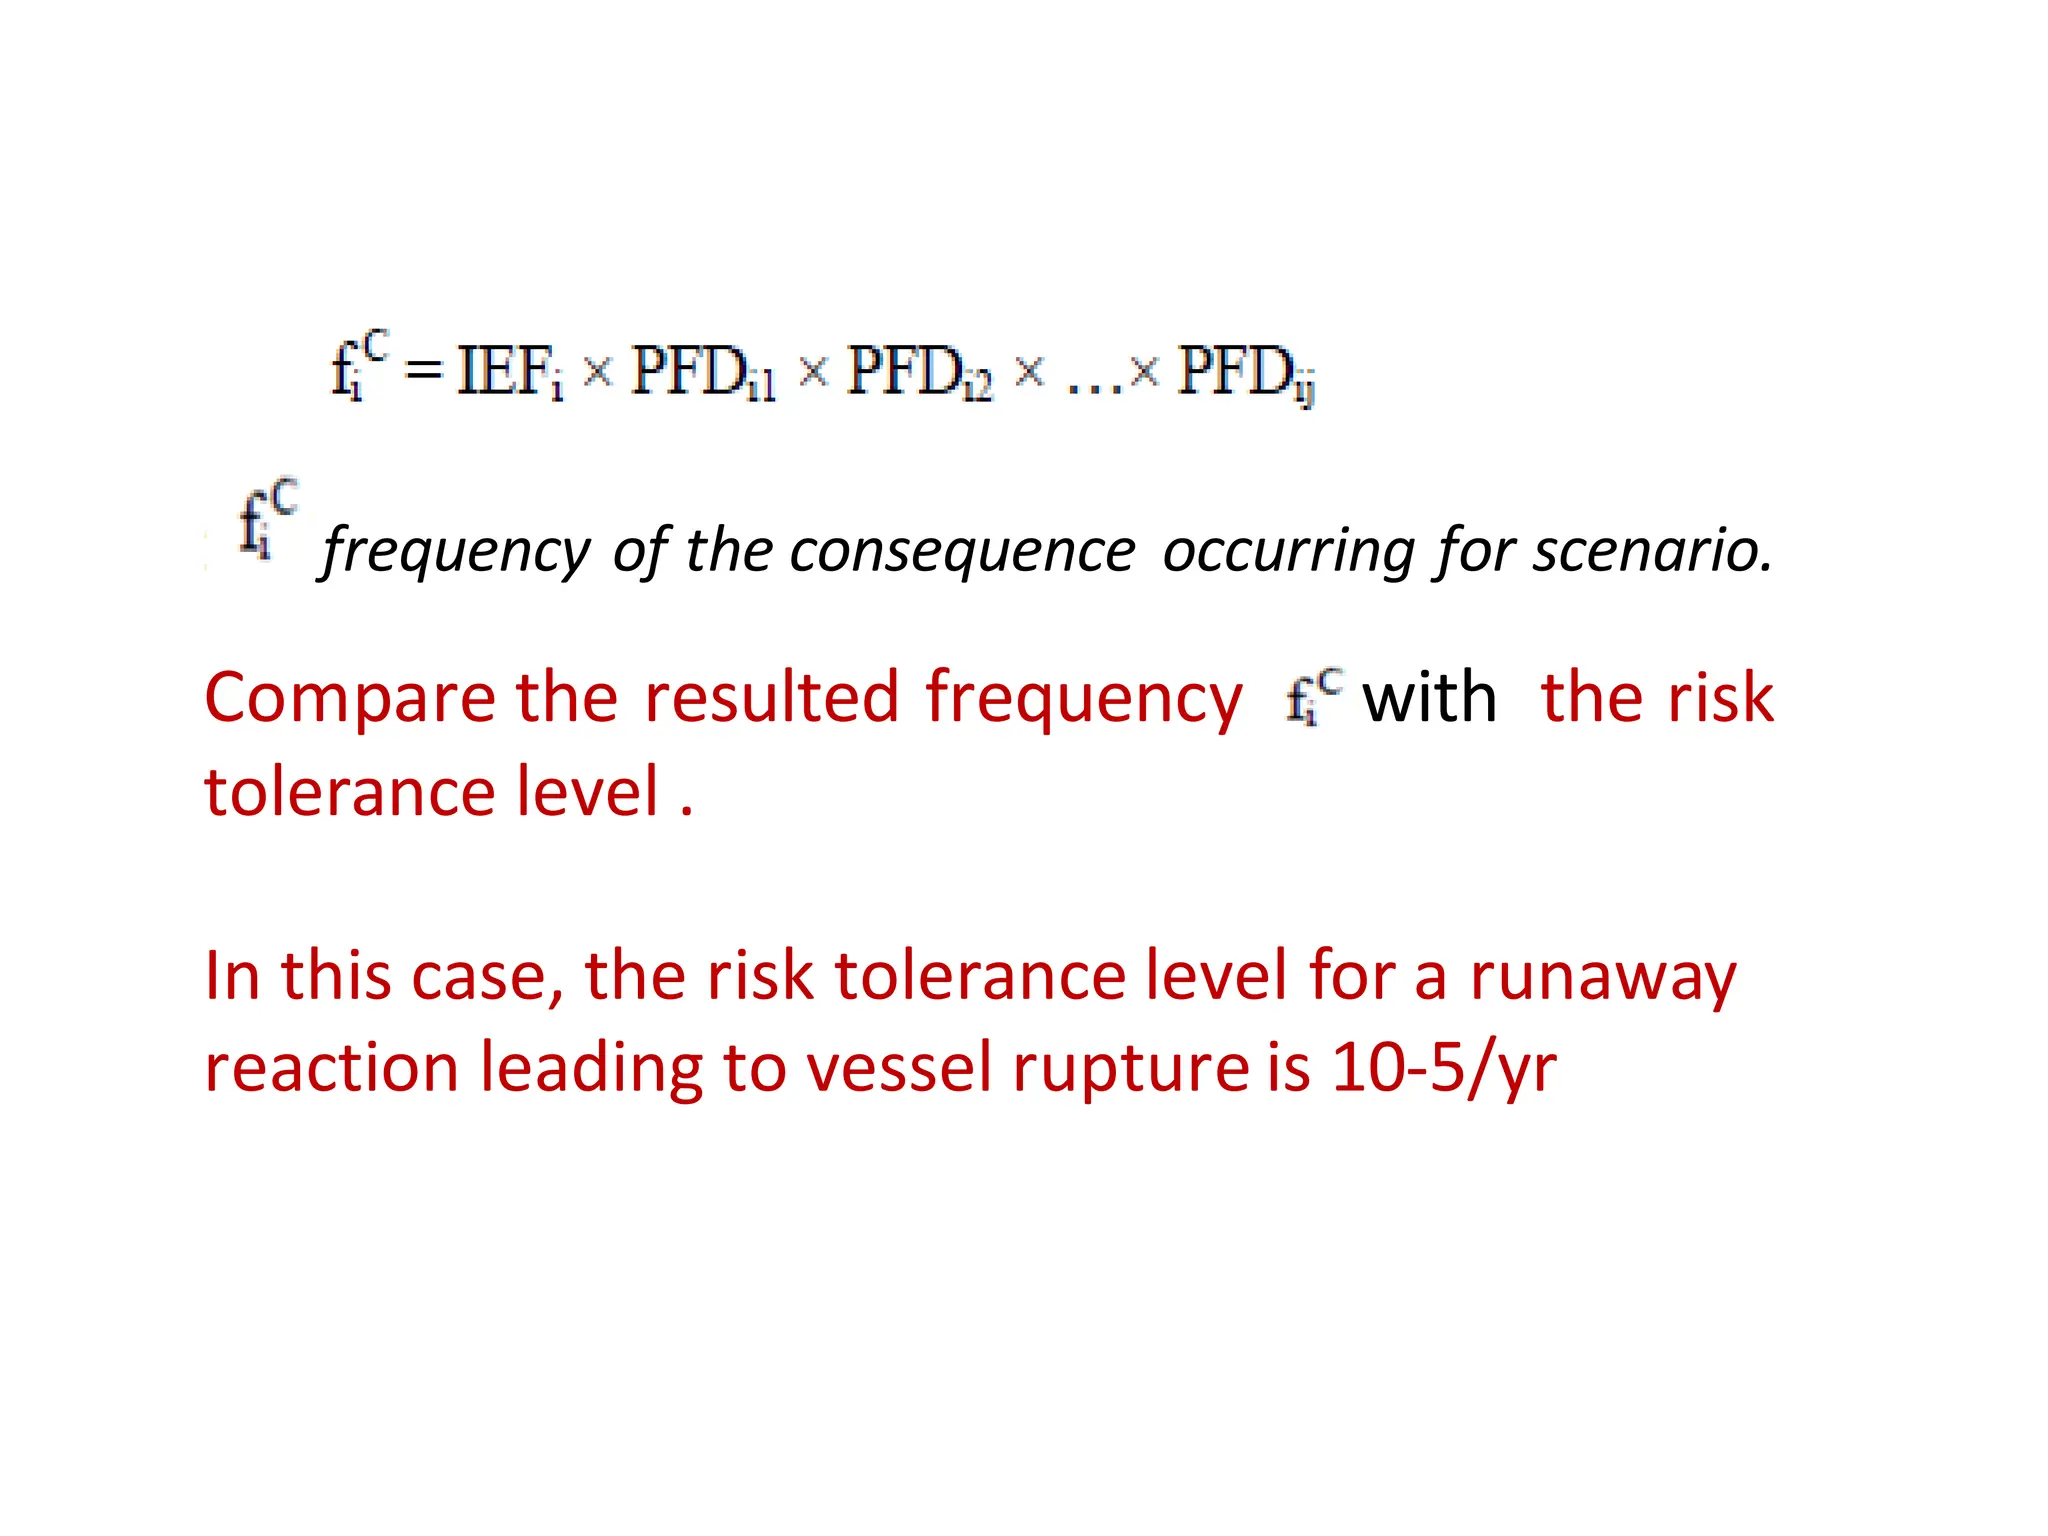
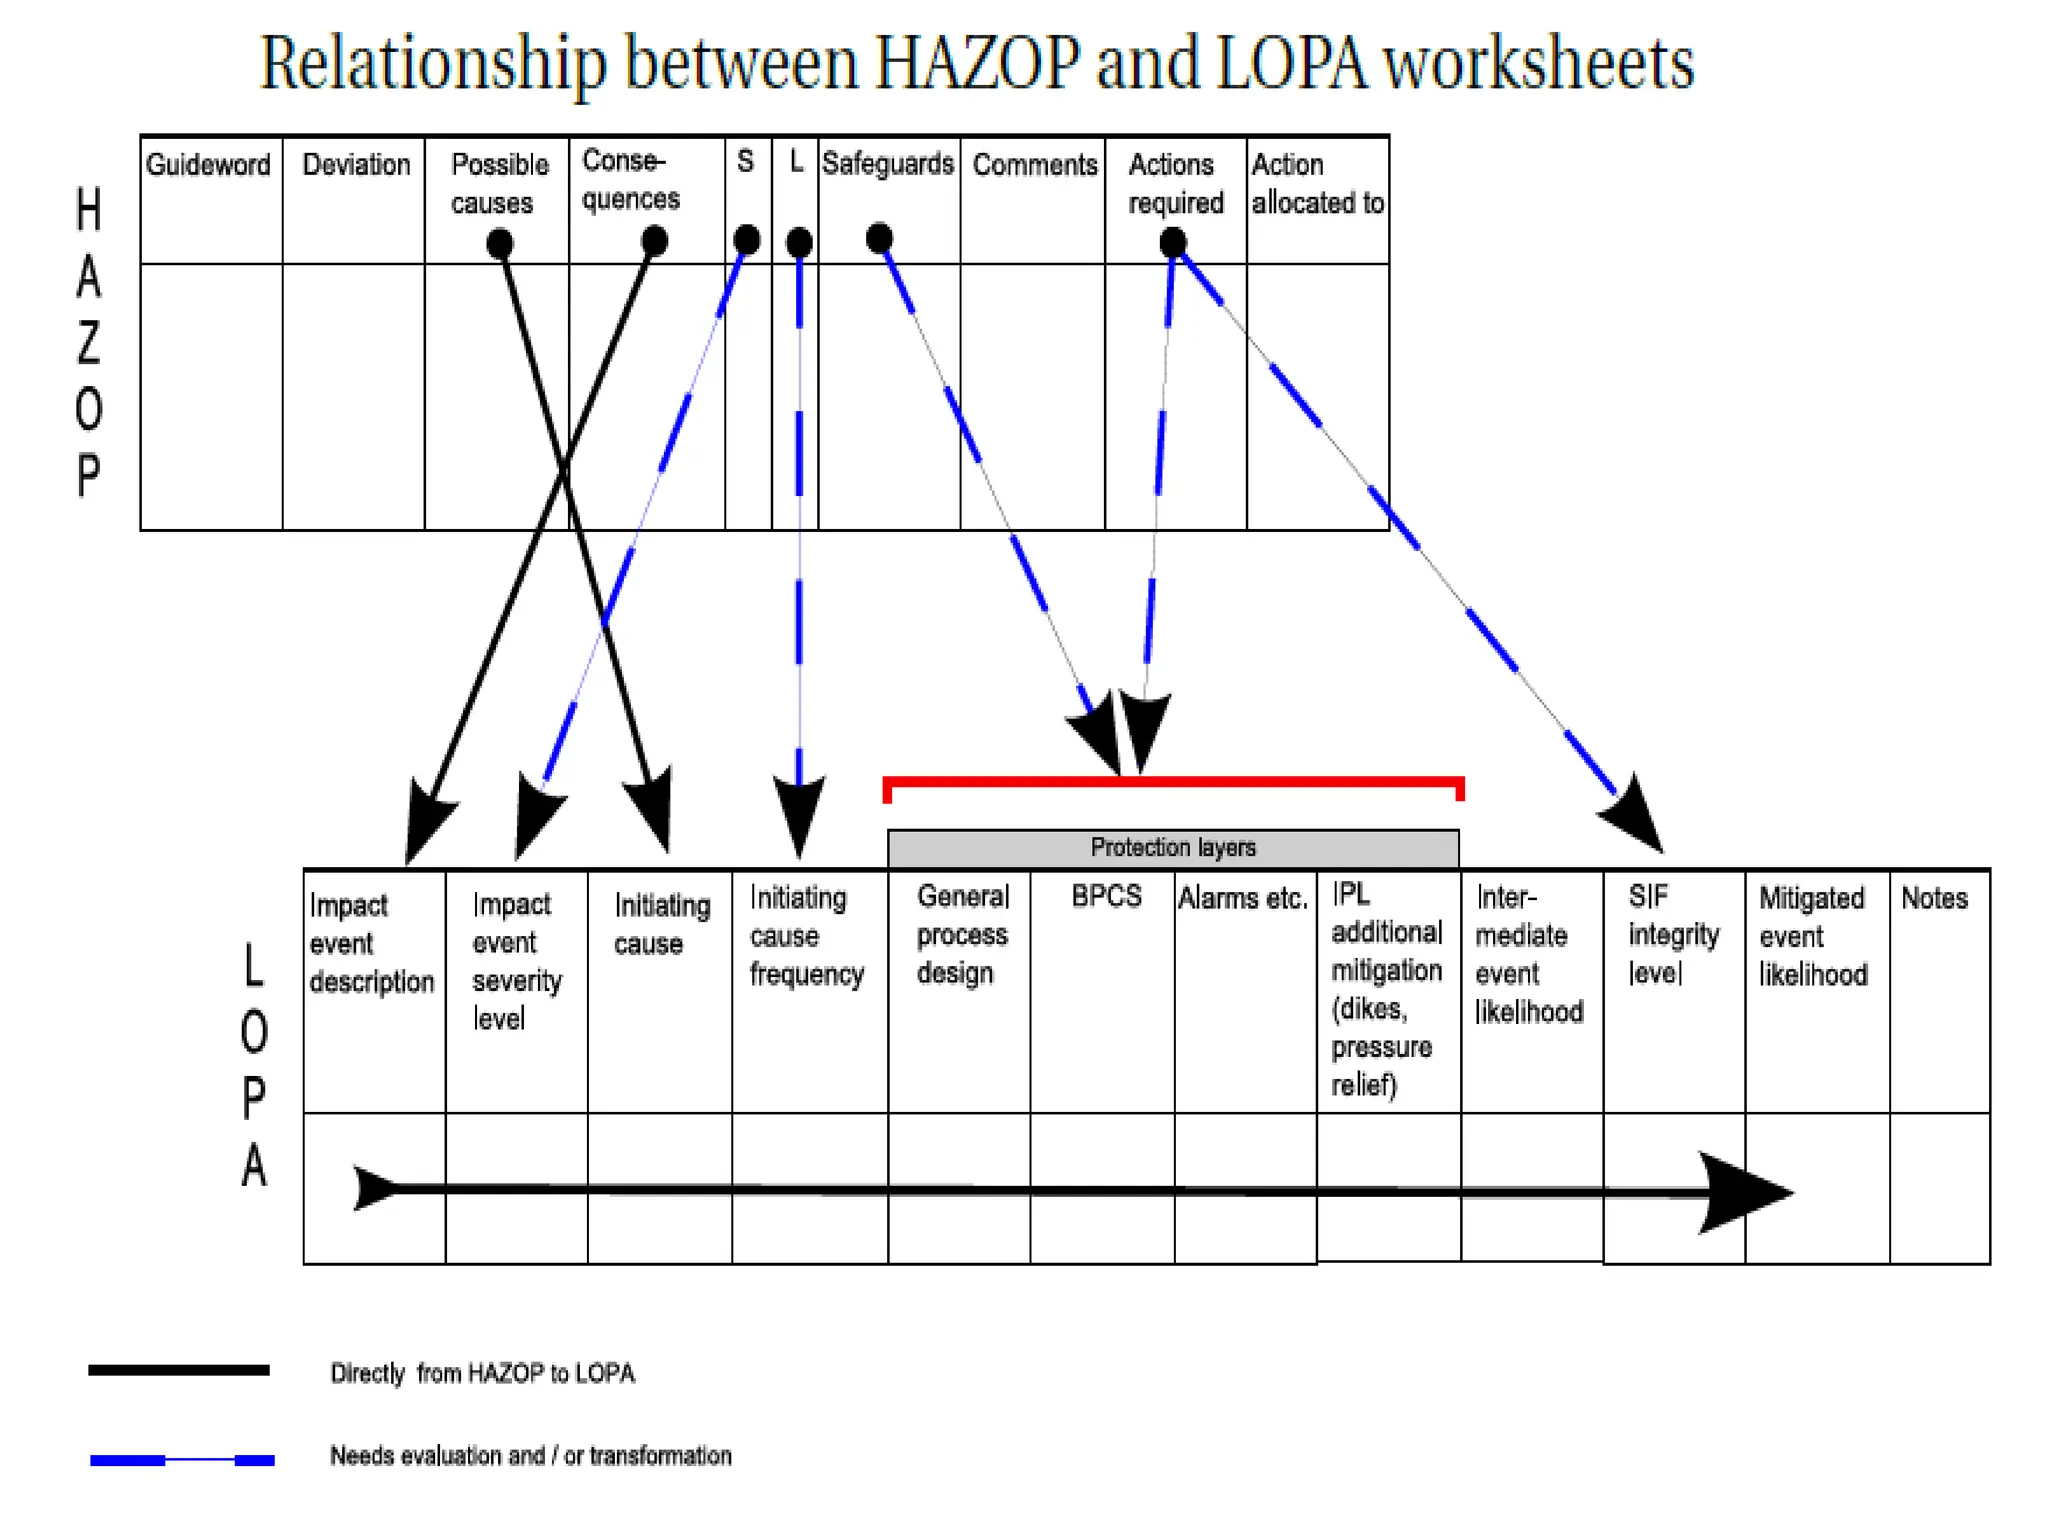
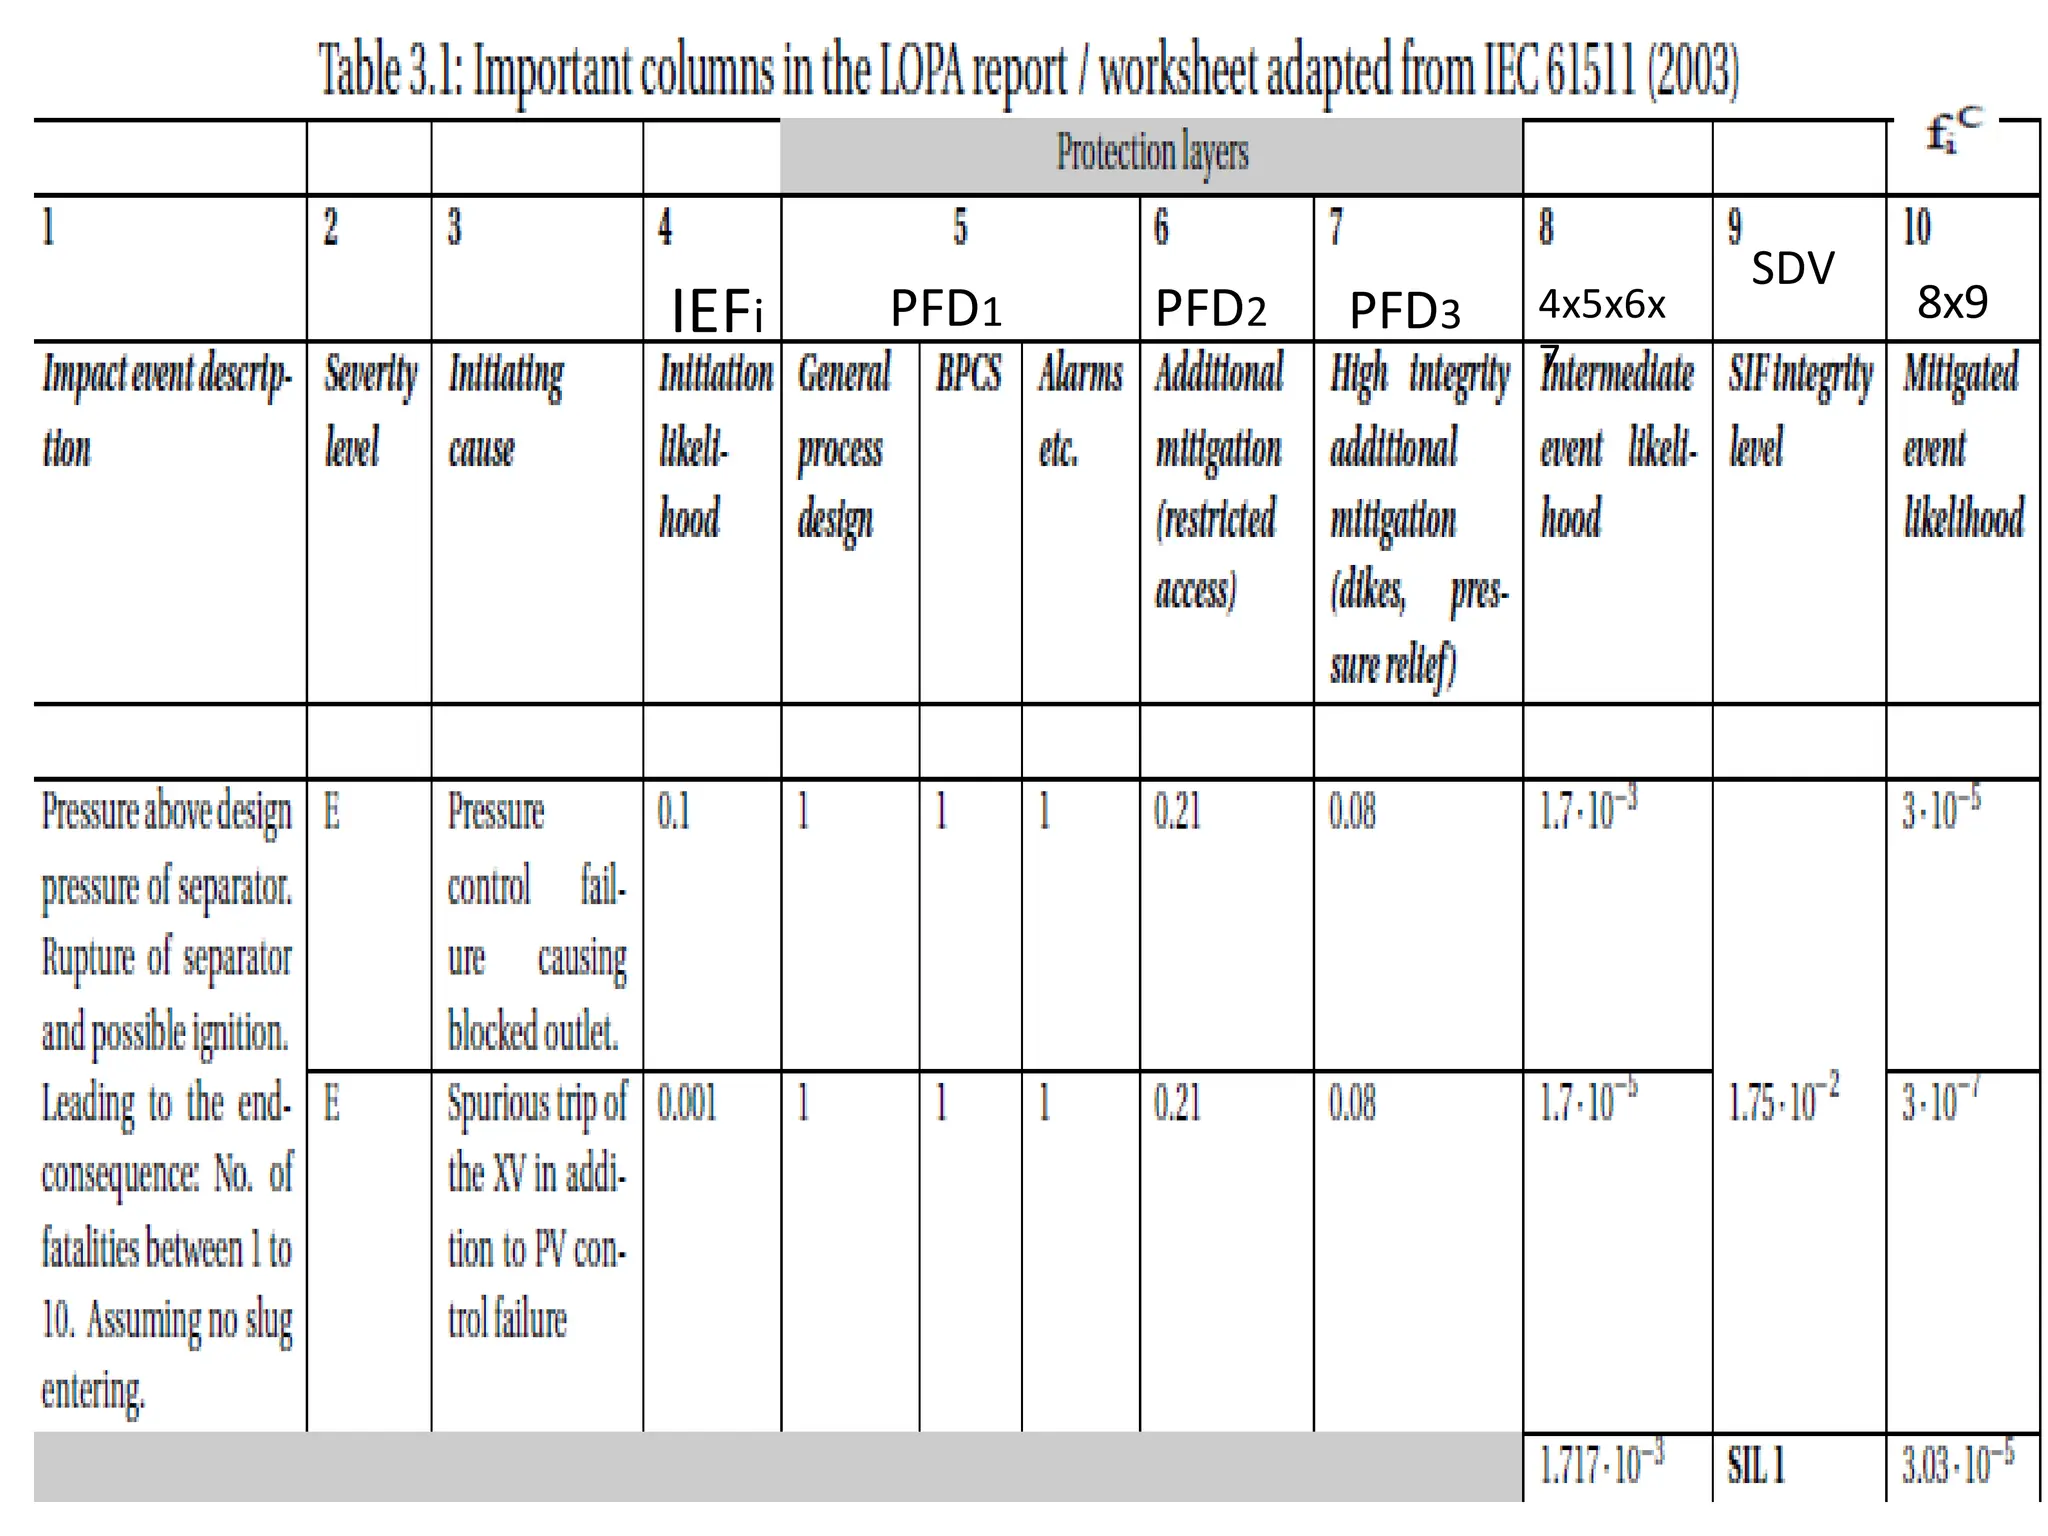
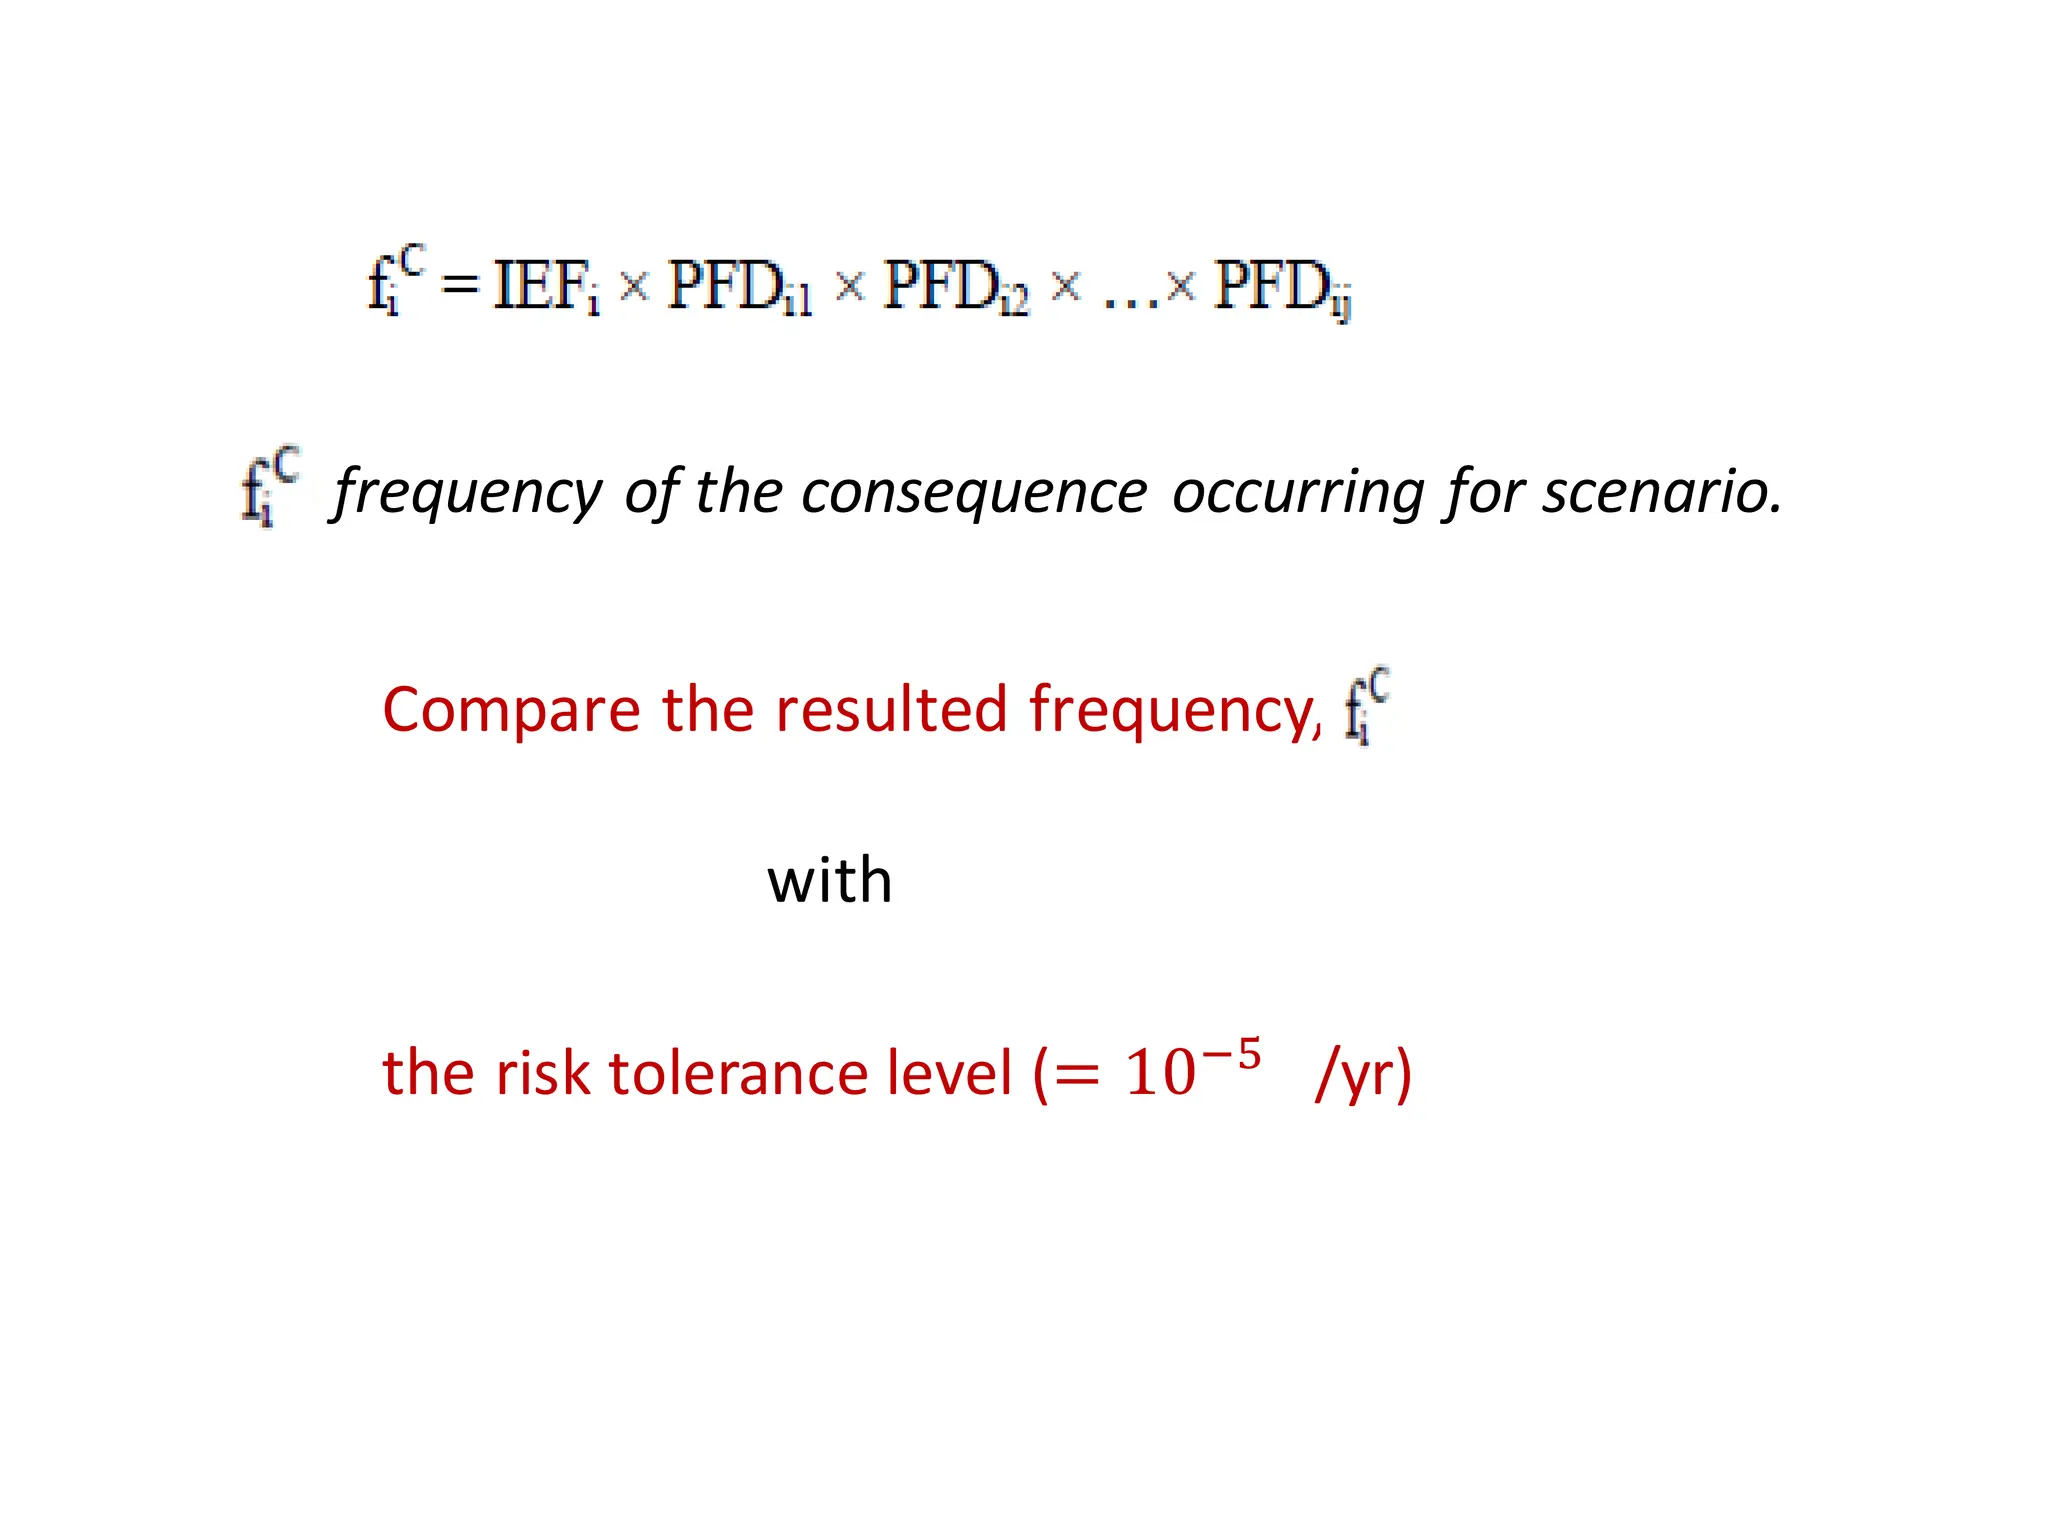
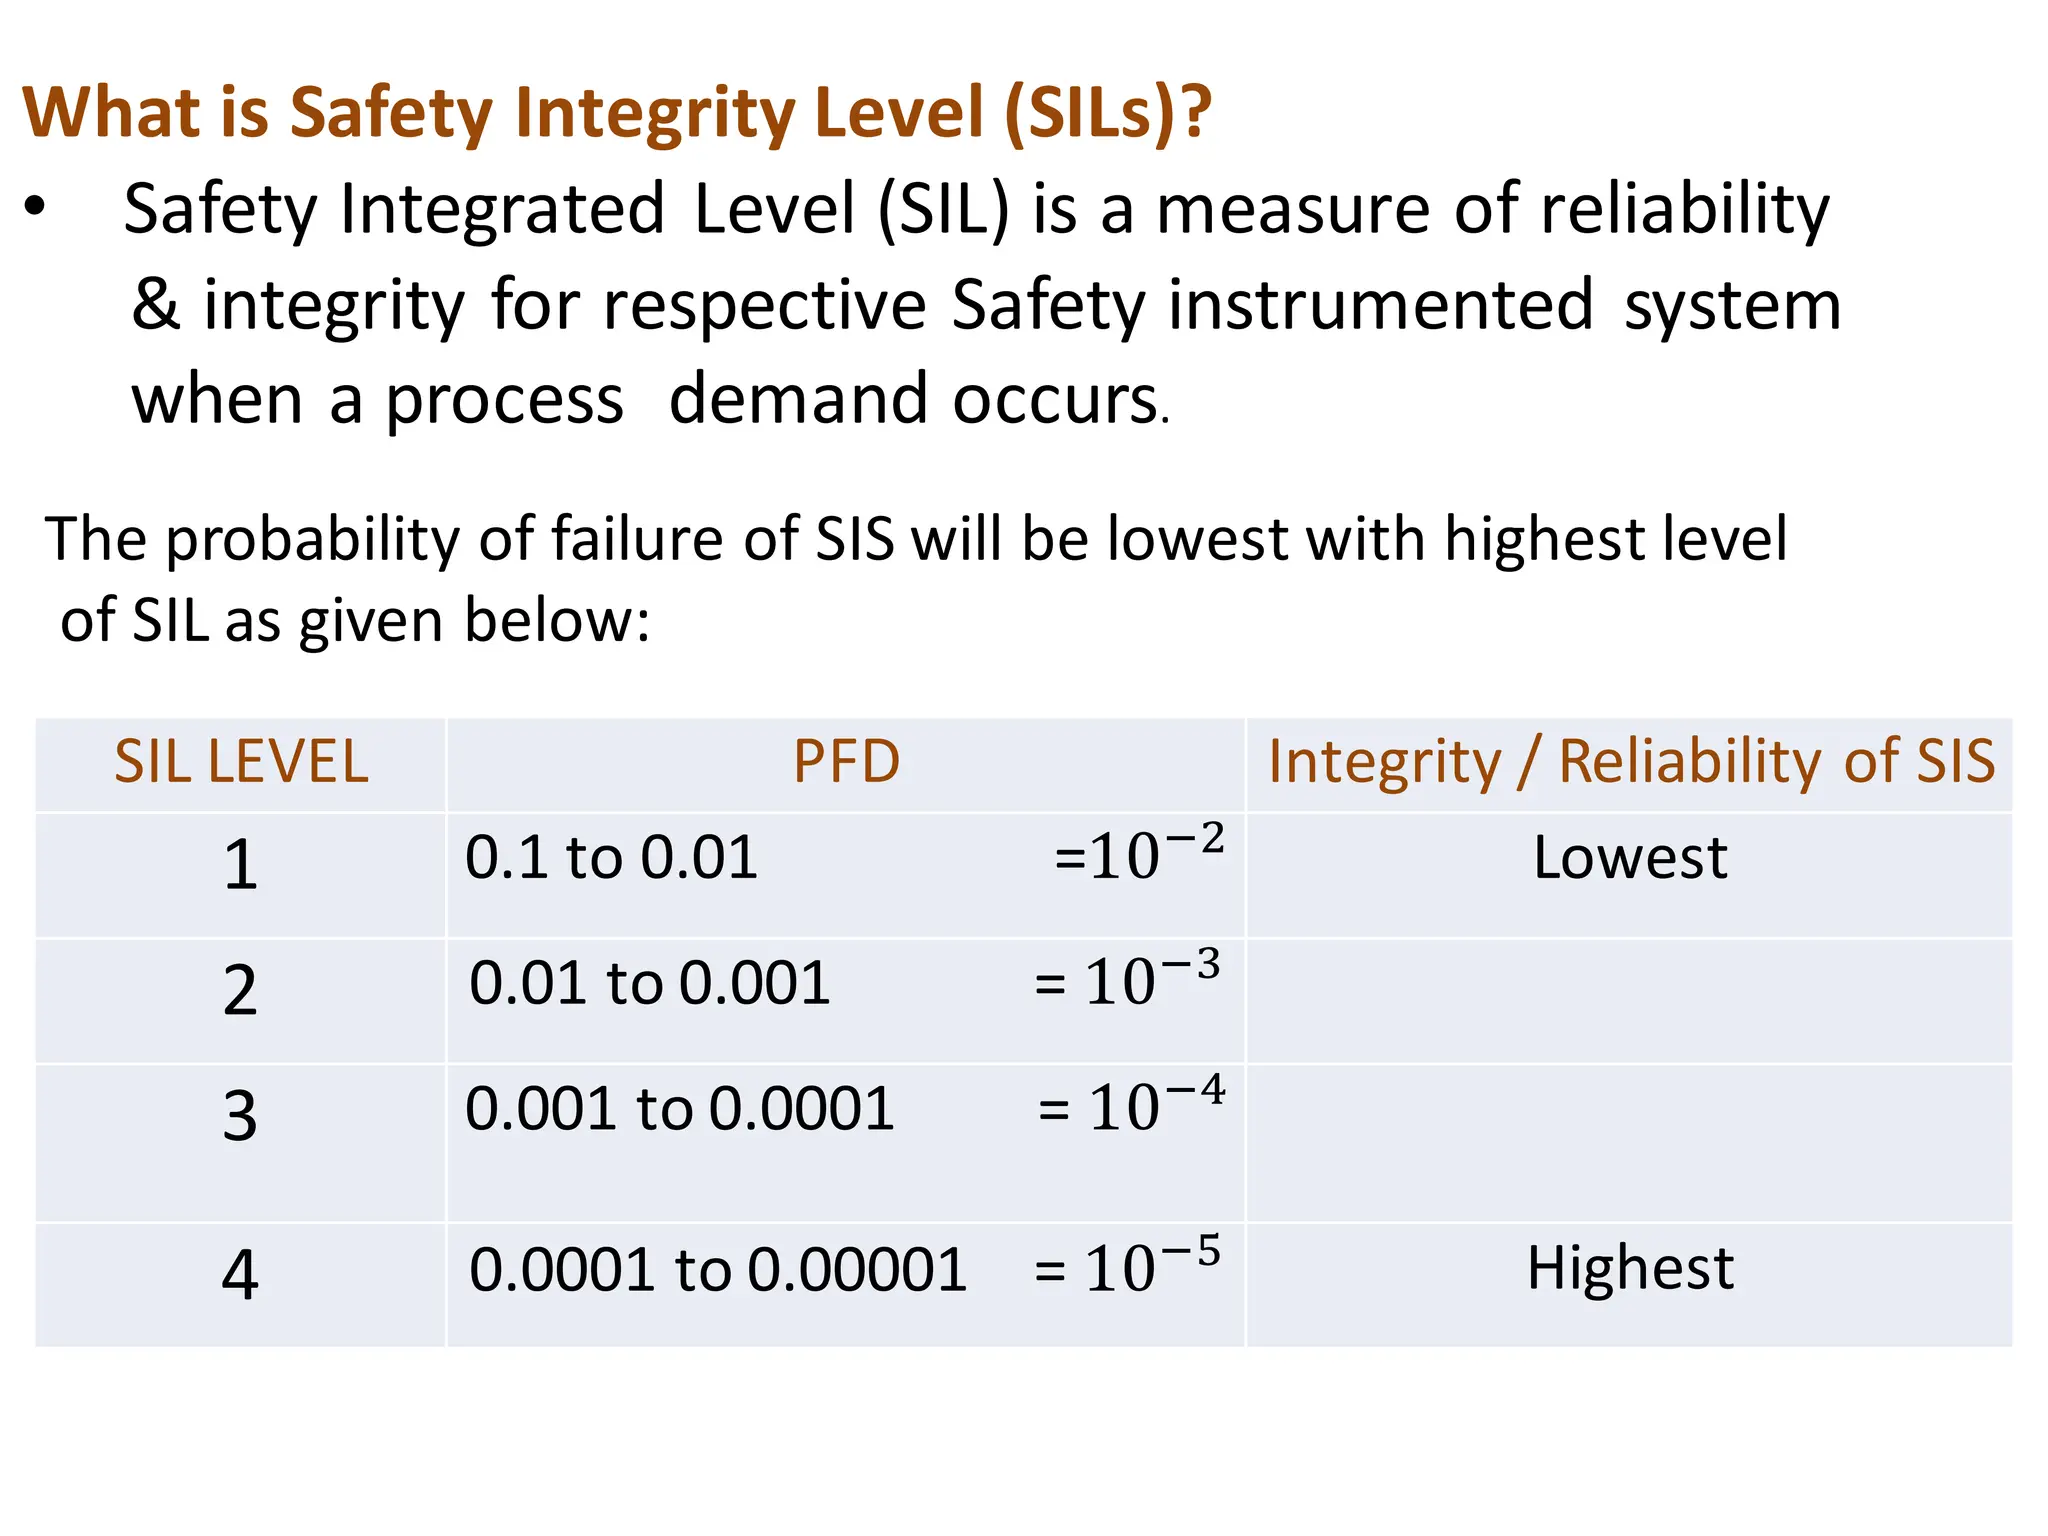

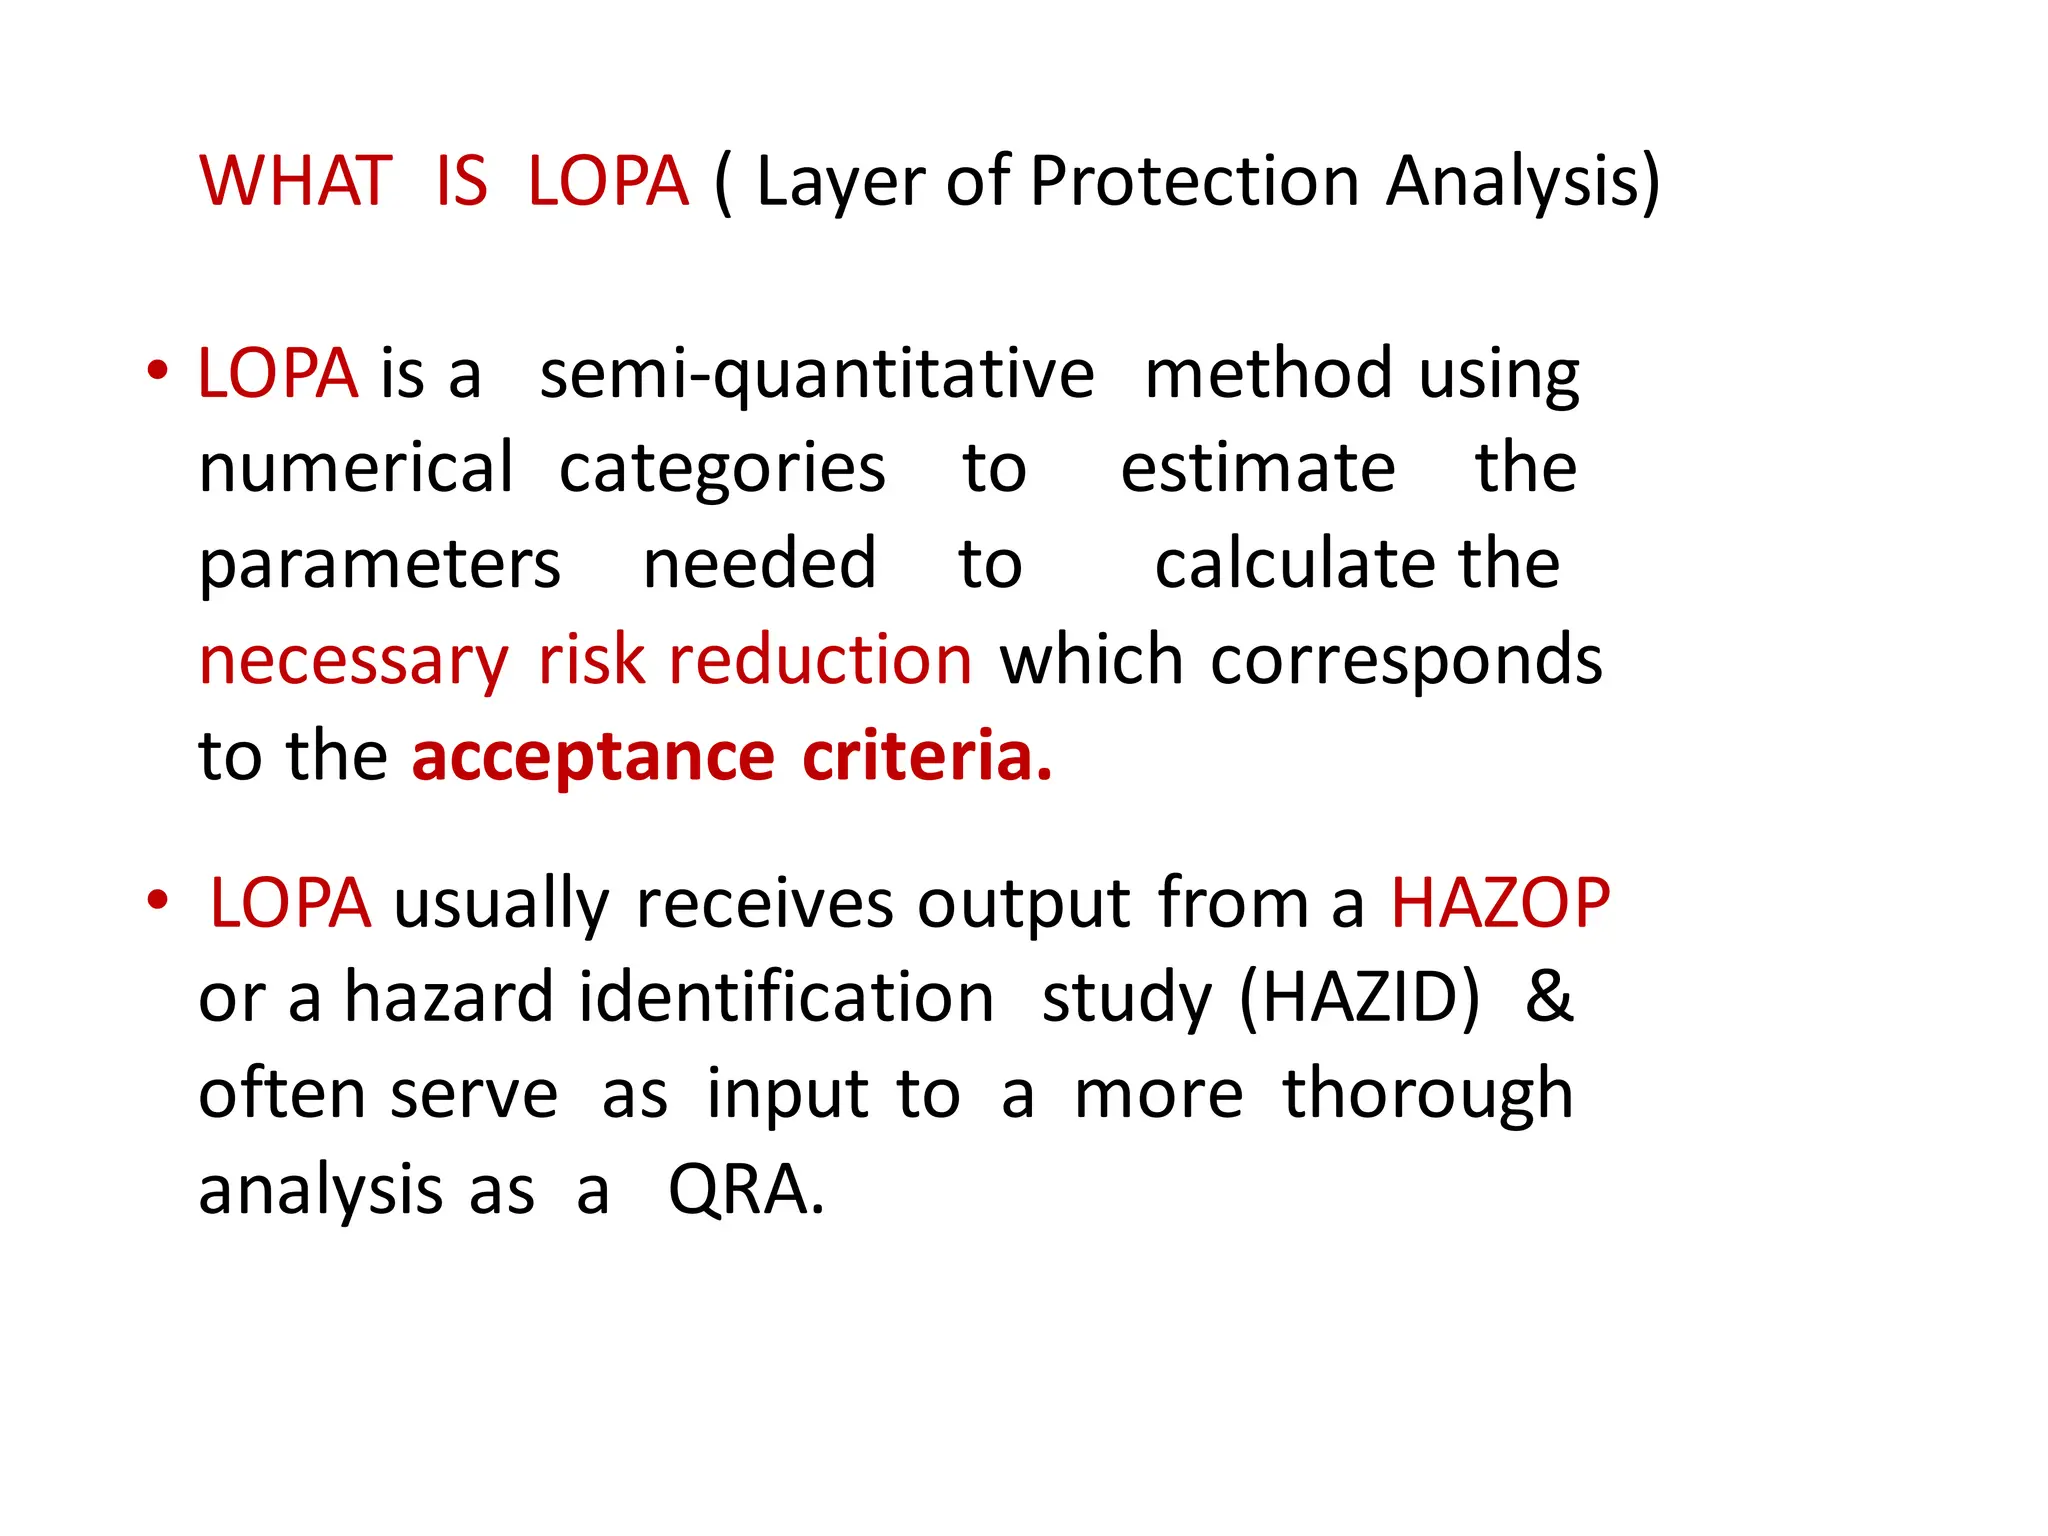
The document compares Layer of Protection Analysis (LOPA) and Hazard and Operability Study (HAZOP), highlighting LOPA as a semi-quantitative method for estimating risk reduction through independent safety layers. It details the layers of protection in a facility, each with specific probabilities of failure and illustrates the application of LOPA in a batch reactor scenario. Additionally, it defines Safety Integrity Levels (SILs), which measure the reliability of safety systems based on their probability of failure on demand.


