Download to read offline

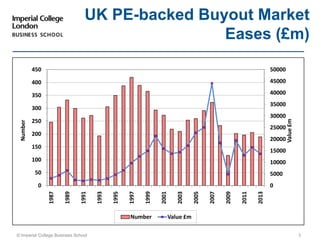
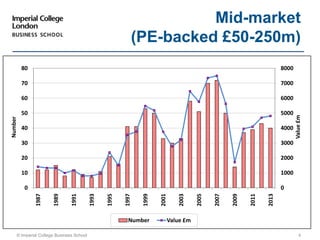
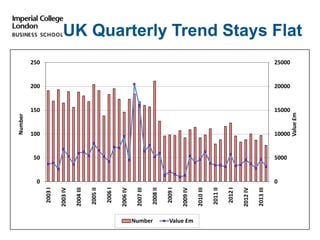
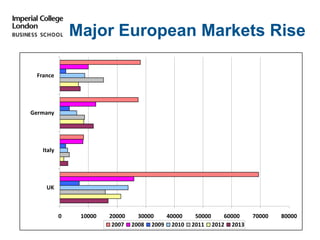
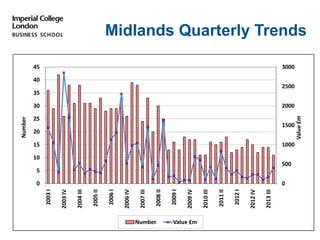
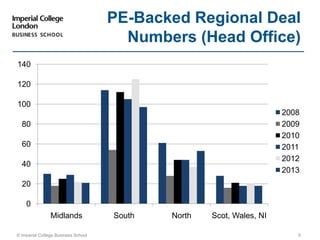
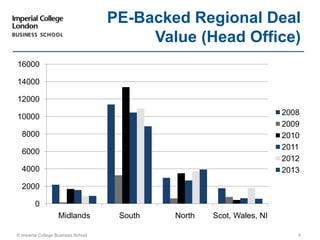
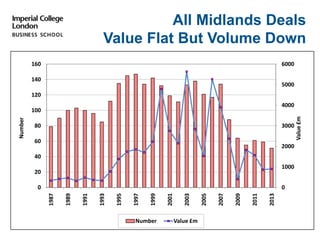

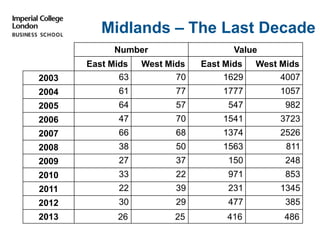
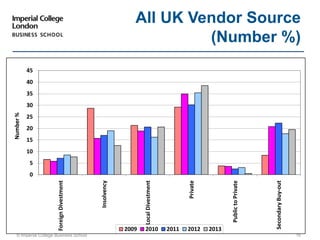
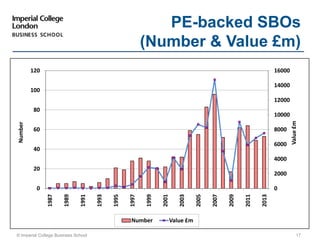
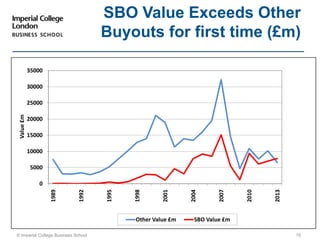
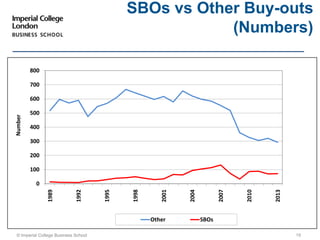
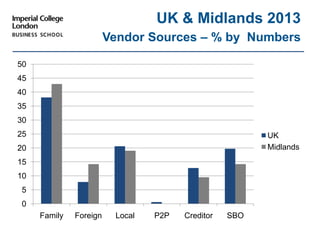
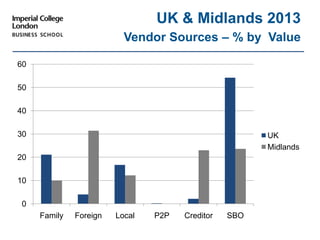

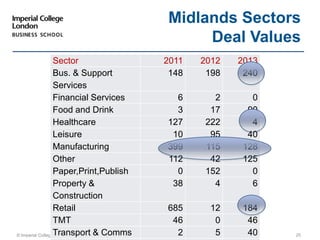
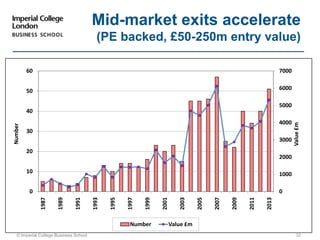
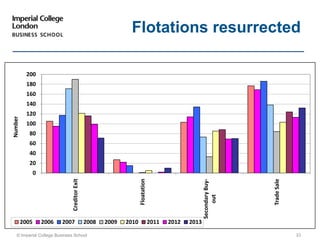
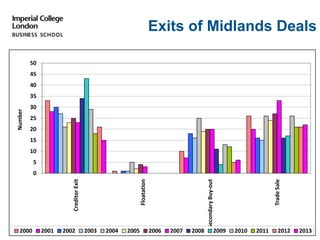
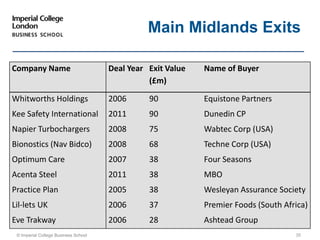

This document summarizes the latest private equity trends in the UK and Midlands region based on a presentation given in February 2014. It finds that while UK buyout deal value eased in 2013, major European markets rose. In the Midlands, deal numbers were down but values were flat. Secondary buyouts exceeded other buyouts in value for the first time. Exits are recovering with accelerating mid-market exits and resurrected flotations. Overall, private equity prospects for 2014 are positive with large pending deals, buoyant stock markets, and increased fund raising and capital availability fueling expected growth in the UK buyout market.


