Download to read offline

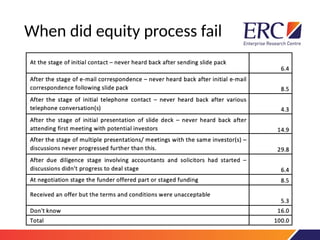
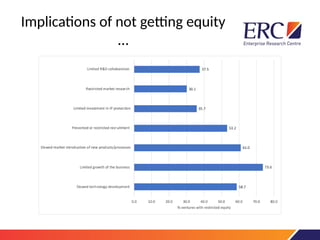

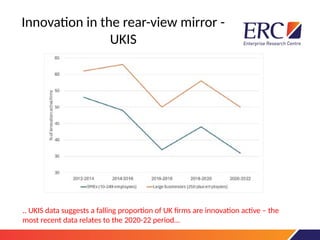
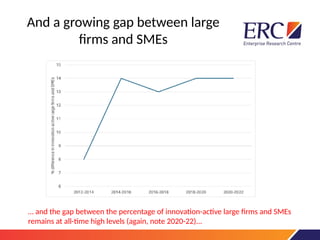
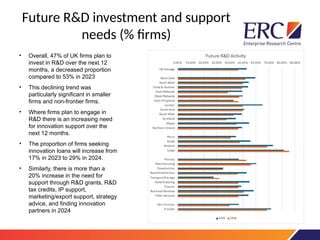
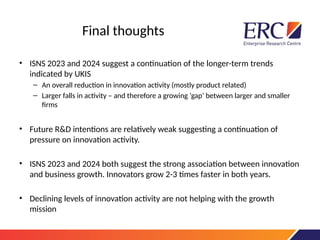
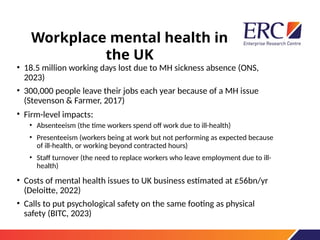
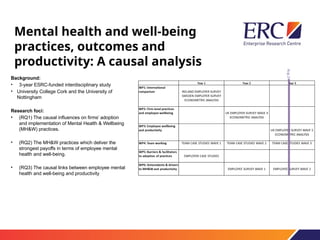

The document discusses a report focused on equity access and use in early-stage ventures, detailing the process of identifying and surveying entrepreneurs seeking equity financing, their characteristics, and the challenges they face. It highlights the high percentage of firms that do not apply for equity finance, the failures during due diligence, and the growing gap in innovation activity between large firms and SMEs, along with implications for future R&D investments. Additionally, it examines workplace mental health issues, their impact on productivity, and the necessity for mental health initiatives in organizations.


