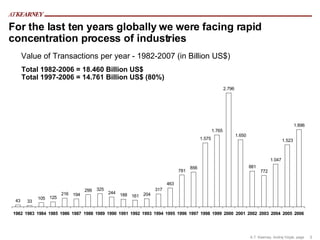
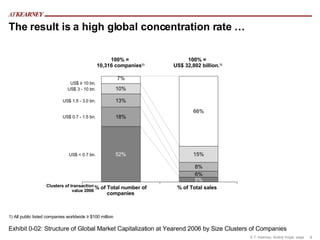
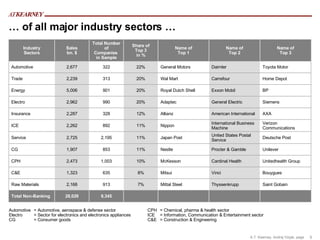
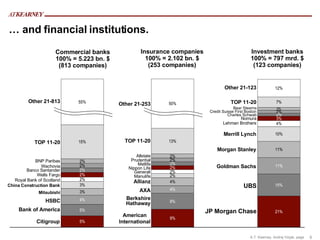
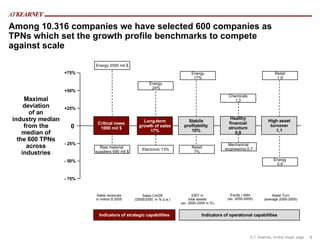
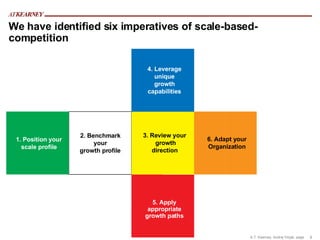
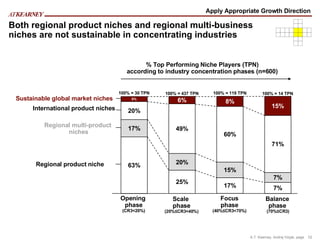
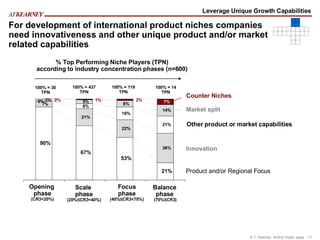
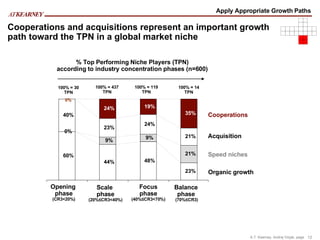
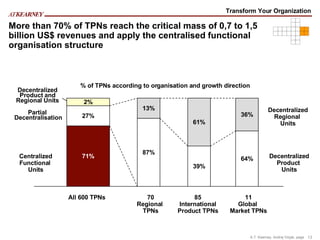
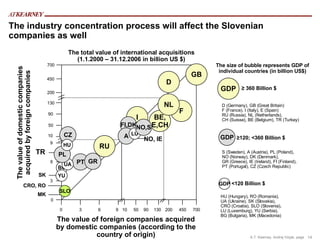
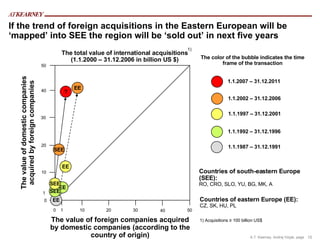
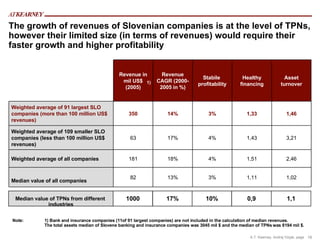
Niches – Opportunities for Europe  September 28 th , 2007 Prof. Dr. Andrej Vizjak Towards Lisbon 2.1
Competing against scale –  the outlook of Slovenian companies competing toward the global competition
For the last ten years globally we were facing rapid concentration process of industries  Value of Transactions per year - 1982-2007 (in Billion US$) Total 1982-2006 = 18.460 Billion US$ Total 1997-2006 = 14.761 Billion US$ (80%)
The result is a high global concentration rate …  Exhibit 0-02: Structure of Global Market Capitalization at Yearend 2006 by Size Clusters of Companies 1) All public listed companies worldwide ≥ $100 million Clusters of transaction value 2006 100% =  US$ 32,802 billion. 1) % of Total sales  % of Total number of companies 100% =  10,316 companies 1) US$ < 0.7 bn.  US$ 0.7 - 1.5 bn.  US$ 1.5 - 3.0 bn.  US$ 3 - 10 bn.  US$ ≥ 10 bn.
…  of all major industry sectors … Automotive = Automotive, aerospace & defense sector Electro  = Sector for electronics and electronics appliances CG = Consumer goods CPH  = Chemical, pharma & health sector ICE  = Information, Communication & Entertainment sector C&E = Construction & Engineering         9,345 28,029 Total Non-Banking Saint Gobain Thyssenkrupp Mittal Steel 7% 913 2,168 Raw Materials Bouygues Vinci Mitsui 8% 635 1,323 C&E Unitedhealth Group Cardinal Health McKesson 10% 1,003 2,473 CPH Unilever Procter & Gamble Nestle 11% 853 1,907 CG Deutsche Post United States Postal Service Japan Post 11% 2,195 2,725 Service Verizon Communications International Business Machine Nippon 11% 892 2,262 ICE AXA American International Allianz  12% 328 2,287 Insurance Siemens General Electric Adaptec 20% 990 2,962 Electro BP Exxon Mobil Royal Dutch Shell 20% 901 5,006 Energy Home Depot Carrefour Wal Mart 20% 313 2,239 Trade Toyota Motor Daimler General Motors 22% 322 2,677 Automotive Name of Top 3 Name of Top 2 Name of Top 1 Share of Top 3 in % Total Number of Companies  in Sample   Sales  bn. $   Industry  Sectors
…  and financial institutions. Investment banks 100% = 797 mrd. $ (123 companies) TOP 11-20 Other 21-123 Bear Stearns Credit Suisse First Boston Charles Schwab Nomura Merrill Lynch Lehman Brothers Goldman Sachs Morgan Stanley UBS JP Morgan Chase Commercial banks 100% = 5.223 bn. $ (813 companies) TOP 11-20 Other 21-813 BNP Paribas Wachovia Banco Santander Wells Fargo Royal Bank of Scotland China Construction Bank Mitsubishi HSBC Bank of America Citigroup Insurance companies 100% = 2.102 bn. $ (253 companies) TOP 11-20 Other 21-253 Allstate Prudential Metlife Nippon Life Generali Manulife Allianz AXA Berkshire Hathaway American International
The Endgame theory describes and predicts the concentration of all industries with 2-3 global industry leaders finally dominating more than 70% of the global market, … …  allowing only “Top Performing Niche Players (TPNs)” to compete in the residual 30%of a concentrated market. The total market share of three largest companies on the global market 0% 10% 20% 30% 40% 50% 60% 70% 80% 90% 100%    45% -10 -5 0 5 10 15 20 25 CR3 1) Years Opening Scale Focus Balance/ Alliance Paper Drugs  Natural gas liquids Semiconductors Telecom Brewers Railroad Insurance Divers. Chemicals Utilities  Automotive Supplier  Restaurants & Fast Food Steel Producer integrated Automotive Mfrs. Confectionary Truck & Trailer Mfrs. Shipbuilding Distillers Cigarette Defense Electr. Soft drinks Aluminum Producers Food Retail Airlines Integrated oil & gas Ore Mining Banks Consumer Electronics Divers. Food Rubber & Tire Mfrs.
Among 10.316 companies we have selected 600 companies as TPNs which set the growth profile benchmarks to compete against scale 0 Maximal deviation of an industry median from the median of the 600 TPNs across industries Long-term growth of sales 17% Stabile profitability 10% High asset turnover 1,1 Healthy financial structure 0,9 +75% +50% +25% - 75% - 50% - 25% Sales CAGR (2005/2000  in % p.a.) EBIT in total assets (av. 2000-2005 in %) Equity / debt (av. 2000-2005) Asset Turn (average 2000-2005) Critical mass 1000 mil $ Sales revenues in million $ 2005 Indicators of operational capabilities Indicators of strategic capabilities Energy  24% Energy 17% Retail 1,9 Chemicals 1,2 Energy 2000 mil $ Electronic 13% Retail 7% Energy 0,6 Mechanical  engineering 0,7 Raw material  suppliers 690 mil $
We have identified six imperatives of scale-based-competition 2. Benchmark  your growth profile 1. Position your scale profile 3. Review your growth direction 4. Leverage unique growth capabilities 5. Apply appropriate growth paths 6. Adapt your Organization
Both regional product niches and regional multi-business niches are not sustainable in concentrating industries % Top Performing Niche Players (TPN) according to industry concentration phases (n=600) Apply Appropriate Growth Direction 0% 20% 17% 63% Regional product niche Regional multi-product  niches International product niches Sustainable global market niches 100% = 30 TPN Opening  phase (CR3<20%) 6% 49% 20% 25% 100% = 437 TPN Scale  phase (20%≤CR3<40%) 8% 60% 15% 17% 100% = 119 TPN Focus phase (40%≤CR3<70%) 15% 71% 7% 7% 100% = 14 TPN Balance phase  (70%≤CR3)
For development of international product niches companies need innovativeness and other unique product and/or market related capabilities Market split Innovation Other product or market capabilities Counter Niches Product and/or Regional Focus 100% = 119 TPN 100% = 14 TPN 100% = 437 TPN 100% = 30 TPN 90% 67% 53% 21% 7% 21% 22% 36% 6% 16% 21% 5% 8% 14% 0% 3% 7% 0% 1% 2% % Top Performing Niche Players (TPN) according to industry concentration phases (n=600) Leverage Unique Growth Capabilities Opening  phase (CR3<20%) Scale  phase (20%≤CR3<40%) Focus phase (40%≤CR3<70%) Balance phase  (70%≤CR3)
100% = 119 TPN 100% = 14 TPN 100% = 437 TPN Organic growth 100% = 30 TPN Speed niches Acquisition Cooperations 60% 44% 48% 23% 9% 9% 21% 40% 23% 24% 21% 24% 19% 35% 0% 0% Cooperations and acquisitions represent an important growth path toward the TPN in a global market niche % Top Performing Niche Players (TPN) according to industry concentration phases (n=600) Apply Appropriate Growth Paths Opening  phase (CR3<20%) Scale  phase (20%≤CR3<40%) Focus phase (40%≤CR3<70%) Balance phase  (70%≤CR3)
More than 70% of TPNs reach the critical mass of 0,7 to 1,5 billion US$ revenues and apply the centralised functional organisation structure 71% 27% 2% 87% 13% 39% 61% All 600 TPNs 70 Regional  TPNs 64% 36% 85 International Product TPNs 11 Global  Market TPNs Decentralized Regional  Units Decentralized Product  Units Partial  Decentralisation Centralized Functional  Units Decentralized Product and Regional Units % of TPNs according to organisation and growth direction Transform Your Organization
The industry concentration process will affect the Slovenian companies as well  0 3 6 9 10 50 90 130 200 700 450 0 3 6 9 10 50 90 130 200 700 450 The value of domestic companies acquired by foreign companies The value of foreign companies acquired by domestic companies (according to the country of origin) The total value of international acquisitions (1.1.2000 – 31.12.2006 in billion US $) PT BG GR GB D UA PL F I GDP FI,DK SLO GDP GDP MK CRO, RO SK YU TR ≥  360 Billion $ ≥ 120; <360 Billion $  The size of bubble represents GDP of individual countries (in billion US$) <120 Billion $  D (Germany), GB (Great Britain) F (France), I (Italy), E (Spain) RU (Russia), NL (Netherlands), CH (Suisse), BE (Belgium), TR (Turkey) S (Sweden), A (Austria), PL (Poland), NO (Norway), DK (Denmark),  GR (Greece), IE (Ireland), FI (Finland), PT (Portugal), CZ (Czech Republic) HU (Hungary), RO (Romania), UA (Ukraine), SK (Slovakia), CRO (Croatia), SLO (Slovenia), LU (Luxemburg), YU (Serbia), BG (Bulgaria), MK (Macedonia) RU A LU CZ HU BE, E,CH NO,S NL NO, IE
If the trend of foreign acquisitions in the Eastern European will be ‘mapped’ in to  SEE the region will be ‘sold out’ in next five years  0 1 10 20 30 0 1 10 20 40 The color of the bubble indicates the time frame of the transaction Countries of south-eastern Europe (SEE): RO, CRO, SLO, YU, BG, MK, A 1.1.1987 – 31.12.1991  1.1.1992 – 31.12.1996  1.1.1997 – 31.12.2001  1.1.2002 – 31.12.2006  Countries of eastern Europe (EE): CZ, SK, HU, PL 1) 1) Acquisitions ≥ 100 billion US$ 30 40 50 50 1.1.2007 – 31.12.2011  ? SEE EE EE EE EE SEE SEE The total value of international acquisitions (1.1.2000 – 31.12.2006 in billion US $) The value of domestic companies acquired by foreign companies The value of foreign companies acquired by domestic companies (according to the country of origin)
The growth of revenues of Slovenian companies is at the level of TPNs, however their limited size (in terms of revenues) would require their faster growth and higher profitability  Note:  1) Bank and insurance companies (11of 91 largest companies) are not included in the calculation of median revenues. The total assets median of Slovene banking and insurance companies was  3045 mi l  $  and the median of TPNs was  8194 mi l  $.   1) 1,02 1,11 3% 13% 82 Median value of all companies 2,46 1,51 4% 18% 181 Weighted average of all companies 3,21 1,43 4% 17% 63 Weighted average of 109 smaller SLO companies (less than 100 million US$ revenues) 1,46 1,33 3% 14% 350 Weighted average of 91 largest SLO companies (more than 100 million US$ revenues) Asset turnover Healthy financing Stabile  profitability Revenue CAGR (2000-2005 in %) Revenue in mil US$ (2005)   Median value of TPNs from different  industries 1000 17% 10% 0,9 1,1

Niches - Opportunity for Europe

  • 1.
    Niches – Opportunitiesfor Europe September 28 th , 2007 Prof. Dr. Andrej Vizjak Towards Lisbon 2.1
  • 2.
    Competing against scale– the outlook of Slovenian companies competing toward the global competition
  • 3.
    For the lastten years globally we were facing rapid concentration process of industries Value of Transactions per year - 1982-2007 (in Billion US$) Total 1982-2006 = 18.460 Billion US$ Total 1997-2006 = 14.761 Billion US$ (80%)
  • 4.
    The result isa high global concentration rate … Exhibit 0-02: Structure of Global Market Capitalization at Yearend 2006 by Size Clusters of Companies 1) All public listed companies worldwide ≥ $100 million Clusters of transaction value 2006 100% = US$ 32,802 billion. 1) % of Total sales % of Total number of companies 100% = 10,316 companies 1) US$ < 0.7 bn. US$ 0.7 - 1.5 bn. US$ 1.5 - 3.0 bn. US$ 3 - 10 bn. US$ ≥ 10 bn.
  • 5.
    … ofall major industry sectors … Automotive = Automotive, aerospace & defense sector Electro = Sector for electronics and electronics appliances CG = Consumer goods CPH = Chemical, pharma & health sector ICE = Information, Communication & Entertainment sector C&E = Construction & Engineering         9,345 28,029 Total Non-Banking Saint Gobain Thyssenkrupp Mittal Steel 7% 913 2,168 Raw Materials Bouygues Vinci Mitsui 8% 635 1,323 C&E Unitedhealth Group Cardinal Health McKesson 10% 1,003 2,473 CPH Unilever Procter & Gamble Nestle 11% 853 1,907 CG Deutsche Post United States Postal Service Japan Post 11% 2,195 2,725 Service Verizon Communications International Business Machine Nippon 11% 892 2,262 ICE AXA American International Allianz 12% 328 2,287 Insurance Siemens General Electric Adaptec 20% 990 2,962 Electro BP Exxon Mobil Royal Dutch Shell 20% 901 5,006 Energy Home Depot Carrefour Wal Mart 20% 313 2,239 Trade Toyota Motor Daimler General Motors 22% 322 2,677 Automotive Name of Top 3 Name of Top 2 Name of Top 1 Share of Top 3 in % Total Number of Companies in Sample   Sales bn. $   Industry Sectors
  • 6.
    … andfinancial institutions. Investment banks 100% = 797 mrd. $ (123 companies) TOP 11-20 Other 21-123 Bear Stearns Credit Suisse First Boston Charles Schwab Nomura Merrill Lynch Lehman Brothers Goldman Sachs Morgan Stanley UBS JP Morgan Chase Commercial banks 100% = 5.223 bn. $ (813 companies) TOP 11-20 Other 21-813 BNP Paribas Wachovia Banco Santander Wells Fargo Royal Bank of Scotland China Construction Bank Mitsubishi HSBC Bank of America Citigroup Insurance companies 100% = 2.102 bn. $ (253 companies) TOP 11-20 Other 21-253 Allstate Prudential Metlife Nippon Life Generali Manulife Allianz AXA Berkshire Hathaway American International
  • 7.
    The Endgame theorydescribes and predicts the concentration of all industries with 2-3 global industry leaders finally dominating more than 70% of the global market, … … allowing only “Top Performing Niche Players (TPNs)” to compete in the residual 30%of a concentrated market. The total market share of three largest companies on the global market 0% 10% 20% 30% 40% 50% 60% 70% 80% 90% 100%  45% -10 -5 0 5 10 15 20 25 CR3 1) Years Opening Scale Focus Balance/ Alliance Paper Drugs Natural gas liquids Semiconductors Telecom Brewers Railroad Insurance Divers. Chemicals Utilities Automotive Supplier Restaurants & Fast Food Steel Producer integrated Automotive Mfrs. Confectionary Truck & Trailer Mfrs. Shipbuilding Distillers Cigarette Defense Electr. Soft drinks Aluminum Producers Food Retail Airlines Integrated oil & gas Ore Mining Banks Consumer Electronics Divers. Food Rubber & Tire Mfrs.
  • 8.
    Among 10.316 companieswe have selected 600 companies as TPNs which set the growth profile benchmarks to compete against scale 0 Maximal deviation of an industry median from the median of the 600 TPNs across industries Long-term growth of sales 17% Stabile profitability 10% High asset turnover 1,1 Healthy financial structure 0,9 +75% +50% +25% - 75% - 50% - 25% Sales CAGR (2005/2000 in % p.a.) EBIT in total assets (av. 2000-2005 in %) Equity / debt (av. 2000-2005) Asset Turn (average 2000-2005) Critical mass 1000 mil $ Sales revenues in million $ 2005 Indicators of operational capabilities Indicators of strategic capabilities Energy 24% Energy 17% Retail 1,9 Chemicals 1,2 Energy 2000 mil $ Electronic 13% Retail 7% Energy 0,6 Mechanical engineering 0,7 Raw material suppliers 690 mil $
  • 9.
    We have identifiedsix imperatives of scale-based-competition 2. Benchmark your growth profile 1. Position your scale profile 3. Review your growth direction 4. Leverage unique growth capabilities 5. Apply appropriate growth paths 6. Adapt your Organization
  • 10.
    Both regional productniches and regional multi-business niches are not sustainable in concentrating industries % Top Performing Niche Players (TPN) according to industry concentration phases (n=600) Apply Appropriate Growth Direction 0% 20% 17% 63% Regional product niche Regional multi-product niches International product niches Sustainable global market niches 100% = 30 TPN Opening phase (CR3<20%) 6% 49% 20% 25% 100% = 437 TPN Scale phase (20%≤CR3<40%) 8% 60% 15% 17% 100% = 119 TPN Focus phase (40%≤CR3<70%) 15% 71% 7% 7% 100% = 14 TPN Balance phase (70%≤CR3)
  • 11.
    For development ofinternational product niches companies need innovativeness and other unique product and/or market related capabilities Market split Innovation Other product or market capabilities Counter Niches Product and/or Regional Focus 100% = 119 TPN 100% = 14 TPN 100% = 437 TPN 100% = 30 TPN 90% 67% 53% 21% 7% 21% 22% 36% 6% 16% 21% 5% 8% 14% 0% 3% 7% 0% 1% 2% % Top Performing Niche Players (TPN) according to industry concentration phases (n=600) Leverage Unique Growth Capabilities Opening phase (CR3<20%) Scale phase (20%≤CR3<40%) Focus phase (40%≤CR3<70%) Balance phase (70%≤CR3)
  • 12.
    100% = 119TPN 100% = 14 TPN 100% = 437 TPN Organic growth 100% = 30 TPN Speed niches Acquisition Cooperations 60% 44% 48% 23% 9% 9% 21% 40% 23% 24% 21% 24% 19% 35% 0% 0% Cooperations and acquisitions represent an important growth path toward the TPN in a global market niche % Top Performing Niche Players (TPN) according to industry concentration phases (n=600) Apply Appropriate Growth Paths Opening phase (CR3<20%) Scale phase (20%≤CR3<40%) Focus phase (40%≤CR3<70%) Balance phase (70%≤CR3)
  • 13.
    More than 70%of TPNs reach the critical mass of 0,7 to 1,5 billion US$ revenues and apply the centralised functional organisation structure 71% 27% 2% 87% 13% 39% 61% All 600 TPNs 70 Regional TPNs 64% 36% 85 International Product TPNs 11 Global Market TPNs Decentralized Regional Units Decentralized Product Units Partial Decentralisation Centralized Functional Units Decentralized Product and Regional Units % of TPNs according to organisation and growth direction Transform Your Organization
  • 14.
    The industry concentrationprocess will affect the Slovenian companies as well 0 3 6 9 10 50 90 130 200 700 450 0 3 6 9 10 50 90 130 200 700 450 The value of domestic companies acquired by foreign companies The value of foreign companies acquired by domestic companies (according to the country of origin) The total value of international acquisitions (1.1.2000 – 31.12.2006 in billion US $) PT BG GR GB D UA PL F I GDP FI,DK SLO GDP GDP MK CRO, RO SK YU TR ≥ 360 Billion $ ≥ 120; <360 Billion $ The size of bubble represents GDP of individual countries (in billion US$) <120 Billion $ D (Germany), GB (Great Britain) F (France), I (Italy), E (Spain) RU (Russia), NL (Netherlands), CH (Suisse), BE (Belgium), TR (Turkey) S (Sweden), A (Austria), PL (Poland), NO (Norway), DK (Denmark), GR (Greece), IE (Ireland), FI (Finland), PT (Portugal), CZ (Czech Republic) HU (Hungary), RO (Romania), UA (Ukraine), SK (Slovakia), CRO (Croatia), SLO (Slovenia), LU (Luxemburg), YU (Serbia), BG (Bulgaria), MK (Macedonia) RU A LU CZ HU BE, E,CH NO,S NL NO, IE
  • 15.
    If the trendof foreign acquisitions in the Eastern European will be ‘mapped’ in to SEE the region will be ‘sold out’ in next five years 0 1 10 20 30 0 1 10 20 40 The color of the bubble indicates the time frame of the transaction Countries of south-eastern Europe (SEE): RO, CRO, SLO, YU, BG, MK, A 1.1.1987 – 31.12.1991 1.1.1992 – 31.12.1996 1.1.1997 – 31.12.2001 1.1.2002 – 31.12.2006 Countries of eastern Europe (EE): CZ, SK, HU, PL 1) 1) Acquisitions ≥ 100 billion US$ 30 40 50 50 1.1.2007 – 31.12.2011 ? SEE EE EE EE EE SEE SEE The total value of international acquisitions (1.1.2000 – 31.12.2006 in billion US $) The value of domestic companies acquired by foreign companies The value of foreign companies acquired by domestic companies (according to the country of origin)
  • 16.
    The growth ofrevenues of Slovenian companies is at the level of TPNs, however their limited size (in terms of revenues) would require their faster growth and higher profitability Note: 1) Bank and insurance companies (11of 91 largest companies) are not included in the calculation of median revenues. The total assets median of Slovene banking and insurance companies was 3045 mi l $ and the median of TPNs was 8194 mi l $. 1) 1,02 1,11 3% 13% 82 Median value of all companies 2,46 1,51 4% 18% 181 Weighted average of all companies 3,21 1,43 4% 17% 63 Weighted average of 109 smaller SLO companies (less than 100 million US$ revenues) 1,46 1,33 3% 14% 350 Weighted average of 91 largest SLO companies (more than 100 million US$ revenues) Asset turnover Healthy financing Stabile profitability Revenue CAGR (2000-2005 in %) Revenue in mil US$ (2005)   Median value of TPNs from different industries 1000 17% 10% 0,9 1,1