
More Related Content
Viewers also liked
Viewers also liked (13)
Similar to Lampiran
Similar to Lampiran (20)
Recently uploaded
Recently uploaded (20)
Lampiran
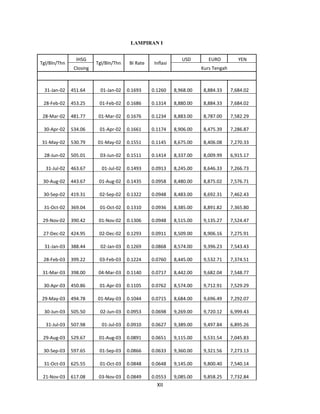
- 1. XII LAMPIRAN I Tgl/Bln/Thn IHSG Tgl/Bln/Thn BI Rate Inflasi USD EURO YEN Closing Kurs Tengah 31-Jan-02 451.64 01-Jan-02 0.1693 0.1260 8,968.00 8,884.33 7,684.02 28-Feb-02 453.25 01-Feb-02 0.1686 0.1314 8,880.00 8,884.33 7,684.02 28-Mar-02 481.77 01-Mar-02 0.1676 0.1234 8,883.00 8,787.00 7,582.29 30-Apr-02 534.06 01-Apr-02 0.1661 0.1174 8,906.00 8,475.39 7,286.87 31-May-02 530.79 01-May-02 0.1551 0.1145 8,675.00 8,406.08 7,270.33 28-Jun-02 505.01 03-Jun-02 0.1511 0.1414 8,337.00 8,009.99 6,915.17 31-Jul-02 463.67 01-Jul-02 0.1493 0.0913 8,245.00 8,646.33 7,266.73 30-Aug-02 443.67 01-Aug-02 0.1435 0.0958 8,480.00 8,875.02 7,576.71 30-Sep-02 419.31 02-Sep-02 0.1322 0.0948 8,483.00 8,692.31 7,462.43 31-Oct-02 369.04 01-Oct-02 0.1310 0.0936 8,385.00 8,891.82 7,365.80 29-Nov-02 390.42 01-Nov-02 0.1306 0.0948 8,515.00 9,135.27 7,524.47 27-Dec-02 424.95 02-Dec-02 0.1293 0.0911 8,509.00 8,906.16 7,275.91 31-Jan-03 388.44 02-Jan-03 0.1269 0.0868 8,574.00 9,396.23 7,543.43 28-Feb-03 399.22 03-Feb-03 0.1224 0.0760 8,445.00 9,532.71 7,374.51 31-Mar-03 398.00 04-Mar-03 0.1140 0.0717 8,442.00 9,682.04 7,548.77 30-Apr-03 450.86 01-Apr-03 0.1105 0.0762 8,574.00 9,712.91 7,529.29 29-May-03 494.78 01-May-03 0.1044 0.0715 8,684.00 9,696.49 7,292.07 30-Jun-03 505.50 02-Jun-03 0.0953 0.0698 9,269.00 9,720.12 6,999.43 31-Jul-03 507.98 01-Jul-03 0.0910 0.0627 9,389.00 9,497.84 6,895.26 29-Aug-03 529.67 01-Aug-03 0.0891 0.0651 9,115.00 9,531.54 7,045.83 30-Sep-03 597.65 01-Sep-03 0.0866 0.0633 9,360.00 9,321.56 7,273.13 31-Oct-03 625.55 01-Oct-03 0.0848 0.0648 9,145.00 9,800.40 7,540.14 21-Nov-03 617.08 03-Nov-03 0.0849 0.0553 9,085.00 9,858.25 7,732.84
- 2. XIII 30-Dec-03 691.90 01-Dec-03 0.0831 0.0516 9,005.00 10,231.66 7,750.97 30-Jan-04 752.93 01-Jan-04 0.0788 0.0482 9,305.00 10,564.89 8,037.88 27-Feb-04 761.08 03-Feb-04 0.0770 0.0460 9,166.00 10,522.06 8,003.23 31-Mar-04 735.68 01-Mar-04 0.0742 0.0511 9,250.00 10,576.57 7,720.88 30-Apr-04 783.41 01-Apr-04 0.0733 0.0592 9,485.00 10,525.88 8,214.63 31-May-04 732.52 04-May-04 0.0732 0.0647 9,528.00 10,371.31 7,882.73 30-Jun-04 732.40 01-Jun-04 0.0734 0.0683 9,528.00 11,298.00 8,441.34 30-Jul-04 756.98 01-Jul-04 0.0736 0.0720 9,760.00 11,427.84 8,681.88 31-Aug-04 754.70 02-Aug-04 0.0737 0.0667 9,796.00 10,993.16 8,201.74 30-Sep-04 820.13 01-Sep-04 0.0739 0.0627 10,450.00 11,406.11 8,570.27 29-Oct-04 860.49 01-Oct-04 0.0741 0.0622 10,300.00 11,363.59 8,300.82 30-Nov-04 977.77 01-Nov-04 0.0741 0.0618 10,150.00 11,612.92 8,555.83 30-Dec-04 1,000.23 01-Dec-04 0.0749 0.0640 10,030.00 11,968.11 8,755.90 31-Jan-05 1,045.44 03-Jan-05 0.0742 0.0732 9,795.00 12,581.77 9,081.61 28-Feb-05 1,073.83 01-Feb-05 0.0743 0.0715 9,320.00 11,956.60 8,844.94 31-Mar-05 1,080.17 01-Mar-05 0.0744 0.0881 9,170.00 12,209.55 8,837.31 29-Apr-05 1,029.61 01-Apr-05 0.0770 0.0812 9,045.00 12,292.10 8,831.07 31-May-05 1,088.17 02-May-05 0.0795 0.0740 8,785.00 12,239.20 9,042.86 30-Jun-05 1,122.38 01-Jun-05 0.0825 0.0742 9,260.00 11,748.51 8,807.15 29-Jul-05 1,182.30 01-Jul-05 0.0849 0.0784 9,165.00 11,797.41 8,799.14 31-Aug-05 1,050.09 01-Aug-05 0.0880 0.0833 9,085.00 11,913.41 8,715.70 30-Sep-05 1,079.28 01-Sep-05 0.1000 0.0906 9,090.00 12,891.66 9,437.39 31-Oct-05 1,066.22 03-Oct-05 0.1100 0.1789 9,228.00 12,293.58 9,016.51 30-Nov-05 1,096.64 01-Nov-05 0.1225 0.1838 9,105.00 12,163.26 8,715.44 29-Dec-05 1,162.64 01-Dec-05 0.1275 0.1711 9,140.00 11,822.88 8,372.99 30-Jan-06 1,232.32 02-Jan-06 0.1275 0.1703 8,950.00 11,605.62 8,326.97
- 3. XIV 28-Feb-06 1,230.66 01-Feb-06 0.1275 0.1792 9,080.00 11,325.21 7,951.21 31-Mar-06 1,322.97 01-Mar-06 0.1275 0.1574 9,130.00 10,948.99 7,915.07 28-Apr-06 1,464.41 03-Apr-06 0.1275 0.1540 9,110.00 10,939.03 7,664.29 31-May-06 1,330.00 01-May-06 0.1250 0.1560 9,083.00 11,087.56 7,765.07 30-Jun-06 1,310.26 01-Jun-06 0.1250 0.1553 8,779.00 11,838.92 8,225.64 31-Jul-06 1,351.65 03-Jul-06 0.1225 0.1515 9,019.00 11,710.59 7,996.69 31-Aug-06 1,431.26 01-Aug-06 0.1175 0.1490 9,239.00 11,587.47 7,923.78 29-Sep-06 1,534.61 01-Sep-06 0.1125 0.1455 9,388.00 11,637.48 7,759.29 31-Oct-06 1,582.63 02-Oct-06 0.1075 0.0629 9,101.00 11,689.58 7,806.12 30-Nov-06 1,718.96 01-Nov-06 0.1025 0.0527 9,078.00 11,622.54 7,789.72 29-Dec-06 1,805.52 01-Dec-06 0.0975 0.0660 9,359.00 12,121.02 7,912.41 31-Jan-07 1,757.26 02-Jan-07 0.0950 0.0626 9,370.00 11,849.36 7,538.44 28-Feb-07 1,740.97 01-Feb-07 0.0925 0.0630 9,223.00 11,837.15 7,523.10 30-Mar-07 1,830.92 01-Mar-07 0.0900 0.0652 9,107.00 12,084.48 7,707.25 30-Apr-07 1,999.17 02-Apr-07 0.0900 0.0629 9,199.00 12,162.31 7,731.16 31-May-07 2,084.32 01-May-07 0.0875 0.0601 9,232.00 12,395.58 7,598.62 29-Jun-07 2,139.28 04-Jun-07 0.0850 0.0577 9,310.00 11,804.69 7,199.15 31-Jul-07 2,348.67 02-Jul-07 0.0825 0.0605 9,215.00 12,208.58 7,325.08 31-Aug-07 2,194.34 01-Aug-07 0.0825 0.0651 9,081.00 12,630.65 7,788.41 28-Sep-07 2,359.21 03-Sep-07 0.0825 0.0695 9,163.00 12,799.61 8,104.29 31-Oct-07 2,643.49 01-Oct-07 0.0825 0.0688 9,555.00 12,980.31 7,912.20 30-Nov-07 2,688.33 01-Nov-07 0.0825 0.0671 10,800.00 13,130.88 7,864.17 28-Dec-07 2,745.83 03-Dec-07 0.0800 0.0659 12,224.00 13,720.31 8,461.65 31-Jan-08 2,627.25 02-Jan-08 0.0800 0.0736 10,950.00 13,698.02 8,386.30 29-Feb-08 2,721.94 01-Feb-08 0.0800 0.0740 11,700.00 13,713.69 8,665.80 31-Mar-08 2,447.30 03-Mar-08 0.0800 0.0817 12,023.00 13,844.93 8,837.47
- 4. XV 30-Apr-08 2,304.52 01-Apr-08 0.0800 0.0896 11,620.00 14,511.89 9,202.70 30-May-08 2,444.35 02-May-08 0.0825 0.1038 10,655.00 14,280.99 8,821.38 30-Jun-08 2,349.10 02-Jun-08 0.0850 0.1103 10,263.00 14,465.42 8,833.02 31-Jul-08 2,304.51 01-Jul-08 0.0875 0.1190 10,255.00 14,507.18 8,669.69 29-Aug-08 2,165.94 01-Aug-08 0.0900 0.1185 9,890.00 14,130.50 8,419.65 29-Sep-08 1,832.51 01-Sep-08 0.0925 0.1214 10,120.00 13,413.27 8,461.94 31-Oct-08 1,256.70 06-Oct-08 0.0950 0.1177 9,625.00 13,037.33 9,145.74 28-Nov-08 1,241.54 03-Nov-08 0.0950 0.1168 9,610.00 13,865.60 10,861.92 30-Dec-08 1,355.41 01-Dec-08 0.0925 0.1106 9,485.00 15,472.53 12,826.88 30-Jan-09 1,332.67 05-Jan-09 0.0875 0.0917 9,330.00 15,177.26 11,895.08 27-Feb-09 1,285.48 02-Feb-09 0.0825 0.0860 9,395.00 14,902.89 13,023.89 31-Mar-09 1,434.07 02-Mar-09 0.0775 0.0792 9,313.00 15,132.16 12,309.84 30-Apr-09 1,722.77 01-Apr-09 0.0750 0.0731 9,075.00 15,353.51 11,757.58 29-May-09 1,916.83 01-May-09 0.0725 0.0604 9,030.00 14,122.15 10,772.97 30-Jun-09 2,026.78 01-Jun-09 0.0700 0.0365 9,210.00 14,533.45 10,822.53 31-Jul-09 2,323.24 01-Jul-09 0.0675 0.0271 9,094.00 14,395.46 10,589.64 31-Aug-09 2,341.54 03-Aug-09 0.0650 0.0275 8,938.00 14,090.78 10,435.80 30-Sep-09 2,467.59 01-Sep-09 0.0650 0.0283 9,034.00 14,506.53 10,875.89 30-Oct-09 2,367.70 01-Oct-09 0.0650 0.0257 8,921.00 14,098.22 10,710.51 30-Nov-09 2,415.84 02-Nov-09 0.0650 0.0241 8,921.00 14,170.92 10,681.95 30-Dec-09 2,534.36 01-Dec-09 0.0650 0.0278 9,032.00 14,236.04 10,891.67 29-Jan-10 2,610.80 04-Jan-10 0.0650 0.0372 8,976.00 13,330.25 10,046.31 25-Feb-10 2,549.03 01-Feb-10 0.0650 0.0381 9,042.00 13,020.54 10,426.74 31-Mar-10 2,777.30 01-Mar-10 0.0650 0.0343 8,812.00 12,664.76 10,445.86 30-Apr-10 2,971.25 01-Apr-10 0.0650 0.0391 8,699.00 12,257.16 9,715.24 31-May-10 2,796.96 03-May-10 0.0650 0.0416 8,551.00 11,944.45 9,610.48
- 5. XVI 30-Jun-10 2,913.68 01-Jun-10 0.0650 0.0505 8,540.00 11,289.63 10,112.56 30-Jul-10 3,069.28 01-Jul-10 0.0650 0.0622 8,563.00 11,107.42 10,320.03 31-Aug-10 3,081.88 02-Aug-10 0.0650 0.0644 8,481.00 11,689.57 10,327.59 30-Sep-10 3,501.30 01-Sep-10 0.0650 0.0580 8,539.00 11,455.57 10,701.26 29-Oct-10 3,635.32 01-Oct-10 0.0650 0.0567 8,925.00 12,182.53 10,682.57 30-Nov-10 3,531.21 01-Nov-10 0.0650 0.0633 8,893.00 12,481.83 11,059.33 30-Dec-10 3,703.51 01-Dec-10 0.0650 0.0696 9,085.00 11,733.48 10,798.04 31-Jan-11 3,409.17 03-Jan-11 0.0650 0.0702 8,976.00 11,923.28 11,037.22 28-Feb-11 3,470.35 01-Feb-11 0.0675 0.0684 9,042.00 12,403.82 11,012.75 31-Mar-11 3,678.67 01-Mar-11 0.0675 0.0665 8,812.00 12,164.97 10,747.67 29-Apr-11 3,819.62 01-Apr-11 0.0675 0.0616 8,699.00 12,318.23 10,401.17 31-May-11 3,836.97 02-May-11 0.0675 0.0598 8,551.00 12,655.49 10,528.21 30-Jun-11 3,888.57 01-Jun-11 0.0675 0.0554 8,540.00 12,316.82 10,502.37 29-Jul-11 4,130.80 01-Jul-11 0.0675 0.0461 8,563.00 12,409.52 10,608.29 26-Aug-11 3,841.73 01-Aug-11 0.0675 0.0479 8,481.00 12,204.17 10,919.99 30-Sep-11 3,549.03 05-Sep-11 0.0675 0.0461 8,539.00 12,096.36 11,122.12 31-Oct-11 3,790.85 03-Oct-11 0.0650 0.0442 8,925.00 11,902.39 11,591.68 30-Nov-11 3,715.08 01-Nov-11 0.0600 0.0415 8,893.00 12,322.15 11,377.95 30-Dec-11 3,821.99 01-Dec-11 0.0600 0.0379 9,085.00 12,213.43 11,702.96
- 6. XVII LAMPIRAN II REGRESI DATA PANEL Dependent Variable: IHSG Method: Least Squares Date: 05/31/12 Time: 05:34 Sample: 2005M07 2011M12 Included observations: 78 Variable Coefficient Std. Error t-Statistic Prob. C 9079.891 544.7300 16.66861 0.0000 BI_RATE -23078.34 4890.127 -4.719374 0.0000 EURO 0.072226 0.038561 1.873047 0.0651 INFLASI 4481.562 1679.503 2.668386 0.0094 USD -0.919849 0.074240 -12.39024 0.0000 YEN 0.269185 0.037856 7.110770 0.0000 R-squared 0.916190 Mean dependent var 2296.140 Adjusted R-squared 0.910370 S.D. dependent var 884.5343 S.E. of regression 264.8140 Akaike info criterion 14.06974 Sum squared resid 5049104. Schwarz criterion 14.25102 Log likelihood -542.7197 Hannan-Quinn criter. 14.14231 F-statistic 157.4178 Durbin-Watson stat 0.904478 Prob(F-statistic) 0.000000 0 2 4 6 8 10 12 14 -1200 -800 -400 0 400 800 1200 Series: Residuals Sample 1 120 Observations 120 Mean 9.55e-13 Median -75.23734 Maximum 1170.487 Minimum -1326.123 Std. Dev. 521.1305 Skewness 0.177918 Kurtosis 2.301916 Jarque-Bera 3.069706 Probability 0.215487
- 7. XVIII Heteroskedasticity Test: Breusch-Pagan-Godfrey F-statistic 1.033789 Prob. F(5,114) 0.4013 Obs*R-squared 5.204994 Prob. Chi-Square(5) 0.3914 Scaled explained SS 3.057879 Prob. Chi-Square(5) 0.6911 Dependent Variable: IHSG Method: Least Squares Date: 05/31/12 Time: 05:34 Sample: 2005M07 2011M12 Included observations: 78 Variable Coefficient Std. Error t-Statistic Prob. C 9079.891 544.7300 16.66861 0.0000 BI_RATE -23078.34 4890.127 -4.719374 0.0000 EURO 0.072226 0.038561 1.873047 0.0651 INFLASI 4481.562 1679.503 2.668386 0.0094 USD -0.919849 0.074240 -12.39024 0.0000 YEN 0.269185 0.037856 7.110770 0.0000 R-squared 0.916190 Mean dependent var 2296.140 Adjusted R-squared 0.910370 S.D. dependent var 884.5343 S.E. of regression 264.8140 Akaike info criterion 14.06974 Sum squared resid 5049104. Schwarz criterion 14.25102 Log likelihood -542.7197 Hannan-Quinn criter. 14.14231 F-statistic 157.4178 Durbin-Watson stat 0.904478 Prob(F-statistic) 0.000000
- 8. XIX obs Actual Fitted Residual Residual Plot 2005M07 1122.38 1626.85 -504.471 | * . | . | 2005M08 1182.30 1357.47 -175.166 | . * | . | 2005M09 1050.09 1017.13 32.9605 | . |* . | 2005M10 1079.28 1260.10 -180.822 | . * | . | 2005M11 1066.22 928.558 137.662 | . | * . | 2005M12 1096.64 920.599 176.041 | . | * . | 2006M01 1162.64 1207.20 -44.5614 | . *| . | 2006M02 1232.32 1345.79 -113.471 | . * | . | 2006M03 1230.66 1327.26 -96.5991 | . * | . | 2006M04 1322.97 1589.31 -266.336 | * | . | 2006M05 1464.41 1455.87 8.54302 | . * . | 2006M06 1330.00 1342.06 -12.0621 | . * . | 2006M07 1310.26 1527.95 -217.691 | .* | . | 2006M08 1351.65 1572.27 -220.620 | .* | . | 2006M09 1431.26 1571.77 -140.510 | . * | . | 2006M10 1534.61 1398.24 136.369 | . | * . | 2006M11 1582.63 1487.63 94.9976 | . | * . | 2006M12 1718.96 1698.84 20.1155 | . * . | 2007M01 1805.52 1641.44 164.084 | . | * . | 2007M02 1757.26 1730.60 26.6612 | . * . | 2007M03 1740.97 1847.20 -106.226 | . * | . | 2007M04 1830.92 1844.10 -13.1834 | . * . | 2007M05 1999.17 1995.23 3.94254 | . * . | 2007M06 2084.32 1877.70 206.619 | . | *. | 2007M07 2139.28 1959.57 179.712 | . | * . | 2007M08 2348.67 1895.99 452.678 | . | . * | 2007M09 2194.34 2126.79 67.5460 | . |* . | 2007M10 2359.21 2168.96 190.252 | . | * . | 2007M11 2643.49 2116.96 526.534 | . | . * | 2007M12 2688.33 2067.95 620.383 | . | . * 2008M01 2745.83 2338.01 407.818 | . | . * | 2008M02 2627.25 2534.03 93.2234 | . | * . | 2008M03 2721.94 2632.53 89.4102 | . | * . | 2008M04 2447.30 2540.73 -93.4301 | . * | . | 2008M05 2304.52 2464.63 -160.114 | . * | . | 2008M06 2444.35 2488.19 -43.8387 | . *| . | 2008M07 2349.10 2481.02 -131.915 | . * | . | 2008M08 2304.51 2321.78 -17.2740 | . * . | 2008M09 2165.94 2213.12 -47.1831 | . *| . | 2008M10 1832.51 1302.06 530.452 | . | . * | 2008M11 1256.70 764.001 492.699 | . | . * | 2008M12 1241.54 1718.52 -476.979 | * . | . | 2009M01 1355.41 1467.90 -112.491 | . * | . | 2009M02 1332.67 911.303 421.367 | . | . * | 2009M03 1285.48 1249.20 36.2794 | . |* . | 2009M04 1434.07 1776.48 -342.410 | *. | . | 2009M05 1722.77 2071.27 -348.501 | *. | . | 2009M06 1916.83 2107.18 -190.346 | . * | . | 2009M07 2026.78 2306.90 -280.118 | * | . | 2009M08 2323.24 2383.63 -60.3858 | . *| . | 2009M09 2341.54 2701.54 -359.999 | *. | . | 2009M10 2467.59 2728.16 -260.569 | .* | . | 2009M11 2367.70 2917.99 -550.290 | * . | . | 2009M12 2415.84 2747.43 -331.586 | *. | . | 2010M01 2534.36 2853.44 -319.077 | * | . | 2010M02 2610.80 2850.47 -239.667 | .* | . | 2010M03 2549.03 2837.33 -288.300 | * | . | 2010M04 2777.30 2880.24 -102.940 | . * | . | 2010M05 2971.25 2817.54 153.712 | . | * . | 2010M06 2796.96 2989.98 -193.025 | . * | . |
- 9. XX 2010M07 2913.68 3232.53 -318.847 | * | . | 2010M08 3069.28 3239.66 -170.383 | . * | . | 2010M09 3081.88 3359.84 -277.964 | * | . | 2010M10 3501.30 3479.39 21.9128 | . * . | 2010M11 3635.32 3290.36 344.957 | . | .* | 2010M12 3531.21 3431.65 99.5575 | . | * . | 2011M01 3703.51 3401.97 301.541 | . | * | 2011M02 3409.17 3472.15 -62.9767 | . *| . | 2011M03 3470.35 3507.74 -37.3866 | . *| . | 2011M04 3678.67 3639.57 39.1038 | . |* . | 2011M05 3819.62 3636.32 183.301 | . | * . | 2011M06 3836.97 3615.19 221.780 | . | *. | 2011M07 3888.57 3710.27 178.303 | . | * . | 2011M08 4130.80 3706.85 423.953 | . | . * | 2011M09 3841.73 3558.42 283.311 | . | * | 2011M10 3549.03 3539.04 9.98676 | . * . | 2011M11 3790.85 3478.58 312.270 | . | * | 2011M12 3715.08 3495.40 219.676 | . | *. |