Outstanding government bonds as of 01.07.2018
•
0 likes•37 views

This document lists 48 Ukrainian domestic bond issues outstanding as of July 1, 2018. It provides details for each bond such as issue date, maturity date, coupon dates, nominal yield, currency, and amount outstanding. The bonds vary in tenor from 90 to 3,365 days and are denominated in UAH, USD, EUR, and other currencies. Over 11 billion units of the bonds from various issues remained outstanding on the date listed.

More Related Content
What's hot
Similar to Outstanding government bonds as of 01.07.2018
Similar to Outstanding government bonds as of 01.07.2018 (20)
More from Ministry of Finance of Ukraine
More from Ministry of Finance of Ukraine (20)
Recently uploaded
Recently uploaded (14)
Outstanding government bonds as of 01.07.2018
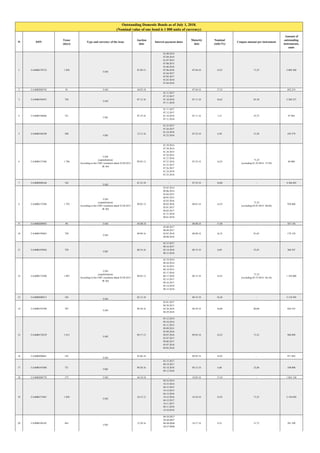
- 1. № ISIN Tenor (days) Type and currency of the issue Auction date Interest payment dates Maturity date Nominal yield (%) Coupon amount per instrument Amount of outstanding instruments, units 1 UA4000170732 1 820 UAH 07.09.13 01.08.2014 07.09.2014 01.07.2015 07.08.2015 01.06.2016 07.06.2016 01.04.2017 07.05.2017 01.03.2018 07.04.2018 07.04.18 14,25 71,25 2 089 300 2 UA4000200745 91 UAH 04.03.18 - 07.04.18 17,33 - 692 219 3 UA4000194591 728 UAH 07.12.16 01.11.2017 07.12.2017 01.10.2018 07.11.2018 07.11.18 16,62 83,10 2 260 327 4 UA4000194666 721 USD 07.19.16 01.11.2017 07.12.2017 01.10.2018 07.11.2018 07.11.18 7,15 35,75 97 864 5 UA4000196109 588 USD 12.13.16 01.25.2017 07.26.2017 01.24.2018 07.25.2018 07.25.18 6,30 31,50 105 279 6 UA4000173306 1 786 UAH (capitalization) According to the CMU resolution dated 22.04.2013 № 364 09.03.13 01.29.2014 07.30.2014 01.28.2015 07.29.2015 01.27.2016 07.27.2016 01.25.2017 07.26.2017 01.24.2018 07.25.2018 07.25.18 14,25 71,25 (excluding 01.29.2014– 57,94) 40 800 7 UA4000200166 182 UAH 01.23.18 - 07.25.18 16,00 - 4 366 043 8 UA4000173298 1 793 UAH (capitalization) According to the CMU resolution dated 22.04.2013 № 364 09.03.13 02.05.2014 08.06.2014 02.04.2015 08.05.2015 02.03.2016 08.03.2016 02.01.2017 08.02.2017 01.31.2018 08.01.2018 08.01.18 14,25 71,25 (excluding 02.05.2014– 60,68) 950 800 9 UA4000200943 90 UAH 05.08.18 -‐ 08.08.18 17,40 - 547 158 10 UA4000194963 728 UAH 08.09.16 02.08.2017 08.09.2017 02.07.2018 08.08.2018 08.08.18 16,33 81,65 179 150 11 UA4000195036 728 USD 08.16.16 02.15.2017 08.16.2017 02.14.2018 08.15.2018 08.15.18 6,69 33,45 368 247 12 UA4000173280 1 807 UAH (capitalization) According to the CMU resolution dated 22.04.2013 № 364 09.03.13 02.19.2014 08.20.2014 02.18.2015 08.19.2015 02.17.2016 08.17.2016 02.15.2017 08.16.2017 02.14.2018 08.15.2018 08.15.18 14,25 71,25 (excluding 02.19.2014– 66,16) 1 250 000 13 UA4000200513 182 UAH 02.13.18 -‐ 08.15.18 16,24 - 2 118 942 14 UA4000195390 707 UAH 09.20.16 03.01.2017 08.30.2017 02.28.2018 08.29.2018 08.29.18 16,00 80,00 826 555 15 UA4000174239 1 813 UAH 09.17.13 03.12.2014 09.10.2014 03.11.2015 09.09.2015 03.09.2016 09.07.2016 03.07.2017 09.06.2017 03.07.2018 09.05.2018 09.05.18 14,25 71,25 948 890 16 UA4000200661 182 UAH 03.06.18 -‐ 09.05.18 16,92 - 871 862 17 UA4000195408 721 USD 09.20.16 03.15.2017 09.19.2017 03.14.2018 09.12.2018 09.12.18 6,48 32,40 100 000 18 UA4000200778 175 UAH 04.10.18 - 10.03.18 17,10 - 1 863 130 19 UA4000175467 1 820 UAH 10.15.13 04.16.2014 10.15.2014 04.15.2015 10.14.2015 04.13.2016 10.12.2016 04.12.2017 10.11.2017 04.11.2018 10.10.2018 10.10.18 14,25 71,25 2 126 050 20 UA4000196182 665 USD 12.20.16 04.19.2017 10.18.2017 04.18.2018 10.17.2018 10.17.18 6,35 31,75 501 100 Outstanding Domestic Bonds as of July 1, 2018. (Nominal value of one bond is 1 000 units of currency)
- 2. 21 UA4000195663 728 EUR 10.25.16 04.26.2017 10.25.2017 04.25.2018 10.24.2018 10.24.18 4,00 20,00 141 320 22 UA4000176093 1 820 UAH 10.29.13 04.30.2014 10.24.2014 04.29.2015 10.28.2015 04.27.2016 10.26.2016 04.26.2017 10.25.2017 04.25.2018 10.24.2018 10.24.18 14,25 71,25 1 393 330 23 UA4000200950 181 UAH 05.08.18 -‐ 11.07.18 17,20 - 632 731 24 UA4000177943 1 814 UAH (capitalization) According to the CMU resolution dated 03.07.2013 № 390-p 12.10.13 06.04.2014 12.03.2014 06.03.2015 12.02.2015 06.01.2016 11.30.2016 05.31.2017 11.29.2017 05.30.2018 11.28.2018 11.28.18 9,50 47,50 (excluding 06.04.2014– 45,93 300 000 25 UA4000200604 273 UAH 02.27.18 -‐ 11.28.18 16,50 - 5 281 081 26 UA4000196190 721 USD 12.20.16 06.14.2017 12.13.2017 06.13.2018 12.12.2018 12.12.18 6,40 32,00 116 682 27 UA4000196562 721 UAH 01.10.17 07.05.2017 01.03.2018 07.04.2018 01.02.2019 01.02.19 15,50 77,50 2 863 000 28 UA4000178891 1 820 UAH 01.14.14 07.16.2014 01.14.2015 07.15.2015 01.13.2016 07.13.2016 01.11.2017 07.12.2017 01.10.2018 07.11.2018 01.09.2019 01.09.19 14,25 71,25 2 645 644 29 UA4000179576 1 797 UAH (capitalization) According to the CMU resolution dated 12.02.2014 № 40 02.14.14 07.23.2014 01.21.2015 07.22.2015 01.20.2016 07.20.2016 01.18.2017 07.19.2017 01.17.2018 07.18.2018 01.16.2019 01.16.19 14,25 71,25 (excluding 07.23.2014– 62,25) 2 500 000 30 UA4000179196 1 820 UAH 01.29.14 07.30.2014 01.28.2015 07.29.2015 01.27.2016 07.27.2016 01.25.2017 07.26.2017 01.24.2018 07.25.2018 01.23.2019 01.23.19 14,25 71,25 1 626 723 31 UA4000192660 1 091 UAH 01.27.16 07.27.2016 01.25.2017 07.26.2017 01.24.2018 07.25.2018 01.23.2019 01.23.19 20,00 100,00 3 619 898 32 UA4000179519 1 812 UAH 02.13.14 08.06.2014 02.04.2015 08.05.2015 02.03.2016 08.03.2016 02.01.2017 08.02.2017 01.31.2018 08.01.2018 01.30.2019 01.30.19 14,25 71,25 1 650 000 33 UA4000200257 364 USD 01.30.2018 -‐ 01.30.19 5,30 - 304 041 34 UA4000200968 272 UAH 05.08.18 - 02.06.19 17,22 - 268 869 35 UA4000061808 3 365 UAH (capitalization) According to the CMU resolution dated 11.11.2009 № 1202 11.20.09 02.17.2010 08.18.2010 02.16.2011 08.17.2011 02.15.2012 08.15.2012 02.13.2013 08.14.2013 02.12.2014 08.13.2014 02.11.2015 08.12.2015 02.10.2016 08.10.2016 02.08.2017 08.09.2017 02.07.2018 08.08.2018 02.06.2019 02.06.19 9,50 47,50 (excluding 02.17.2010– 23,23) 1 400 000 36 UA4000179691 1 820 UAH 02.18.14 08.20.2014 02.18.2015 08.19.2015 02.17.2016 08.17.2016 02.15.2017 08.16.2017 02.14.2018 08.15.2018 02.13.2019 02.13.19 14,25 71,25 600 000
- 3. 37 UA4000179766 1 812 UAH 02.27.14 08.20.2014 02.18.2015 08.19.2015 02.17.2016 08.17.2016 02.15.2017 08.16.2017 02.14.2018 08.15.2018 02.13.2019 02.13.19 11,50 57,50 1 500 000 38 UA4000179741 1 820 UAH 02.26.14 08.27.2014 02.25.2015 08.26.2015 02.24.2016 08.24.2016 02.22.2017 08.23.2017 02.21.2018 08.22.2018 02.20.2019 02.20.19 11,50 57,50 1 500 000 39 UA4000201446 252 USD 06.19.18 - 02.27.19 5,20 - 167 450 40 UA4000197081 714 UAH 03.21.17 09.06.2017 03.07.2018 09.05.2018 03.06.2019 03.06.19 15,09 75,45 1 663 590 41 UA4000199541 490 USD 11.28.17 04.04.2018 10.03.2018 04.03.2019 04.03.19 3,85 19,25 135 000 42 UA4000201370 294 UAH 06.12.18 - 04.03.19 17,30 - 496 985 43 UA4000199558 497 USD 11.28.17 04.11.2018 10.10.2018 04.10.2019 04.10.19 3,85 19,25 73 000 44 UA4000180426 1 812 UAH 04.24.14 10.15.2014 04.15.2015 10.14.2015 04.13.2016 10.12.2016 04.12.2017 10.11.2017 04.11.2018 10.10.2018 04.10.2019 04.10.19 14,30 71,50 1 955 815 45 UA4000199566 504 USD 11.28.17 04.18.2018 10.17.2018 04.17.2019 04.17.19 3,85 19,25 73 000 46 UA4000199574 511 USD 11.28.17 04.25.2018 10.24.2018 04.24.2019 04.24.19 3,85 19,25 73 000 47 UA4000194088 1 091 UAH 04.27.16 10.26.2016 04.26.2017 10.25.2017 04.25.2018 10.24.2018 04.24.2019 04.24.19 18,45 92,25 2 757 500 48 UA4000199582 518 USD 11.28.17 05.02.2018 10.31.2018 05.01.2019 05.01.19 3,85 19,25 73 000 49 UA4000194138 1 092 UAH 05.17.16 11.16.2016 05.17.2017 11.15.2017 05.16.2018 11.14.2018 05.15.2019 05.15.19 18,21 91,05 1 909 070 50 UA4000199590 539 USD 11.28.17 05.23.2018 11.21.2018 05.22.2019 05.22.19 3,85 19,25 73 000 51 UA4000142137 2 532 UAH 06.14.12 11.28.2012 05.29.2013 11.27.2013 05.28.2014 11.26.2014 05.27.2015 11.25.2015 05.25.2016 11.23.2016 05.24.2017 11.22.2017 05.23.2018 11.21.2018 05.22.2019 05.22.19 14,13 70,65 1 099 550 52 UA4000199608 546 USD 11.28.17 05.30.2018 11.28.2018 05.29.2019 05.29.19 3,85 19,25 99 000 53 UA4000199665 546 EUR 12.05.17 06.06.2018 12.05.2018 06.05.2019 06.05.19 3,95 19,75 133 600 54 UA4000201388 364 UAH 06.12.18 - 06.12.19 17,25 - 105 000 55 UA4000201453 364 USD 06.19.18 - 06.19.19 5,40 - 63 550 56 UA4000185151 1 820 UAH (T-BILLS - VAT) According to the CMU resolution dated 05.21.2014. № 139 07.08.14 01.06.2015 07.07.2015 01.07.2016 07.05.2016 01.03.2017 07.04.2017 01.02.2018 07.03.2018 01.01.2019 07.02.2019 01.06.2015 07.07.2015 01.07.2016 07.05.2016 01.03.2017 07.04.2017 01.02.2018 07.03.2018 01.01.2019 07.02.2019 for each date 100 UAH 9,50 01.06.2015 year - 47,50 UAH, 07.07.2015 year - 42,75 UAH, 01.05.2016 year - 38,00 UAH, 07.05.2016 year - 33,25 UAH, 01.03.2017 year - 28,50 UAH, 07.04.2017 year - 23,75 UAH, 01.02.2018 year - 19,00 UAH, 07.03.2018 year - 14,25 UAH, 01.01.2019 year - 9,50 UAH, 07.02.2019 year - 4,75 UAH. 3 576 728 57 UA4000198469 693 USD 07.25.17 01.10.2018 07.11.2018 01.09.2019 07.10.2019 07.10.19 5,34 26,70 507 564
- 4. 58 UA4000194658 1 085 UAH 07.19.16 01.11.2017 07.12.2017 01.10.2018 07.11.2018 01.09.2019 07.10.2019 07.10.19 16,65 83,25 887 480 59 UA4000185557 1 820 UAH (T-BILLS - VAT) According to the CMU resolution dated 05.21.2014. № 139 07.28.14 01.26.2015 07.27.2015 01.25.2016 07.25.2016 01.23.2017 07.24.2017 01.22.2018 07.23.2018 01.21.2019 07.22.2019 01.26.2015 07.27.2015 01.25.2016 07.25.2016 01.23.2017 07.24.2017 01.22.2018 07.23.2018 01.21.2019 07.22.2019 for each date 100 UAH 9,50 01.26.2015 year - 47,50 UAH, 07.27.2015 year - 42,75 UAH, 01.25.2016 year - 38,00 UAH, 07.25.2016 year - 33,25 UAH, 01.23.2017 year - 28,50 UAH, 07.24.2017 year - 23,75 UAH, 01.22.2018 year - 19,00 UAH, 07.23.2018 year - 14,25 UAH, 01.21.2019 year - 9,50 UAH, 07.22.2019 year 4,75 UAH 2 171 200 60 UA4000185755 1 818 UAH 08.08.14 02.04.2015 08.05.2015 02.03.2016 08.03.2016 02.01.2017 08.02.2017 01.31.2018 08.01.2018 01.30.2019 07.31.2019 07.31.19 14,30 71,50 1 025 989 61 UA4000195028 1 092 UAH 08.16.16 02.15.2017 08.16.2017 02.14.2018 08.15.2018 02.13.2019 08.14.2019 08.14.19 16,07 80,35 797 900 62 UA4000186159 1 820 UAH (T-BILLS - VAT) According to the CMU resolution dated 05.21.2014. № 139 08.20.14 02.18.2015 08.19.2015 02.17.2016 08.17.2016 02.15.2017 08.16.2017 02.14.2018 08.15.2018 02.13.2019 08.14.2019 02.18.2015 08.19.2015 02.17.2016 08.17.2016 02.15.2017 08.16.2017 02.14.2018 08.15.2018 02.13.2019 08.14.2019 for each date 100 UAH 9,50 02.18.2015 year - 47,50 UAH, 08.19.2015 year - 42,75грн, 02.17.2016 year - 38,00 UAH, 08.17.2016 year - 33,25 UAH, 02.15.2017 year - 28,50 UAH, 08.16.2017 year - 23,75 UAH, 02.14.2018 year - 19,00 UAH, 08.15.2018 year - 14,25 UAH, 02.13.2019 year - 9,50 UAH, 08.14.2019 year - 4,75 UAH 954 809 63 UA4000195580 1 050 UAH 10.18.16 03.08.2017 09.06.2017 03.07.2018 09.05.2018 03.06.2019 09.04.2019 09.04.19 15,75 78,75 412 500 64 UA4000186928 1 820 UAH (T-BILLS - VAT) According to the CMU resolution dated 05.21.2014. № 139 10.06.14 04.06.2015 10.04.2015 04.04.2016 10.03.2016 04.03.2017 10.02.2017 04.02.2018 10.01.2018 04.01.2019 09.30.2019 04.06.2015 10.04.2015 04.04.2016 10.03.2016 04.03.2017 10.02.2017 04.02.2018 10.01.2018 04.01.2019 09.30.2019 for each date 100 UAH 9,50 04.06.2015 year - 47,50 UAH, 10.05.2015 year - 42,75 UAH, 04.04.2016 year - 38,00 UAH, 10.03.2016 year - 33,25 UAH, 04.03.2017 year - 28,50 UAH, 10.02.2017 year - 23,75 UAH, 04.02.2018 year - 19,00 UAH, 10.01.2018 year - 14,25 UAH, 04.01.2019 year - 9,50 UAH, 09.30.2019 year - 4,75 UAH. 125 314 65 UA4000199244 728 USD 10.24.17 04.25.2018 10.24.2018 04.24.2019 10.23.2019 10.23.19 5,40 27,00 227 954 66 UA4000200711 616 EUR 03.20.18 05.30.2018 11.28.2018 05.29.2019 11.27.2019 11.27.19 4,12 20,60 268 458 67 UA4000188551 1 820 UAH (T-BILLS - VAT) According to the CMU resolution dated 05.21.2014. № 139 12.29.14 06.29.2015 12.28.2015 06.27.2016 12.26.2016 06.26.2017 12.25.2017 06.25.2018 12.24.2018 06.24.2019 12.23.2019 06.29.2015 12.28.2015 06.27.2016 12.26.2016 06.26.2017 12.25.2017 06.25.2018 12.24.2018 06.24.2019 12.23.2019 for each date 100 UAH 9,50 06.29.2015 year - 47,50 UAH, 10.28.2015 year - 42,75 UAH, 06.27.2016 year - 38,00 UAH, 12.26.2016 year - 33,25 UAH, 06.26.2017 year - 28,50 UAH, 12.25.2017 year - 23,75 UAH, 06.25.2018 year - 19,00 UAH, 12.24.2018 year - 14,25 UAH, 06.24.2019 year - 9,50 UAH, 12.23.2019 year - 4,75 UAH 55 420 68 UA4000199913 728 UAH 01.10.18 07.11.2018 01.09.2019 07.10.2019 01.08.2020 01.08.20 15,70 78,50 36 935 69 UA4000196620 1 085 UAH 01.24.17 07.19.2017 01.17.2018 07.18.2018 01.16.2019 07.17.2019 01.15.2020 01.15.20 15,74 78,70 2 932 870 70 UA4000201396 581 USD 06.12.18 07.18.2018 01.16.2019 07.17.2019 01.15.2020 01.15.20 5,62 28,10 229 035 71 UA4000188981 1 815 UAH (capitalization) According to the CMU resolution dated 23.01.2015 № 13 02.02.15 07.29.2015 01.27.2016 07.27.2016 01.25.2017 07.26.2017 01.24.2018 07.25.2018 01.23.2019 07.24.2019 01.22.2020 01.22.20 14,50 72,50 (excluding 07.29.2015– 70,51) 2 500 000
- 5. 72 UA4000189138 1 811 UAH (capitalization) According to the CMU resolution dated 23.01.2015 № 13 02.13.15 08.05.2015 02.03.2016 08.03.2016 02.01.2017 08.02.2017 01.31.2018 08.01.2018 01.30.2019 07.31.2019 01.29.2020 01.29.20 14,50 72,50 (excluding 08.05.2015– 68,91) 2 200 000 73 UA4000189146 1 818 UAH (capitalization) According to the CMU resolution dated 23.01.2015 № 13 02.13.15 08.12.2015 02.10.2016 08.10.2016 02.08.2017 08.09.2017 02.07.2018 08.08.2018 02.06.2019 08.07.2019 02.05.2020 02.05.20 14,50 72,50 (excluding 08.12.2015– 71,70) 2 200 000 74 UA4000199491 812 USD 11.21.17 08.15.2018 02.13.2019 08.14.2019 02.12.2020 02.12.20 5,40 27,00 320 148 75 UA4000157671 2 534 UAH 03.05.13 08.21.2013 02.19.2014 08.20.2014 02.18.2015 08.19.2015 02.17.2016 08.17.2016 02.15.2017 08.16.2017 02.14.2018 08.15.2018 02.13.2019 08.14.2019 02.12.2020 02.12.20 14,30 71,50 1 763 305 76 UA4000189344 1 819 UAH (capitalization) According to the CMU resolution dated 23.01.2015 № 13 02.26.15 08.26.2015 02.24.2016 08.24.2016 02.22.2017 08.23.2017 02.21.2018 08.22.2018 02.20.2019 08.21.2019 02.19.2020 02.19.20 14,50 72,50 (excluding 08.26.2015– 72,50) 2 900 000 77 UA4000197040 1 085 UAH 03.14.17 09.06.2017 03.07.2018 09.05.2018 03.06.2019 09.04.2019 03.04.2020 03.04.20 15,28 76,40 4 178 870 78 UA4000063010 3 724 UAH (capitalization) According to the CMU resolution dated 06.10.2009 № 567 with amendments dated 12.02.2009 № 1349 12.30.09 03.24.2010 09.22.2010 03.23.2011 09.21.2011 03.21.2012 09.19.2012 03.20.2013 09.18.2013 03.19.2014 09.17.2014 03.18.2015 09.16.2015 03.19.2016 09.14.2016 03.15.2017 09.13.2017 03.14.2018 09.12.2018 03.13.2019 09.11.2019 03.11.2020 03.11.20 9,50 47,50 (excluding 03.24.2010– 21,92) 950 000 79 UA4000165773 2 541 UAH 04.23.13 10.16.2013 04.16.2014 10.15.2014 04.15.2015 10.14.2015 04.13.2016 10.12.2016 04.12.2017 10.11.2017 04.11.2018 10.10.2018 04.10.2019 10.09.2019 04.08.2020 04.08.20 14,30 71,50 20 000 80 UA4000166805 2 534 UAH 05.28.13 11.13.2013 04.14.2014 11.12.2014 05.13.2015 11.11.2015 05.11.2016 11.09.2016 05.10.2017 11.08.2017 05.09.2018 11.07.2018 05.08.2019 11.06.2019 05.06.2020 05.06.20 14,30 71,50 145 554 81 UA4000197396 1 092 USD 05.16.17 11.15.2017 05.16.2018 11.14.2018 05.15.2019 11.13.2019 05.13.2020 05.13.20 5,49 27,45 234 272
- 6. 82 UA4000198006 1 092 UAH 06.13.17 12.13.2017 06.13.2018 12.12.2018 06.12.2019 12.11.2019 06.10.2020 12.13.2017 06.13.2018 12.12.2018 06.12.2019 12.11.2019 06.10.2020 06.10.20 14,64 73,20 3 192 220 83 UA4000171094 2 548 UAH 07.16.13 01.15.2014 07.16.2014 01.14.2015 07.15.2015 01.13.2016 07.13.2016 01.11.2017 07.12.2017 01.10.2018 07.11.2018 01.09.2019 07.10.2019 01.08.2020 07.08.2020 07.08.20 14,30 71,50 57 306 84 UA4000198873 1 078 UAH 09.05.17 02.21.2018 08.22.2018 02.20.2019 08.21.2019 02.19.2020 08.19.2020 08.19.20 14,50 72,50 2 232 600 85 UA4000177950 2 542 UAH (capitalization) According to the CMU resolution dated 07.03.2015 № 469 12.10.13 06.04.2014 12.03.2014 06.03.2015 12.02.2015 06.01.2016 11.30.2016 05.31.2017 11.29.2017 05.30.2018 11.28.2018 05.29.2019 11.27.2019 05.27.2020 11.25.2020 11.25.20 9,50 47,50 (excluding 06.04.2014– 45,93) 1 400 000 86 UA4000184402 2 365 UAH (capitalization) According to the CMU resolution dated 05.29.2014 № 151 06.19.14 12.17.2014 06.17.2015 12.16.2015 06.15.2016 12.14.2016 06.14.2017 12.13.2017 06.13.2018 12.12.2018 06.12.2019 12.11.2019 06.10.2020 12.09.2020 12.09.20 14,30 71,50 (excluding 12.17.2014– 71,11) 100 87 UA4000200174 1 092 UAH 01.23.18 07.25.2018 01.23.2019 07.24.2019 01.22.2020 07.22.2020 01.20.2021 01.20.21 15,70 78,50 922 489 88 UA4000186241 2 358 UAH (capitalization) According to the CMU resolution dated 05.29.2014 № 151 08.28.14 02.18.2015 08.19.2015 02.17.2016 08.17.2016 02.15.2017 08.16.2017 02.14.2018 08.15.2018 02.13.2019 08.14.2019 02.12.2020 08.12.2020 02.10.2021 02.10.21 14,30 71,50 (excluding 02.18.2015– 68,36) 2 500 000 89 UA4000185375 2 465 UAH (capitalization) According to the CMU resolution dated 05.29.2014 № 151 07.22.14 10.29.2014 04.29.2015 10.28.2015 04.27.2016 10.26.2016 04.26.2017 10.25.2017 04.25.2018 10.24.2018 04.24.2019 10.23.2019 04.11.2020 10.21.2020 04.21.2021 04.21.21 14,30 71,50 (excluding 10.29.2014– 38,89) 1 100 000 90 UA4000185656 2 480 UAH (capitalization) According to the CMU resolution dated 05.29.2014 № 151 08.04.14 11.26.2014 05.27.2015 11.25.2015 05.25.2016 11.23.2016 05.24.2017 11.22.2017 05.23.2018 11.21.2018 05.22.2019 11.20.2019 05.20.2020 11.18.2020 05.19.2021 05.19.21 14,30 71,50 (excluding 11.26.2014– 44,79) 2 200 000 91 UA4000194377 1 813 UAH 06.14.16 12.07.2016 06.07.2017 12.06.2017 06.06.2018 12.05.2018 06.05.2019 12.04.2019 06.03.2020 12.02.2020 06.02.2021 06.02.21 16,75 83,75 2 952 891
- 7. 92 UA4000063135 4 179 UAH (capitalization) According to the CMU resolution dated 12.23.2009 № 1408 12.30.09 06.23.2010 12.22.2010 06.22.2011 12.21.2011 06.20.2012 12.19.2012 06.19.2013 12.18.2013 06.18.2014 12.17.2014 06.17.2015 12.16.2015 06.15.2016 12.14.2016 06.14.2017 12.13.2017 06.13.2018 12.12.2018 06.12.2019 12.11.2019 06.10.2020 12.09.2020 06.09.2021 06.09.21 9,50 47,50 (excluding 06.23.2010– 45,67) 1 500 000 93 UA4000194468 1 820 UAH 06.21.16 12.21.2016 06.21.2017 12.20.2017 06.20.2018 12.19.2018 06.19.2019 12.18.2019 06.17.2020 12.16.2020 06.16.2021 06.16.21 16,75 83,75 1 510 000 94 UA4000194567 1 820 UAH 07.05.16 01.04.2017 07.05.2017 01.03.2018 07.04.2018 01.02.2019 07.03.2019 01.01.2020 07.01.2020 12.30.2020 06.30.2021 06.30.21 16,65 83,25 104 850 95 UA4000186514 2 514 UAH (capitalization) According to the CMU resolution dated 05.29.2014 № 151 09.09.14 02.04.2015 08.05.2015 02.03.2016 08.03.2016 02.01.2017 08.02.2017 01.31.2018 08.01.2018 01.30.2019 07.31.2019 01.29.2020 07.29.2020 01.27.2021 07.28.2021 07.28.21 14,30 71,50 (excluding 02.04.2015– 58,14) 1 170 900 96 UA4000195176 1 806 UAH 08.30.16 02.15.2017 08.16.2017 02.14.2018 08.15.2018 02.13.2019 08.14.2019 02.12.2020 08.12.2020 02.10.2021 08.11.2021 08.11.21 16,00 80,00 40 000 97 UA4000186258 2 540 UAH (capitalization) According to the CMU resolution dated 05.29.2014 № 151 09.04.14 02.25.2015 08.26.2015 02.24.2016 08.24.2016 02.22.2017 08.23.2017 02.21.2018 08.22.2018 02.20.2019 08.21.2019 02.19.2020 08.19.2020 02.17.2021 08.18.2021 08.18.21 14,30 71,50 (excluding 02.25.2015– 68,36) 2 500 000 98 UA4000186480 2 547 UAH (capitalization) According to the CMU resolution dated 05.29.2014 № 151 09.04.14 03.04.2015 09.02.2015 03.02.2016 08.31.2016 03.01.2017 08.30.2017 02.28.2018 08.29.2018 02.27.2019 08.28.2019 02.26.2020 08.26.2020 02.24.2021 08.25.2021 08.25.21 14,30 71,50 (excluding 03.04.2015– 71,11) 1 000 000 99 UA4000129241 3 628 UAH (index)* 10.10.11 03.28.2012 09.26.2012 03.27.2013 09.25.2013 03.26.2014 09.24.2014 03.25.2015 09.23.2015 03.23.2016 09.21.2016 03.22.2017 09.20.2017 03.21.2018 09.19.2018 03.20.2019 09.18.2019 03.18.2020 09.16.2020 03.17.2021 09.15.2021 09.15.2021 *nominal value indexation will be determined on the maturity date 9,25 46,25 1 000 000
- 8. 100 UA4000185821 2 717 UAH (capitalization) According to the CMU resolution dated 08.04.2014 № 302 08.12.14 01.28.2015 07.29.2015 01.27.2016 07.27.2016 01.25.2017 07.26.2017 01.24.2018 07.25.2018 01.23.2019 07.24.2019 01.22.2020 07.22.2020 01.20.2021 07.21.2021 01.19.2022 01.19.22 14,10 70,50 (excluding 01.28.2015– 65,46) 2 500 000 101 UA4000063143 4 536 UAH (capitalization) According to the CMU resolution dated 12.23.2009 № 1408 12.30.09 06.16.2010 12.15.2010 06.15.2011 12.14.2011 06.13.2012 12.12.2012 06.12.2013 12.11.2013 06.11.2014 12.10.2014 06.10.2015 12.09.2015 06.08.2016 12.07.2016 06.07.2017 12.06.2017 06.06.2018 12.05.2018 06.05.2019 12.04.2019 06.03.2020 12.02.2020 06.02.2021 12.01.2021 06.01.2022 06.01.22 9,50 47,50 (excluding 06.16.2010– 43,85) 1 500 000 102 UA4000185839 2 878 UAH (capitalization) According to the CMU resolution dated 08.04.2014 № 302 08.12.14 01.07.2015 07.08.2015 01.06.2016 07.06.2016 01.04.2017 07.05.2017 01.03.2018 07.04.2018 01.02.2019 07.03.2019 01.01.2020 07.01.2020 12.30.2020 06.30.2021 12.29.2021 06.29.2022 06.29.22 14,10 70,50 (excluding 01.07.2015– 57,33) 2 500 000 103 UA4000185847 2 892 UAH (capitalization) According to the CMU resolution dated 08.04.2014 № 302 08.12.14 01.21.2015 07.22.2015 01.20.2016 07.20.2016 01.18.2017 07.19.2017 01.17.2018 07.18.2018 01.16.2019 07.17.2019 01.15.2020 07.15.2020 01.13.2021 07.14.2021 01.12.2022 07.13.2022 07.13.22 14,10 70,50 (excluding 01.21.2015– 62,75) 2 500 000 104 UA4000185854 2 906 UAH (capitalization) According to the CMU resolution dated 08.04.2014 № 302 08.12.14 02.04.2015 08.02.2015 02.03.2016 08.03.2016 02.01.2017 08.02.2017 01.31.2018 08.01.2018 01.30.2019 07.31.2019 01.29.2020 07.29.2020 01.27.2021 07.28.2021 01.26.2022 07.27.2022 07.27.22 14,10 70,50 (excluding 02.04.2015– 68,18) 2 500 000 105 UA4000199210 1 820 UAH 10.17.17 04.18.2018 10.17.2018 04.17.2019 10.16.2019 04.15.2020 10.14.2020 04.14.2021 10.13.2021 04.13.2022 10.12.2022 10.12.22 14,91 74,55 2 945 567 106 UA4000185870 3 088 UAH (capitalization) According to the CMU resolution dated 08.04.2014 № 302 08.12.14 02.04.2015 08.05.2015 02.03.2016 08.03.2016 02.01.2017 08.02.2017 01.31.2018 08.01.2018 01.30.2019 07.31.2019 01.29.2020 07.29.2020 01.27.2021 07.28.2021 01.26.2022 07.27.2022 01.25.2023 01.25.23 13,30 66,50 (excluding 02.04.2015– 64,31) 2 500 000
- 9. 107 UA4000186555 3 067 UAH (capitalization) According to the CMU resolution dated 05.29.2014 № 151 09.09.14 02.11.2015 08.12.2015 02.10.2016 08.10.2016 02.08.2017 08.09.2017 02.07.2018 08.08.2018 02.06.2019 08.07.2019 02.05.2020 08.05.2020 02.03.2021 08.04.2021 02.02.2022 08.03.2022 02.01.2023 02.01.23 13,30 66,50 (excluding 02.11.2015– 56,63) 2 500 000 108 UA4000186548 3 088 UAH (capitalization) According to the CMU resolution dated 05.29.2014 № 151 09.09.14 03.04.2015 09.02.2015 03.02.2016 08.31.2016 03.01.2017 08.30.2017 02.28.2018 08.29.2018 02.27.2019 08.28.2019 02.26.2020 08.26.2020 02.24.2021 08.25.2021 02.23.2022 08.24.2022 02.22.2023 02.22.23 13,30 66,50 (excluding 11.05.2014– 64,31) 2 500 000 109 UA4000200885 1 820 UAH 04.24.18 24.10.2018 24.04.2019 23.10.2019 22.04.2020 21.10.2020 21.04.2021 20.10.2021 20.04.2022 19.10.2022 19.04.2023 04.19.23 15,97 79,85 646 414 110 UA4000185888 3 179 UAH (capitalization) According to the CMU resolution dated 08.04.2014 № 302 08.12.14 11.05.2014 05.06.2015 11.04.2015 05.04.2016 11.02.2016 05.03.2017 11.01.2017 05.02.2018 10.31.2018 05.01.2019 10.30.2019 04.29.2020 10.28.2020 04.28.2021 10.27.2021 04.27.2022 10.26.2022 04.26.2023 04.26.23 13,30 66,50 (excluding 11.05.2014– 31,06) 2 500 000 111 UA4000201255 1 820 UAH 05.29.18 11.28.2018 05.29.2019 11.27.2019 05.27.2020 11.25.2020 05.26.2021 11.24.2021 05.25.2022 11.23.2022 05.24.2023 05.24.23 16,00 80,00 30 000 112 UA4000186530 3 214 UAH (capitalization) According to the CMU resolution dated 05.29.2014 № 151 09.09.14 01.07.2015 07.08.2015 01.06.2016 07.06.2016 01.04.2017 07.05.2017 01.03.2018 07.04.2018 01.02.2019 07.03.2019 01.01.2020 07.01.2020 12.30.2020 06.30.2021 12.29.2021 06.29.2022 12.28.2022 06.28.2023 06.28.23 13,30 66,50 (excluding 01.07.2015– 43,85) 2 500 000 113 UA4000195150 2 528 UAH (index)* 08.23.16 02.01.2017 08.02.2017 01.31.2018 08.01.2018 01.30.2019 07.31.2019 01.29.2020 07.29.2020 01.27.2021 07.28.2021 01.26.2022 07.27.2022 01.25.2023 07.26.2023 07.26.2023 *nominal value indexation will be determined on the maturity date 6,50 32,50 2 700 000 114 UA4000195044 2 541 UAH (index)* 08.17.16 02.08.2017 08.09.2017 02.07.2018 08.08.2018 02.06.2019 08.07.2019 02.05.2020 08.05.2020 02.03.2021 08.04.2021 02.02.2022 08.03.2022 02.01.2023 08.02.2023 08.02.2023 *nominal value indexation will be determined on the maturity date 6,50 32,50 1 000 000
- 10. 115 UA4000173371 3 640 UAH 09.03.13 03.05.2014 09.03.2014 03.04.2015 09.02.2015 03.02.2016 08.31.2016 03.01.2017 08.30.2017 02.28.2018 08.29.2018 02.27.2019 08.28.2019 02.26.2020 08.26.2020 02.24.2021 08.25.2021 02.23.2022 08.24.2022 02.22.2023 08.23.2023 08.23.23 10,00 50,00 330 000 116 UA4000195507 2 548 UAH (index)* 09.20.16 03.29.2017 09.27.2017 03.28.2018 09.26.2018 03.27.2019 09.25.2019 03.25.2020 09.23.2020 03.24.2021 09.22.2021 03.23.2022 09.21.2022 03.22.2023 09.20.2023 09.20.2023 *nominal value indexation will be determined on the maturity date 6,50 32,50 5 000 000 117 UA4000185771 3 445 UAH (capitalization) According to the CMU resolution dated 08.04.2014 № 302 08.12.14 01.28.2015 07.29.2015 01.27.2016 07.27.2016 01.25.2017 07.26.2017 01.24.2018 07.25.2018 01.23.2019 07.24.2019 01.22.2020 07.22.2020 01.20.2021 07.21.2021 01.19.2022 07.20.2022 01.18.2023 07.19.2023 01.17.2024 01.17.24 12,50 62,50 (excluding 01.28.2015– 58,04) 2 500 000 118 UA4000186605 3 438 UAH (capitalization) According to the CMU resolution dated 05.29.2014 № 151 09.09.14 02.18.2015 08.19.2015 02.17.2016 08.17.2016 02.15.2017 08.16.2017 02.14.2018 08.15.2018 02.13.2019 08.14.2019 02.12.2020 08.12.2020 02.10.2021 08.11.2021 02.09.2022 08.10.2022 02.08.2023 08.09.2023 02.07.2024 02.07.24 12,50 62,50 (excluding 02.18.2015– 55,63) 2 500 000 119 UA4000186597 3 452 UAH (capitalization) According to the CMU resolution dated 05.29.2014 № 151 09.09.14 03.04.2015 09.02.2015 03.02.2016 08.31.2016 03.01.2017 08.30.2017 02.28.2018 08.29.2018 02.27.2019 08.28.2019 02.26.2020 08.26.2020 02.24.2021 08.25.2021 02.23.2022 08.24.2022 02.22.2023 08.23.2023 02.21.2024 02.21.24 12,50 62,50 (excluding 03.04.2015– 60,44) 2 500 000 120 UA4000185920 3 515 UAH (capitalization) According to the CMU resolution dated 08.04.2014 № 302 08.12.14 10.08.2014 04.08.2015 10.07.2015 04.06.2016 10.05.2016 04.05.2017 10.04.2017 04.04.2018 10.03.2018 04.03.2019 10.02.2019 04.01.2020 09.30.2020 03.31.2021 09.29.2021 03.30.2022 09.28.2022 03.29.2023 09.27.2023 03.27.2024 03.27.24 12,50 62,50 (excluding 10.08.2014– 19,57) 2 000 000
- 11. 121 UA4000185789 3 543 UAH (capitalization) According to the CMU resolution dated 08.04.2014 № 302 08.12.14 11.05.2014 05.06.2015 11.04.2015 05.04.2016 11.02.2016 05.03.2017 11.01.2017 05.02.2018 10.31.2018 05.01.2019 10.30.2019 04.29.2020 10.28.2020 04.28.2021 10.27.2021 04.27.2022 10.26.2022 04.26.2023 10.25.2023 04.24.2024 04.24.24 12,50 62,50 (excluding 11.05.2014– 29,19) 2 500 000 122 UA4000186894 3 626 UAH 10.01.14 03.18.2015 09.16.2015 03.16.2016 09.14.2016 03.15.2017 09.13.2017 03.14.2018 09.12.2018 03.13.2019 09.11.2019 03.11.2020 09.09.2020 03.10.2021 09.08.2021 03.09.2022 09.07.2022 03.08.2023 09.06.2023 03.06.2024 09.04.2024 09.04.24 15,50 77,50 310 000 123 UA4000186803 3 638 UAH 09.24.14 03.25.2015 09.23.2015 03.23.2016 09.21.2016 03.22.2017 09.20.2017 03.21.2018 09.19.2018 03.20.2019 09.18.2019 03.18.2020 09.16.2020 03.17.2021 09.15.2021 03.16.2022 09.14.2022 03.15.2023 09.13.2023 03.13.2024 09.11.2024 09.11.24 15,50 77,50 (excluding 03.25.2015– 76,65) 930 000 124 UA4000188213 3 575 UAH (index)* (capitalization) According to the CMU resolution dated 11.19.2014 № 633 12.05.14 04.01.2015 09.30.2015 03.30.2016 09.28.2016 03.29.2017 09.27.2017 03.28.2018 09.26.2018 03.27.2019 09.25.2019 03.25.2020 09.23.2020 03.24.2021 09.22.2021 03.23.2022 09.21.2022 03.22.2023 09.20.2023 03.20.2024 09.18.2024 09.18.2024 *nominal value indexation will be determined on the maturity date 6,00 30,00 (excluding 04.01.2015– 19,29) 2 899 710 125 UA4000187207 3 633 UAH 10.22.14 04.15.2015 10.14.2015 04.13.2016 10.12.2016 04.12.2017 10.11.2017 04.11.2018 10.10.2018 04.10.2019 10.09.2019 04.08.2020 10.07.2020 04.07.2021 10.06.2021 04.06.2022 10.05.2022 04.05.2023 10.04.2023 04.03.2024 10.02.2024 10.02.24 15,50 77,50 1 000 000 126 UA4000188221 3 610 UAH (index)* (capitalization) According to the CMU resolution dated 11.19.2014 № 633 12.05.14 05.06.2015 11.04.2015 05.04.2016 11.02.2016 05.03.2017 11.01.2017 05.02.2018 10.31.2018 05.01.2019 10.30.2019 04.29.2020 10.28.2020 04.28.2021 10.27.2021 04.27.2022 10.26.2022 04.26.2023 10.25.2023 04.24.2024 10.23.2024 10.23.2024 *nominal value indexation will be determined on the maturity date 6,00 30,00 (excluding 05.06.2015– 25,05) 2 899 710
- 12. 127 UA4000188239 3 624 UAH (index)* (capitalization) According to the CMU resolution dated 11.19.2014 № 633 12.05.14 05.20.2015 11.18.2015 05.18.2016 11.16.2016 05.17.2017 11.15.2017 05.16.2018 11.14.2018 05.15.2019 11.13.2019 05.13.2020 11.11.2020 05.12.2021 11.10.2021 05.11.2022 11.09.2022 05.10.2023 11.08.2023 05.08.2024 11.06.2024 11.06.2024 *nominal value indexation will be determined on the maturity date 6,00 30,00 (excluding 05.20.2015– 27,36) 2 899 710 128 UA4000188247 3 638 UAH (index)* (capitalization) According to the CMU resolution dated 11.19.2014 № 633 12.05.14 06.03.2015 12.02.2015 06.01.2016 11.30.2016 05.31.2017 11.29.2017 05.30.2018 11.28.2018 05.29.2019 11.27.2019 05.27.2020 11.25.2020 05.26.2021 11.24.2021 05.25.2022 11.23.2022 05.24.2023 11.22.2023 05.22.2024 11.20.2024 11.20.2024 *nominal value indexation will be determined on the maturity date 6,00 30,00 (excluding 06.03.2015– 29,67) 2 899 710 129 UA4000188585 3 627 UAH (capitalization) According to the CMU resolution dated 12.29.2014 № 713 12.30.14 06.17.2015 12.16.2015 06.15.2016 12.14.2016 06.14.2017 12.13.2017 06.13.2018 12.12.2018 06.12.2019 12.11.2019 09.10.2020 12.09.2020 06.09.2021 12.08.2021 06.08.2022 12.07.2022 06.07.2023 12.06.2023 06.05.2024 12.04.2024 12.04.24 9,50 47,50 (excluding 06.17.2015– 44,11) 2 500 000 130 UA4000188593 3 634 UAH (capitalization) According to the CMU resolution dated 12.29.2014 № 713 12.30.14 06.24.2015 12.23.2015 06.22.2016 12.21.2016 06.21.2017 12.20.2017 06.20.2018 12.19.2018 06.19.2019 12.18.2019 06.17.2020 12.16.2020 06.16.2021 12.15.2021 06.15.2022 12.14.2022 06.14.2023 12.13.2023 06.12.2024 12.11.2024 12.11.24 9,50 47,50 (excluding 06.24.2015– 45,93) 2 500 000 131 UA4000189591 3 640 UAH (capitalization) According to the CMU resolution dated 03.18.2015 № 115 04.01.15 09.30.2015 03.30.2016 09.28.2016 03.29.2017 09.27.2017 03.28.2018 09.26.2018 03.27.2019 09.25.2019 03.25.2020 09.23.2020 03.24.2021 09.22.2021 03.23.2022 09.21.2022 03.11.2023 09.20.2023 03.20.2024 09.18.2024 03.19.2025 03.19.25 9,50 47,50 3 203 998 132 UA4000189872 3 633 UAH (capitalization) According to the CMU resolution dated 04.04.2015 № 156 05.06.15 10.28.2015 04.27.2016 10.26.2016 04.26.2017 10.25.2017 04.25.2018 10.24.2018 04.24.2019 10.23.2019 04.22.2020 10.21.2020 04.21.2021 10.20.2021 04.20.2022 10.19.2022 04.19.2023 10.18.2023 04.17.2024 10.16.2024 04.16.2025 04.16.25 11,97 59,85 (excluding 10.28.2015– 57,55) 1 600 000
- 13. 133 UA4000197529 2 773 UAH According to the CMU resolution dated 10.04.2017. № 748 10.06.17 11.18.2017 05.19.2018 11.17.2018 05.18.2019 11.16.2019 05.16.2020 11.14.2020 05.15.2021 11.13.2021 05.14.2022 11.12.2022 05.13.2023 11.11.2023 05.11.2024 11.09.2024 05.10.2025 05.10.25 11,30 56,50 (excluding 11.18.2017– 13,35) 2 500 000 134 UA4000190649 3 640 UAH (capitalization) According to the CMU resolution dated 06.15.2015 № 384 07.29.15 01.27.2016 07.27.2016 01.25.2017 07.26.2017 01.24.2018 07.25.2018 01.23.2019 07.24.2019 01.22.2020 07.22.2020 01.20.2021 07.21.2021 01.19.2022 07.20.2022 01.18.2023 07.19.2023 01.17.2024 07.17.2024 01.15.2025 07.16.2025 07.16.25 9,50 47,50 633 000 135 UA4000189708 3 760 UAH (capitalization) According to the CMU resolution dated 04.04.2015 № 156 04.14.15 08.12.2015 02.10.2016 08.10.2016 02.08.2017 08.09.2017 02.07.2018 08.08.2018 02.06.2019 08.07.2019 02.05.2020 08.05.2020 02.03.2021 08.04.2021 02.02.2022 08.03.2022 02.01.2023 08.02.2023 01.31.2024 07.31.2024 01.29.2025 07.30.2025 07.30.25 11,72 58,60 (excluding 08.12.2015– 38,64) 1 500 000 136 UA4000189963 3 788 UAH (capitalization) According to the CMU resolution dated 04.04.2015 № 156 05.26.15 10.21.2015 04.20.2016 10.19.2016 04.19.2017 10.18.2017 04.18.2018 10.17.2018 04.17.2019 10.16.2019 04.15.2020 10.14.2020 04.14.2021 10.13.2021 04.13.2022 10.12.2022 04.12.2023 10.11.2023 04.10.2024 10.09.2024 04.09.2025 10.08.2025 10.08.25 11,90 59,50 (excluding 10.21.2015– 48,38) 2 200 000 137 UA4000192702 3 561 UAH (index)* (capitalization) According to the CMU resolution dated 01.27.2016 № 31 01.29.16 05.11.2016 11.09.2016 05.10.2017 11.08.2017 05.09.2018 11.07.2018 05.08.2019 11.06.2019 05.06.2020 11.04.2020 05.05.2021 11.03.2021 05.04.2022 11.02.2022 05.03.2023 11.01.2023 05.01.2024 10.30.2024 04.30.2025 10.29.2025 10.29.2025 *nominal value indexation will be determined on the maturity date 6,00 30,00 (excluding 05.11.2016– 16,98) 2 500 000 138 UA4000197537 2 957 UAH According to the CMU resolution dated 10.04.2017. № 748 10.06.17 11.20.2017 05.21.2018 11.19.2018 05.20.2019 11.18.2019 05.18.2020 11.16.2020 05.17.2021 11.15.2021 05.16.2022 11.14.2022 05.15.2023 11.13.2023 05.13.2024 11.11.2024 05.12.2025 11.10.2025 11.10.25 11,29 56,45 (excluding 10.20.2017– 13,96) 2 500 000
- 14. 139 UA4000192710 3 575 UAH (index)* (capitalization) According to the CMU resolution dated 01.27.2016 № 31 01.29.16 05.25.2016 11.23.2016 05.24.2017 11.22.2017 05.23.2018 11.21.2018 05.22.2019 11.20.2019 05.20.2020 11.18.2020 05.19.2021 11.17.2021 05.18.2022 11.16.2022 05.17.2023 11.15.2023 05.15.2024 11.13.2024 05.14.2025 11.12.2025 11.12.2025 *nominal value indexation will be determined on the maturity date 6,00 30,00 (excluding 05.25.2016– 19,29) 2 455 520 140 UA4000192678 3 589 UAH (index)* (capitalization) According to the CMU resolution dated 01.27.2016 № 33 01.29.16 06.08.2016 12.07.2016 06.07.2017 12.06.2017 06.06.2018 12.05.2018 06.05.2019 12.04.2019 06.03.2020 12.02.2020 06.02.2021 12.01.2021 06.01.2022 11.30.2022 05.31.2023 11.29.2023 05.29.2024 11.27.2024 05.28.2025 11.26.2025 11.26.2025 *nominal value indexation will be determined on the maturity date 6,00 30,00 (excluding 06.08.2016– 21,59) 3 000 000 141 UA4000189799 3 879 UAH (capitalization) According to the CMU resolution dated 04.04.2015 № 156 04.28.15 06.24.2015 12.23.2015 06.22.2016 12.21.2016 06.21.2017 12.20.2017 06.20.2018 12.19.2018 06.19.2019 12.18.2019 06.17.2020 12.16.2020 06.16.2021 12.15.2021 06.15.2022 12.14.2022 06.14.2023 12.13.2023 06.12.2024 12.11.2024 06.11.2025 12.10.2025 12.10.25 11,54 57,70 (excluding 06.24.2015– 18,07) 1 800 000 142 UA4000192686 3 617 UAH (index)* (capitalization) According to the CMU resolution dated 01.27.2016 № 33 01.29.16 07.06.2016 01.04.2017 07.05.2017 01.03.2018 07.04.2018 01.02.2019 07.03.2019 01.01.2020 07.01.2020 12.30.2020 06.30.2021 12.29.2021 06.29.2022 12.28.2022 06.28.2023 12.27.2023 06.26.2024 12.25.2024 06.25.2025 12.24.2025 12.24.2025 *nominal value indexation will be determined on the maturity date 6,00 30,00 (excluding 07.06.2016– 26,21) 3 000 000 143 UA4000192694 3 638 UAH (index)* (capitalization) According to the CMU resolution dated 01.27.2016 № 33 01.29.16 07.27.2016 01.25.2017 07.26.2017 01.24.2018 07.25.2018 01.23.2019 07.24.2019 01.22.2020 07.22.2020 01.20.2021 07.21.2021 01.19.2022 07.20.2022 01.18.2023 07.19.2023 01.17.2024 07.17.2024 01.15.2025 07.16.2025 01.14.2026 01.14.2026 *nominal value indexation will be determined on the maturity date 6,00 30,00 (excluding 07.27.2016– 29,67) 3 319 000
- 15. 144 UA4000190102 3 942 UAH (capitalization) According to the CMU resolution dated 04.04.2015 № 156 06.09.15 10.07.2015 04.06.2016 10.05.2016 04.05.2017 10.04.2017 04.04.2018 10.03.2018 04.03.2019 10.02.2019 04.01.2020 09.30.2020 03.31.2021 09.29.2021 03.30.2022 09.28.2022 03.29.2023 09.27.2023 03.27.2024 09.25.2024 03.26.2025 09.24.2025 03.25.2026 03.25.26 11,80 59,00 (excluding 10.07.2015– 38,90) 2 500 000 145 UA4000190276 3 963 UAH (capitalization) According to the CMU resolution dated 04.04.2015 № 156 06.16.15 11.04.2015 05.04.2016 11.02.2016 05.03.2017 11.01.2017 05.02.2018 10.31.2018 05.01.2019 10.30.2019 04.29.2020 10.28.2020 04.28.2021 10.27.2021 04.27.2022 10.26.2022 04.26.2023 10.25.2023 04.24.2024 10.23.2024 04.23.2025 10.22.2025 04.22.2026 04.22.26 11,79 58,95 (excluding 11.04.2015– 45,67) 2 500 000 146 UA4000190383 3 956 UAH (capitalization) According to the CMU resolution dated 04.04.2015 № 156 07.07.15 11.18.2015 04.18.2016 11.16.2016 05.17.2017 11.15.2017 05.16.2018 11.14.2018 05.15.2019 11.13.2019 05.13.2020 11.11.2020 05.12.2021 11.10.2021 05.11.2022 11.09.2022 05.10.2023 11.08.2023 05.08.2024 11.06.2024 05.07.2025 11.05.2025 05.06.2026 05.06.26 11,89 59,45 (excluding 11.18.2015– 43,77) 500 000 147 UA4000190284 3 991 UAH (capitalization) According to the CMU resolution dated 04.04.2015 № 156 06.23.15 12.09.2015 06.08.2016 12.07.2016 06.07.2017 12.06.2017 06.06.2018 12.05.2018 06.05.2019 12.04.2019 06.03.2020 12.02.2020 06.02.2021 12.01.2021 06.01.2022 11.30.2022 05.31.2023 11.29.2023 05.29.2024 11.27.2024 05.28.2025 11.26.2025 05.27.2026 05.27.26 11,78 58,90 (excluding 12.09.2015– 54,69) 1 200 000 148 UA4000190334 3 991 UAH (capitalization) According to the CMU resolution dated 04.04.2015 № 156 06.30.15 12.16.2015 06.15.2016 12.14.2016 06.14.2017 12.13.2017 06.13.2018 12.12.2018 06.12.2019 12.11.2019 06.10.2020 12.09.2020 06.09.2021 12.08.2021 06.08.2022 12.07.2022 06.07.2023 12.06.2023 06.05.2024 12.04.2024 06.04.2025 12.03.2025 06.03.2026 06.03.26 11,78 58,90 (excluding 12.16.2015– 54,69) 1 500 000
- 16. 149 UA4000190870 3 977 UAH (capitalization) According to the CMU resolution dated 04.04.2015 № 156 08.04.15 01.06.2016 07.06.2016 01.04.2017 07.05.2017 01.03.2018 07.04.2018 01.02.2019 07.03.2019 01.01.2020 07.01.2020 12.30.2020 06.30.2021 12.29.2021 06.29.2022 12.28.2022 06.28.2023 12.27.2023 06.26.2024 12.25.2024 06.25.2025 12.24.2025 06.24.2026 06.24.26 11,94 59,70 (excluding 01.06.2016– 50,84) 500 000 150 UA4000190441 4 110 UAH (capitalization) According to the CMU resolution dated 04.04.2015 № 156 07.14.15 10.28.2015 04.27.2016 10.26.2016 04.26.2017 10.25.2017 04.25.2018 10.24.2018 04.24.2019 10.23.2019 04.22.2020 10.21.2020 04.21.2021 10.20.2021 04.20.2022 10.19.2022 04.19.2023 10.18.2023 04.17.2024 10.16.2024 04.16.2025 10.15.2025 04.15.2026 10.14.2026 10.14.26 11,83 59,15 (excluding 10.28.2015– 34,45) 1 000 000 151 UA4000190573 4 138 UAH (capitalization) According to the CMU resolution dated 04.04.2015 № 156 07.28.15 12.09.2015 06.08.2016 12.07.2016 06.07.2017 12.06.2017 06.06.2018 12.05.2018 06.05.2019 12.04.2019 06.03.2020 12.02.2020 06.02.2021 12.01.2021 06.01.2022 11.30.2022 05.31.2023 11.29.2023 05.29.2024 11.27.2024 05.28.2025 11.26.2025 05.27.2026 11.25.2026 11.25.26 11,82 59,10 (excluding 12.09.2015– 43,51) 1 200 000 152 UA4000191019 4 131 UAH (capitalization) According to the CMU resolution dated 04.04.2015 № 156 08.18.15 12.23.2015 06.22.2016 12.21.2016 06.21.2017 12.20.2017 06.20.2018 12.19.2018 06.19.2019 12.18.2019 06.17.2020 12.16.2020 06.16.2021 12.15.2021 06.15.2022 12.14.2022 06.14.2023 12.13.2023 06.12.2024 12.11.2024 06.11.2025 11.10.2025 06.10.2026 12.09.2026 12.09.26 11,88 59,40 (excluding 12.23.2015– 41,45) 1 200 000 153 UA4000196745 3 603 UAH (index)* (capitalization) According to the CMU resolution dated 02.01.2017 № 54 02.10.17 07.05.2017 01.03.2018 07.04.2018 01.02.2019 07.03.2019 01.01.2020 07.01.2020 12.30.2020 06.30.2021 12.29.2021 06.29.2022 12.28.2022 06.28.2023 12.27.2023 06.26.2024 12.25.2024 06.25.2025 12.24.2025 06.24.2026 12.23.2026 12.23.2026 *nominal value indexation will be determined on the maturity date 6,00 30,00 (excluding 07.05.2015– 23,90) 3 022 001
- 17. 154 UA4000190961 4 166 UAH (capitalization) According to the CMU resolution dated 04.04.2015 № 156 08.11.15 01.20.2016 07.20.2016 01.18.2017 07.19.2017 01.17.2018 07.18.2018 01.16.2019 07.17.2019 01.15.2020 07.15.2020 01.13.2021 07.14.2021 01.12.2022 07.13.2022 01.11.2023 07.12.2023 01.10.2024 07.10.2024 01.08.2025 07.09.2025 01.07.2026 07.08.2026 01.06.2027 01.06.27 11,87 59,35 (excluding 01.20.2016– 52,83) 800 000 155 UA4000196752 3 634 UAH (index)* (capitalization) According to the CMU resolution dated 02.01.2017 № 55 02.14.17 08.09.2017 02.07.2018 08.08.2018 02.06.2019 08.07.2019 02.05.2020 08.05.2020 02.03.2021 08.04.2021 02.02.2022 08.03.2022 02.01.2023 08.02.2023 01.31.2024 07.31.2024 01.29.2025 07.30.2025 01.28.2026 07.29.2026 01.27.2027 01.27.2027 *nominal value indexation will be determined on the maturity date 6,00 30,00 (excluding 08.09.2017– 29,01) 3 464 920 156 UA4000197545 3 503 UAH According to the CMU resolution dated 10.04.2017. № 748 10.06.17 11.20.2017 05.21.2018 11.19.2018 05.20.2019 11.18.2019 05.18.2020 11.16.2020 05.17.2021 11.15.2021 05.16.2022 11.14.2022 05.15.2023 11.13.2023 05.13.2024 11.11.2024 05.12.2025 11.10.2025 05.11.2026 11.09.2026 05.10.2027 05.10.27 10,57 52,85 (excluding 08.09.2017– 13,07) 5 500 000 157 UA4000199822 3 571 UAH (capitalization) According to the CMU resolution dated 06.23.2017 № 443 12.26.17 04.12.2018 10.17.2018 04.17.2019 10.16.2019 04.15.2020 10.14.2020 04.14.2021 10.13.2021 04.13.2022 10.12.2022 04.12.2023 10.11.2023 04.10.2024 10.09.2024 04.09.2025 10.08.2025 04.08.2026 10.07.2026 04.07.2027 10.06.2027 10.06.27 9,70 48,50 (excluding 04.18.2018– 30,11) 4 065 000 158 UA4000197552 3 687 UAH According to the CMU resolution dated 10.04.2017. № 748 10.06.17 11.22.2017 05.23.2018 11.21.2018 05.22.2019 11.20.2019 05.20.2020 11.18.2020 05.19.2021 11.17.2021 05.18.2022 11.16.2022 05.17.2023 11.15.2023 05.15.2024 11.13.2024 05.14.2025 11.12.2025 11.13.2026 11.11.2026 05.12.2027 11.10.2027 11.10.27 10,36 51,80 (excluding 08.09.2017– 13,38) 5 500 000
- 18. 159 UA4000199798 3 634 UAH (capitalization) According to the CMU resolution dated 06.23.2017 № 443 12.26.17 06.20.2018 12.19.2018 06.19.2019 12.18.2019 06.17.2020 12.16.2020 06.16.2021 12.15.2021 06.15.2022 12.14.2022 06.14.2023 12.13.2023 06.12.2024 12.11.2024 06.11.2025 12.10.2025 06.10.2026 12.09.2026 06.09.2027 12.08.2027 12.08.27 9,70 48,50 (excluding 06.20.2018– 46,90) 4 000 000 160 UA4000191399 4 509 UAH (capitalization) According to the CMU resolution dated 09.08.2015 № 701 09.29.15 02.17.2016 08.17.2016 02.15.2017 08.16.2017 02.14.2018 08.15.2018 02.13.2019 08.14.2019 02.12.2020 08.12.2020 02.10.2021 08.11.2021 02.09.2022 08.10.2022 02.08.2023 08.09.2023 02.07.2024 08.07.2024 02.05.2025 08.06.2025 02.04.2026 08.05.2026 02.03.2027 08.04.2027 02.02.2028 02.02.28 11,58 57,90 (excluding 02.17.2016– 44,86) 2 500 000 161 UA4000191407 4 537 UAH (capitalization) According to the CMU resolution dated 09.08.2015 № 701 09.29.15 03.16.2016 09.14.2016 03.15.2017 09.13.2017 03.14.2018 09.12.2018 03.13.2019 09.11.2019 03.11.2020 09.09.2020 03.10.2021 09.08.2021 03.09.2022 09.07.2022 03.08.2023 09.06.2023 03.06.2024 09.04.2024 03.05.2025 09.03.2025 03.04.2026 09.02.2026 03.03.2027 09.01.2027 03.01.2028 03.01.28 11,57 57,85 (excluding 03.16.2016– 53,72) 2 500 000 162 UA4000192132 4 509 UAH (capitalization) According to the CMU resolution dated 09.08.2015 № 701 11.24.15 04.13.2016 10.12.2016 04.12.2017 10.11.2017 04.11.2018 10.10.2018 04.10.2019 10.09.2019 04.08.2020 10.07.2020 04.07.2021 10.06.2021 04.06.2022 10.05.2022 04.05.2023 10.04.2023 04.03.2024 10.02.2024 04.02.2025 10.01.2025 04.01.2026 09.30.2026 03.31.2027 09.29.2027 03.29.2028 03.29.28 11,11 55,55 (excluding 04.13.2016– 43,04) 2 000 000 163 UA4000192355 4 516 UAH (capitalization) According to the CMU resolution dated 09.08.2015 № 701 12.15.15 05.11.2016 11.09.2016 05.10.2017 11.08.2017 05.09.2018 11.07.2018 05.08.2019 11.06.2019 05.06.2020 11.04.2020 05.05.2021 11.03.2021 05.04.2022 11.02.2022 05.03.2023 11.01.2023 05.01.2024 10.30.2024 04.30.2025 10.29.2025 04.29.2026 10.28.2026 04.28.2027 10.27.2027 04.26.2028 04.26.28 10,71 53,55 (excluding 05.11.2016– 43,55) 4 000 000
- 19. 164 UA4000199806 3 816 UAH (capitalization) According to the CMU resolution dated 06.23.2017 № 443 12.26.17 06.20.2018 12.19.2018 06.19.2019 12.18.2019 06.17.2020 12.16.2020 06.16.2021 12.15.2021 06.15.2022 12.14.2022 06.14.2023 12.13.2023 06.12.2024 12.11.2024 06.11.2025 12.10.2025 06.10.2026 12.09.2026 06.09.2027 12.08.2027 06.07.2028 06.07.28 9,70 48,50 (excluding 06.20.2018– 46,90) 4 000 000 165 UA4000196331 4 276 UAH (index)* (capitalization) According to the CMU resolution dated 12.18.2016 № 961 12.29.16 03.29.2017 09.27.2017 03.28.2018 09.06.2018 03.27.2019 09.25.2019 03.25.2020 09.23.2020 03.24.2021 09.22.2021 03.23.2022 09.21.2022 03.22.2023 09.20.2023 03.20.2024 09.18.2024 03.19.2025 09.17.2025 03.18.2026 09.16.2026 03.17.2027 09.15.2027 03.15.2028 09.13.2028 09.13.2028 *nominal value indexation will be determined on the maturity date 6,00 30,00 (excluding 03.29.2017– 14,84) 4 000 000 166 UA4000196349 4 304 UAH (index)* (capitalization) According to the CMU resolution dated 12.18.2016 № 961 12.29.16 04.26.2017 10.25.2017 04.25.2018 10.24.2018 04.24.2019 10.23.2019 04.22.2020 10.21.2020 04.21.2021 10.20.2021 04.20.2022 10.19.2022 04.19.2023 10.18.2023 04.17.2024 10.16.2024 04.16.2025 10.15.2025 04.15.2026 10.14.2026 04.14.2027 10.13.2027 04.12.2028 10.11.2028 10.11.2028 *nominal value indexation will be determined on the maturity date 6,00 30,00 (excluding 04.26.2017– 19,45) 4 000 000 167 UA4000196356 4 346 UAH (index)* (capitalization) According to the CMU resolution dated 12.18.2016 № 961 12.29.16 06.07.2017 12.06.2017 06.06.2018 12.05.2018 06.05.2019 12.04.2019 06.03.2020 12.02.2020 06.02.2021 12.01.2021 06.01.2022 11.30.2022 05.31.2023 11.29.2023 05.29.2024 11.27.2024 05.28.2025 11.26.2025 05.27.2026 11.25.2026 05.26.2027 11.24.2027 05.24.2028 11.22.2028 11.22.2028 *nominal value indexation will be determined on the maturity date 6,00 30,00 (excluding 06.07.2017– 26,37) 4 000 000 168 UA4000199814 3 998 UAH (capitalization) According to the CMU resolution dated 06.23.2017 № 443 12.26.17 06.20.2018 12.19.2018 06.19.2019 12.18.2019 06.17.2020 12.16.2020 06.16.2021 12.15.2021 06.15.2022 12.14.2022 06.14.2023 12.13.2023 06.12.2024 12.11.2024 06.11.2025 12.10.2025 06.10.2026 12.09.2026 06.09.2027 12.08.2027 06.07.2028 12.06.2028 12.06.28 9,70 48,50 (excluding 06.20.2018– 46,90) 4 000 000
- 20. 169 UA4000187884 5 278 UAH (capitalization) According to the CMU resolution dated 09.17.2014 № 456 11.14.14 05.15.2015; 11.13.2015; 05.13.2016; 11.11.2016; 05.12.2017; 11.10.2017; 05.11.2018; 11.09.2018; 05.10.2019; 11.08.2019; 05.08.2020; 11.06.2020; 05.07.2021; 11.05.2021; 05.06.2022; 11.04.2022; 05.05.2023; 11.03.2023; 05.03.2024; 11.01.2024; 05.02.2025; 05.31.2025; 05.01.2026; 10.30.2026; 04.30.2027; 10.29.2027; 04.28.2028; 10.27.2028; 04.27.2029 04.27.29 12,50 62,50 3 250 000 170 UA4000197560 4 234 UAH According to the CMU resolution dated 10.04.2017. № 748 10.06.17 11.23.2017 05.24.2018 11.22.2018 05.23.2019 11.21.2019 05.21.2020 11.19.2020 05.20.2021 11.18.2021 05.19.2022 11.17.2022 05.18.2023 11.16.2023 05.16.2024 11.14.2024 05.15.2025 11.13.2025 05.14.2026 11.12.2026 05.13.2027 11.11.2027 05.11.2028 11.09.2028 05.10.2029 05.16.29 9,78 48,90 (excluding 11.23.2017– 12,90) 4 000 000 171 UA4000196364 4 521 UAH (index)* (capitalization) According to the CMU resolution dated 12.18.2016 № 961 12.29.16 05.31.2017 11.29.2017 05.30.2018 11.28.2018 05.29.2019 11.27.2019 05.27.2020 11.25.2020 05.26.2021 11.24.2021 05.25.2022 11.23.2022 05.24.2023 11.22.2023 05.22.2024 11.20.2024 05.21.2025 11.19.2025 05.20.2026 11.18.2026 05.19.2027 11.17.2027 05.17.2028 11.15.2028 05.16.2029 05.16.2029 *nominal value indexation will be determined on the maturity date 6.00 30,00 (excluding 05.31.2017– 25,22) 4 000 000 172 UA4000196372 4 647 UAH (index)* (capitalization) According to the CMU resolution dated 12.18.2016 № 961 12.29.16 04.05.2017; 10.04.2017; 04.04.2018; 10.06.2018; 04.03.2019; 10.02.2019; 04.01.2020; 09.30.2020; 03.31.2021; 09.29.2021; 03.30.2022; 09.28.2022; 03.28.2023; 09.27.2023; 03.27.2024; 09.25.2024; 03.26.2025; 09.24.2025; 03.25.2026; 09.23.2026; 03.24.2027; 09.22.2027; 03.22.2028; 09.20.2028 03.21.2029; 09.19.2029 09.19.2029 *nominal value indexation will be determined on the maturity date 6.00 30,00 (excluding 04.05.2017– 15,99) 4 000 000 173 UA4000187348 5 460 UAH (capitalization) According to the CMU resolution dated 09.17.2014 № 456 10.31.2014 05.01.2015; 10.30.2015; 04.29.2016; 10.28.2016; 04.28.2017; 10.27.2017; 04.27.2018; 10.26.2018; 04.26.2019; 10.25.2019; 04.24.2020; 10.23.2020; 04.23.2021; 10.22.2021; 04.22.2022; 10.21.2022; 04.21.2023; 10.20.2023; 04.19.2024; 10.18.2024; 04.18.2025; 10.17.2025; 04.17.2026; 10.16.2026 04.16.2027; 10.15.2027; 04.14.2028; 10.13.2028; 04.13.2029; 10.12.2029 10.12.29 12,50 62,50 1 000 000 174 UA4000197578 4 418 UAH According to the CMU resolution dated 10.04.2017. № 748 10.06.17 11.25.2017 05.26.2018 11.24.2018 05.25.2019 11.23.2019 05.23.2020 11.21.2020 05.22.2021 11.20.2021 05.21.2022 11.19.2022 05.20.2023 11.18.2023 05.18.2024 11.16.2024 05.17.2025 11.15.2025 05.16.2026 11.14.2026 05.15.2027 11.13.2027 05.13.2028 11.11.2028 05.12.2029 11.10.2029 11.10.29 9,61 48,05 (excluding 06.14.2017– 13,20) 4 000 000
- 21. 175 UA4000196380 4 717 UAH (index)* (capitalization) According to the CMU resolution dated 12.18.2016 № 961 12.29.16 06.14.2017 12.13.2017 06.13.2018 12.12.2018 06.12.2019 12.11.2019 06.10.2020 12.06.2020 06.09.2021 12.08.2021 06.08.2022 12.07.2022 06.07.2023 12.06.2023 06.05.2024 12.04.2024 06.04.2025 12.03.2025 06.03.2026 12.02.2026 06.02.2027 12.01.2027 05.31.2028 11.29.2028 05.30.2029 11.28.2029 11.28.2029 *nominal value indexation will be determined on the maturity date 6,00 30,00 (excluding 06.14.2017– 27,53) 4 000 000 176 UA4000196216 4 816 UAH (capitalization) According to the CMU resolution dated 12.18.2016 № 961 12.28.16 03.22.2017; 09.20.2017; 03.21.2018; 09.19.2018; 03.20.2019; 09.18.2019; 03.18.2020; 09.16.2020; 03.17.2021; 09.15.2021; 03.16.2022; 09.14.2022; 03.15.2023; 09.13.2023; 03.13.2024; 09.11.2024; 03.12.2025; 09.10.2025; 03.11.2026; 09.09.2026; 03.10.2027; 09.08.2027; 03.08.2028; 09.06.2028 03.07.2029; 09.05.2029; 03.06.2030 03.06.30 9,98 49,90 (excluding 03.22.2017– 23,03) 4 000 000 177 UA4000196398 4 850 UAH (index)* (capitalization) According to the CMU resolution dated 12.18.2016 № 961 12.29.16 04.24.2017; 10.25.2017; 04.25.2018; 10.24.2018; 04.24.2019; 10.23.2019; 04.22.2020; 10.21.2020; 04.21.2021; 10.20.2021; 04.20.2022; 10.19.2022; 04.19.2023; 10.18.2023; 04.17.2024; 10.16.2024; 04.16.2025; 10.15.2025; 04.15.2026; 10.14.2026; 04.14.2027; 10.13.2027; 04.12.2028; 10.11.2028; 04.11.2029; 10.10.2029; 04.10.2030 04.10.2030 *nominal value indexation will be determined on the maturity date 6,00 30,00 (excluding 04.26.2017– 19,45) 4 000 000 178 UA4000196224 4 879 UAH (capitalization) According to the CMU resolution dated 12.18.2016 № 961 12.28.16 05.24.2017; 11.22.2017; 05.23.2018; 11.21.2018; 05.22.2019; 11.20.2019; 05.20.2020; 11.18.2020; 05.19.2021; 11.17.2021; 05.18.2022; 11.16.2022; 05.17.2023; 11.15.2023; 05.15.2024; 11.13.2024; 05.14.2025; 11.12.2025; 05.13.2026; 11.11.2026; 05.12.2027; 11.10.2027; 05.10.2028; 11.08.2028; 05.09.2029; 11.07.2029; 05.08.2030 05.08.30 9,95 49,75 (excluding 05.24.2017– 40,18) 4 000 000 179 UA4000196406 4 913 UAH (index)* (capitalization) According to the CMU resolution dated 12.18.2016 № 961 12.29.16 06.28.2017; 12.27.2017; 06.27.2018; 12.26.2018; 06.26.2019; 12.25.2019; 06.24.2020; 12.23.2020; 06.23.2021; 12.22.2021; 06.22.2022; 12.21.2022; 06.21.2023; 12.20.2023; 06.19.2024; 12.18.2024; 06.18.2025; 12.17.2025; 06.17.2026; 12.16.2026; 06.16.2027; 12.15.2027; 06.14.2028; 12.13.2028; 06.13.2029; 12.12.2029; 06.12.2030 06.12.2030 *nominal value indexation will be determined on the maturity date 6,00 30,00 (excluding 06.28.2017– 29,84) 4 000 000 180 UA4000197032 4 874 UAH (capitalization) According to the CMU resolution dated 03.06.2017 № 123 03.13.17 08.02.2017; 01.31.2018; 08.01.2018; 01.30.2019; 07.31.2019; 01.29.2020; 07.29.2020; 01.27.2021; 07.28.2021; 01.26.2022; 07.27.2022; 01.25.2023; 07.26.2023; 01.24.2024; 07.24.2024; 01.22.2025; 07.23.2025; 01.21.2026; 07.22.2026; 01.20.2027; 07.21.2027; 01.19.2028; 07.19.2028; 01.17.2029; 07.18.2029; 01.16.2030; ; 07.17.2030 07.17.30 9,00 45,00 (excluding 08.02.2017– 35,11) 4 700 001 181 UA4000196232 4 970 UAH (capitalization) According to the CMU resolution dated 12.18.2016 № 961 12.28.16 02.22.2017; 08.23.2017; 02.21.2018; 08.22.2018; 02.20.2019; 08.21.2019; 02.19.2020; 08.19.2020; 02.17.2021; 08.18.2021; 02.16.2022; 08.17.2022; 02.15.2023; 08.16.2023; 02.14.2024; 08.14.2024; 02.12.2025; 08.13.2025; 02.11.2026; 08.12.2026; 02.10.2027; 08.11.2027; 02.09.2028; 08.09.2028; 02.07.2029; 08.08.2029; 02.06.2030; 08.07.2030 08.07.30 9,91 49,55 (excluding 02.22.2017– 15,25) 4 000 000
- 22. 182 UA4000196414 4 990 UAH (index)* (capitalization) According to the CMU resolution dated 12.18.2016 № 961 12.29.16 03.15.2017; 09.13.2017; 03.14.2018; 09.12.2018; 03.13.2019; 09.11.2019; 03.11.2020; 09.09.2020; 03.10.2021; 09.08.2021; 03.09.2022; 09.07.2022; 03.08.2023; 09.06.2023; 03.06.2024; 09.04.2024; 03.05.2025; 09.03.2025; 03.04.2026; 09.02.2026; 03.03.2027; 09.01.2027; 03.01.2028; 08.30.2028; 02.28.2029; 08.29.2029; 02.27.2030; 08.28.2030 08.28.2030 *nominal value indexation will be determined on the maturity date 6,00 30,00 (excluding 03.15.2017– 12,53) 4 000 000 183 UA4000196430 5 011 UAH (index)* (capitalization) According to the CMU resolution dated 12.18.2016 № 961 12.29.16 04.05.2017; 10.04.2017; 04.04.2018; 10.03.2018; 04.03.2019; 10.02.2019; 04.01.2020; 09.30.2020; 03.31.2021; 09.29.2021; 03.30.2022; 09.28.2022; 03.29.2023; 09.27.2023; 03.27.2024; 09.25.2024; 03.26.2025; 09.24.2025; 03.25.2026; 09.23.2026; 03.24.2027; 09.22.2027; 03.22.2028; 09.20.2028; 03.21.2029; 09.19.2029; 03.20.2030; 09.18.2030 09.18.2030 *nominal value indexation will be determined on the maturity date 6,00 30,00 (excluding 04.05.2017– 15,99) 4 000 000 184 UA4000196448 5 095 UAH (index)* (capitalization) According to the CMU resolution dated 12.18.2016 № 961 12.29.16 06.28.2017; 12.27.2017; 06.27.2018; 12.26.2018; 06.26.2019; 12.25.2019; 06.24.2020; 12.23.2020; 06.23.2021; 12.22.2021; 06.22.2022; 12.21.2022; 06.21.2023; 12.20.2023; 06.19.2024; 12.18.2024; 06.18.2025; 12.17.2025; 06.17.2026; 12.16.2026; 06.16.2027; 12.15.2027; 06.14.2028; 12.13.2028; 06.13.2029; 12.12.2029; 06.12.2030; 12.11.2030 12.11.2030 *nominal value indexation will be determined on the maturity date 6,00 30,00 (excluding 06.28.2017– 29,84) 4 000 000 185 UA4000196927 5 081 UAH (index)* (capitalization) According to the CMU resolution dated 02.22.2017 № 89 01.23.17 08.09.2017; 02.07.2018; 08.08.2018; 02.06.2019; 08.07.2019; 02.05.2020; 08.05.2020; 02.03.2021; 08.04.2021; 02.02.2022; 08.03.2022; 02.01.2023; 08.02.2023; 01.31.2024; 07.31.2024; 01.29.2025; 07.30.2025; 01.28.2026; 07.29.2026; 01.27.2027; 07.28.2027; 01.26.2028; 07.26.2028; 01.24.2029; 07.25.2029; 01.23.2030; 07.24.2030; 01.22.2031 01.22.2031 *nominal value indexation will be determined on the maturity date 6,00 30,00 (excluding 08.09.2017– 27,53) 4 900 000 186 UA4000196265 5 159 UAH (capitalization) According to the CMU resolution dated 12.18.2016 № 961 12.28.16 03.01.2017; 08.30.2017; 02.28.2018; 08.29.2018; 02.27.2019; 08.28.2019; 02.26.2020; 08.26.2020; 02.24.2021; 08.25.2021; 02.23.2022; 08.24.2022; 02.22.2023; 08.23.2023; 02.21.2024; 08.21.2024; 02.19.2025; 08.20.2025; 02.18.2026; 08.19.2026; 02.17.2027; 08.18.2027; 02.16.2028; 08.16.2028 02.14.2029; 08.15.2029; 02.13.2030; 08.14.2030; 02.12.2031 02.12.31 9,82 49,10 (excluding 03.01.2017– 17,00) 4 000 000 187 UA4000196455 5 186 UAH (index)* (capitalization) According to the CMU resolution dated 12.18.2016 № 961 12.29.16 03.29.2017; 09.27.2017; 03.28.2018; 09.26.2018; 03.27.2019; 09.25.2019; 03.25.2020; 09.23.2020; 03.24.2021; 09.22.2021; 03.23.2022; 09.21.2022; 03.22.2023; 09.20.2023; 03.20.2024; 09.18.2024; 03.19.2025; 09.17.2025; 03.18.2026; 09.16.2026; 03.17.2027; 09.15.2027; 03.15.2028; 09.13.2028; 03.14.2029; 09.12.2029; 03.13.2030; 09.11.2030; 03.12.2031 03.12.2031 *nominal value indexation will be determined on the maturity date 6,00 30,00 (excluding 03.29.2017– 14,84) 4 000 000 188 UA4000196273 5 208 UAH (capitalization) According to the CMU resolution dated 12.18.2016 № 961 12.28.16 04.19.2017; 10.18.2017; 04.18.2018; 10.17.2018; 04.17.2019; 10.16.2019; 04.15.2020; 10.14.2020; 04.14.2021; 10.13.2021; 04.13.2022; 10.12.2022; 04.12.2023; 10.11.2023; 04.10.2024; 10.09.2024; 04.09.2025; 10.08.2025; 04.08.2026; 10.07.2026; 04.07.2027; 10.06.2027; 04.05.2028; 10.04.2028; 04.04.2029; 10.03.2029; 04.03.2030; 10.02.2030; 04.02.2031 04.02.31 9,80 49,00 (excluding 04.19.2017– 30,15) 4 000 000 189 UA4000196463 5 228 UAH (index)* (capitalization) According to the CMU resolution dated 12.18.2016 № 961 12.29.16 05.10.2017; 11.08.2017; 05.09.2018; 11.07.2018; 05.08.2019; 11.06.2019; 05.06.2020; 11.04.2020; 05.05.2021; 11.03.2021; 05.04.2022; 11.02.2022; 05.03.2023; 11.01.2023; 05.01.2024; 10.30.2024; 04.30.2025; 10.29.2025; 04.29.2026; 10.28.2026; 04.28.2027; 10.27.2027; 04.26.2028; 10.25.2028; 04.25.2029; 10.24.2029; 04.24.2030; 10.23.2030; 04.23.2031 04.23.2031 *nominal value indexation will be determined on the maturity date 6,00 30,00 (excluding 05.10.2017– 21,76) 4 000 000
- 23. 190 UA4000197586 4 964 UAH According to the CMU resolution dated 10.04.2017. № 748 10.06.17 11.25.2017; 05.26.2018; 11.24.2018; 05.25.2019; 11.23.2019; 05.23.2020; 11.21.2020; 05.22.2021; 11.20.2021; 05.21.2022; 11.19.2022; 05.20.2023; 11.18.2023; 05.18.2024; 11.16.2024; 05.17.2025; 11.15.2025; 05.16.2026; 11.14.2026; 05.15.2027; 11.13.2027; 05.13.2028; 11.11.2028; 05.12.2029; 11.10.2029; 05.11.2030; 11.09.2030; 05.10.2031 05.10.31 9,15 45,75 (excluding 05.31.2017– 12,57) 1 000 000 191 UA4000196281 5 250 UAH (capitalization) According to the CMU resolution dated 12.18.2016 № 961 12.28.16 05.31.2017; 11.29.2017; 05.30.2018; 11.28.2018; 05.29.2019; 11.27.2019; 05.27.2020; 11.25.2020; 05.26.2021; 11.24.2021; 05.25.2022; 11.23.2022; 05.24.2023; 11.22.2023; 05.22.2024; 11.20.2024; 05.21.2025; 11.19.2025; 05.20.2026; 11.18.2026; 05.19.2027; 11.17.2027; 05.17.2028; 11.15.2028 05.16.2029; 11.14.2029; 05.15.2030; 11.13.2030; 05.14.2031 05.14.31 9,79 48,95 (excluding 05.31.2017– 41,42) 4 000 000 192 UA4000196471 5 270 UAH (index)* (capitalization) According to the CMU resolution dated 12.18.2016 № 961 12.29.16 06.21.2017; 12.20.2017; 06.20.2018; 12.19.2018; 06.19.2019; 12.18.2019; 06.17.2020; 12.16.2020; 06.16.2021; 12.15.2021; 06.15.2022; 12.14.2022; 06.14.2023; 12.13.2023; 06.12.2024; 12.11.2024; 06.11.2025; 12.10.2025; 06.10.2026; 12.09.2026; 06.09.2027; 12.08.2027; 06.07.2028; 12.06.2028 06.06.2029; 12.05.2029; 06.05.2030; 12.04.2030; 06.04.2031 06.04.2031 *nominal value indexation will be determined on the maturity date 6,00 30,00 (excluding 06.31.2017– 28,68) 4 000 000 193 UA4000196299 5 320 UAH (capitalization) According to the CMU resolution dated 12.18.2016 № 961 12.28.16 02.08.2017; 08.09.2017; 02.07.2018; 08.08.2018; 02.06.2019; 08.07.2019; 02.05.2020; 08.05.2020; 02.03.2021; 08.04.2021; 02.02.2022; 08.03.2022; 02.01.2023; 08.02.2023; 01.31.2024; 07.31.2024; 01.29.2025; 07.30.2025; 01.28.2026; 07.29.2026; 01.27.2027; 07.28.2027; 01.26.2028; 07.26.2028 01.24.2029; 07.25.2029; 01.23.2030; 07.24.2030; 01.22.2031; 07.23.2031 07.23.31 9,76 48,80 (excluding 02.08.2017– 11,26) 4 000 000 194 UA4000196513 5 354 UAH (capitalization) According to the CMU resolution dated 12.28.2016 № 1003 12.29.16 03.15.2017; 09.13.2017; 03.14.2018; 09.12.2018; 03.13.2019; 09.11.2019; 03.11.2020; 09.09.2020; 03.10.2021; 09.08.2021; 03.09.2022; 09.07.2022; 03.08.2023; 09.06.2023; 03.06.2024; 09.04.2024; 03.05.2025; 09.03.2025; 03.04.2026; 09.02.2026; 03.03.2027; 09.01.2027; 03.01.2028; 08.30.2028 02.28.2029; 08.29.2029; 02.27.2030; 08.28.2030; 02.26.2031; 08.27.2031 08.27.31 9,99 49,95 (excluding 03.15.2017– 20,86) 4 000 000 195 UA4000196489 5 368 UAH (index)* (capitalization) According to the CMU resolution dated 12.18.2016 № 961 12.29.16 03.29.2017; 09.27.2017; 03.28.2018; 09.26.2018; 03.27.2019; 09.25.2019; 03.25.2020; 09.23.2020; 03.24.2021; 09.22.2021; 03.23.2022; 09.21.2022; 03.22.2023; 09.20.2023; 03.20.2024; 09.18.2024; 03.19.2025; 09.17.2025; 03.18.2026; 09.16.2026; 03.17.2027; 09.15.2027; 03.15.2028; 09.13.2028; 03.14.2029; 09.12.2029; 03.13.2030; 09.11.2030; 03.12.2031; 09.10.2031 09.10.2031 *nominal value indexation will be determined on the maturity date 6,00 30,00 (excluding 03.29.2017–14,84) 4 000 000 196 UA4000196307 5 383 UAH (capitalization) According to the CMU resolution dated 12.18.2016 № 961 12.28.16 04.12.2017; 10.11.2017; 04.11.2018; 10.10.2018; 04.10.2019; 10.09.2019; 04.08.2020; 10.07.2020; 04.07.2021; 10.06.2021; 04.06.2022; 10.05.2022; 04.05.2023; 10.04.2023; 04.03.2024; 10.02.2024; 04.02.2025; 10.01.2025; 04.01.2026; 09.30.2026; 03.31.2027; 09.29.2027; 03.29.2028; 09.27.2028 03.28.2029; 09.26.2029; 03.27.2030; 09.25.2030; 03.26.2031; 09.24.2031 09.24.31 9,73 48,65 (excluding 04.12.2017– 28,07) 4 000 000 197 UA4000196497 5 403 UAH (index)* (capitalization) According to the CMU resolution dated 12.18.2016 № 961 12.29.16 05.03.2017; 11.01.2017; 05.02.2018; 10.31.2018; 05.01.2019; 10.30.2019; 04.29.2020; 10.28.2020; 04.28.2021; 10.27.2021; 04.27.2022; 10.26.2022; 04.26.2023; 10.25.2023; 04.24.2024; 10.23.2024; 04.23.2025; 10.22.2025; 04.22.2026; 10.21.2026; 04.21.2027; 10.20.2027; 04.19.2028; 10.18.2028 04.18.2029; 10.17.2029; 04.17.2030; 10.16.2030; 04.16.2031; 10.15.2031 10.15.2031 *nominal value indexation will be determined on the maturity date 6,00 30,00 (excluding 05.03.2017– 20,60) 3 999 999
- 24. 198 UA4000197594 5 148 UAH According to the CMU resolution dated 10.04.2017. № 748 10.06.17 11.27.2017; 05.28.2018; 11.26.2018; 05.27.2019; 11.25.2019; 05.25.2020; 11.23.2020; 05.24.2021; 11.22.2021; 05.23.2022; 11.21.2022; 05.22.2023; 11.20.2023; 05.20.2024; 11.18.2024; 05.19.2025; 11.17.2025; 05.18.2026; 11.16.2026; 05.17.2027; 11.15.2027; 05.15.2028; 11.13.2028; 05.14.2029 11.12.2029; 05.13.2030; 11.11.2030; 05.12.2031; 11.10.2031 11.10.31 9,01 45,05 (excluding 06.07.2017– 12,87) 1 000 000 199 UA4000196315 5 439 UAH (capitalization) According to the CMU resolution dated 12.18.2016 № 961 12.28.16 06.07.2017; 12.06.2017; 06.06.2018; 12.05.2018; 06.05.2019; 12.04.2019; 06.03.2020; 12.02.2020; 06.02.2021; 12.01.2021; 06.01.2022; 11.30.2022; 05.31.2023; 11.29.2023; 05.29.2024; 11.27.2024; 05.28.2025; 11.26.2025; 05.27.2026; 11.25.2026; 05.26.2027; 11.24.2027; 05.24.2028; 11.22.2028 05.23.2029; 11.21.2029; 05.22.2030; 11.20.2030; 05.21.2031; 11.19.2031 11.19.31 9,71 48,55 (excluding 06.07.2017– 42,95) 2 999 999 200 UA4000196521 5 459 UAH (capitalization) According to the CMU resolution dated 12.28.2016 № 1003 12.29.16 06.28.2017; 12.27.2017; 06.27.2018; 12.26.2018; 06.26.2019; 12.25.2019; 06.24.2020; 12.23.2020; 06.23.2021; 12.22.2021; 06.22.2022; 12.21.2022; 06.21.2023; 12.20.2023; 06.19.2024; 12.18.2024; 06.18.2025; 12.17.2025; 06.17.2026; 12.16.2026; 06.16.2027; 12.15.2027; 06.14.2028; 12.13.2028 06.13.2029; 12.12.2029; 06.12.2030; 12.11.2030; 06.11.2031; 12.10.2031 12.10.31 9,99 49,95 (excluding 06.28.2017– 49,68) 3 941 000 201 UA4000196935 5 452 UAH (index)* (capitalization) According to the CMU resolution dated 02.22.2017 № 89 02.23.17 08.16.2017; 02.14.2018; 08.15.2018; 02.13.2019; 08.14.2019; 02.12.2020; 08.12.2020; 02.10.2021; 08.11.2021; 02.09.2022; 08.10.2022; 02.08.2023; 08.09.2023; 02.07.2024; 08.07.2024; 02.05.2025; 08.06.2025; 02.04.2026; 08.05.2026; 02.03.2027; 08.04.2027; 02.02.2028; 08.02.2028; 01.31.2029; 08.01.2029; 01.30.2030; 07.31.2030; 01.29.2031; 07.30.2031; 01.28.2032 01.28.2032 *nominal value indexation will be determined on the maturity date 6,00 30,00 (excluding 08.16.2017– 28,68) 4 900 000 202 UA4000197065 5 455 UAH (index)* (capitalization) According to the CMU resolution dated 03.06.2017 № 122 03.15.17 09.08.2017; 03.09.2018; 09.07.2018; 03.08.2019; 09.06.2019; 03.06.2020; 09.04.2020; 03.05.2021; 09.03.2021; 03.04.2022; 09.02.2022; 03.03.2023; 09.01.2023; 03.01.2024; 08.30.2024; 02.28.2025; 08.29.2025; 02.27.2026; 08.28.2026; 02.26.2027; 08.27.2027; 02.25.2028; 08.25.2028; 02.23.2029 08.24.2029; 02.22.2030; 08.23.2030; 02.21.2031; 08.22.2031; 02.20.2032 02.20.2032 *nominal value indexation will be determined on the maturity date 5,00 25,00 (excluding 09.08.2017– 24,31) 5 400 960 203 UA4000198139 5 356 UAH (capitalization) According to the CMU resolution dated 06.23.2017 № 443 07.11.17 09.27.2017; 03.28.2018; 09.26.2018; 03.27.2019; 09.25.2019; 03.25.2020; 09.23.2020; 03.24.2021; 09.22.2021; 03.23.2022; 09.21.2022; 03.22.2023; 09.20.2023; 03.20.2024; 09.18.2024; 03.19.2025; 09.17.2025; 03.18.2026; 09.16.2026; 03.17.2027; 09.15.2027; 03.15.2028; 09.13.2028; 03.14.2029; 09.12.2029; 03.13.2030; 09.11.2030; 03.12.2031; 09.10.2031; 03.10.2032 03.10.32 9,70 48,50 (excluding 09.27.2017– 20,79) 4 499 995 204 UA4000197602 5 330 UAH According to the CMU resolution dated 10.04.2017. № 748 10.06.17 11.27.2017; 05.28.2018; 11.26.2018; 05.27.2019; 11.25.2019; 05.25.2020; 11.23.2020; 05.24.2021; 11.22.2021; 05.23.2022; 11.21.2022; 05.22.2023; 11.20.2023; 05.20.2024; 11.18.2024; 05.19.2025; 11.17.2025; 05.18.2026; 11.16.2026; 05.17.2027; 11.15.2027; 05.15.2028; 11.13.2028; 05.14.2029 11.12.2029; 05.13.2030; 11.11.2030; 05.12.2031; 11.10.2031; 05.10.2032 05.10.32 8,88 44,40 (excluding 27.01.2017– 12,69) 6 048 872 205 UA4000198121 5 440 UAH (capitalization) According to the CMU resolution dated 06.23.2017 № 443 07.11.17 12.20.2017; 06.20.2018; 12.19.2018; 06.19.2019; 12.18.2019; 06.17.2020; 12.16.2020; 06.16.2021; 12.15.2021; 06.15.2022; 12.14.2022; 06.14.2023; 12.13.2023; 06.12.2024; 12.11.2024; 06.11.2025; 12.10.2025; 06.10.2026; 12.09.2026; 06.09.2027; 12.08.2027; 06.07.2028; 12.06.2028; 06.06.2029; 12.05.2029; 06.05.2030; 12.04.2030; 06.04.2031; 12.03.2031; 06.02.2032 06.02.32 9,70 48,50 (excluding 20.12.2017– 43,17) 4 500 000
- 25. 206 UA4000198113 5 524 UAH (capitalization) According to the CMU resolution dated 06.23.2017 № 443 07.11.17 09.13.2017; 03.14.2018; 09.12.2018; 03.13.2019; 09.11.2019; 03.11.2020; 09.09.2020; 03.10.2021; 09.08.2021; 03.09.2022; 09.07.2022; 03.08.2023; 09.03.2023; 03.06.2024; 09.04.2024; 03.05.2025; 09.03.2025; 03.04.2026; 09.02.2026; 03.03.2027; 09.01.2027; 03.01.2028; 08.30.2028; 02.28.2029; 08.29.2029; 02.27.2030; 08.28.2030; 02.26.2031; 08.27.2031; 02.25.2032; 08.25.2032 08.25.32 9,70 48,50 (excluding 13.12.2017– 17,05) 4 500 000 207 UA4000198105 5 573 UAH (capitalization) According to the CMU resolution dated 06.23.2017 № 443 07.11.17 11.01.2017; 05.02.2018; 10.31.2018; 05.01.2019; 10.30.2019; 04.29.2020; 10.28.2020; 04.28.2021; 10.27.2021; 04.27.2022; 10.26.2022; 04.26.2023; 10.25.2023; 04.24.2024; 10.23.2024; 04.23.2025; 10.22.2025; 04.22.2026; 10.21.2026; 04.21.2027; 10.20.2027; 04.19.2028; 10.18.2028; 04.18.2029; 10.17.2029; 04.17.2030; 10.16.2030; 04.16.2031; 10.15.2031; 04.14.2032; 10.13.2032 10.13.32 9,70 48,50 (excluding 11.01.2017– 30,11) 4 500 000 208 UA4000197610 5 514 UAH According to the CMU resolution dated 10.04.2017. № 748 10.06.17 11.29.2017; 05.30.2018; 11.28.2018; 05.29.2019; 11.27.2019; 05.27.2020; 11.25.2020; 05.26.2021; 11.24.2021; 05.25.2022; 11.23.2022; 05.24.2023; 11.22.2023; 05.22.2024; 11.20.2024; 05.21.2025; 11.19.2025; 05.20.2026; 11.18.2026; 05.19.2027; 11.17.2027; 05.17.2028; 11.15.2028; 05.16.2029 11.14.2029; 05.15.2030; 11.13.2030; 05.14.2031; 11.12.2031; 05.12.2032; 11.10.2032 11.10.32 8,75 43,75 (excluding 11.29.2017– 12,98) 6 048 872 209 UA4000198097 5 629 UAH (capitalization) According to the CMU resolution dated 06.23.2017 № 443 07.11.17 12.27.2017; 06.27.2018; 12.26.2018; 06.26.2019; 12.25.2019; 06.24.2020; 12.23.2020; 06.23.2021; 12.22.2021; 06.22.2022; 12.21.2022; 06.21.2023; 12.20.2023; 06.19.2024; 12.18.2024; 06.18.2025; 12.18.2025; 06.17.2026; 11.16.2026; 06.16.2027; 12.15.2027; 06.14.2028; 12.13.2028; 06.13.2029; 12.12.2029; 06.12.2030; 12.11.2030; 06.11.2031; 12.10.2031; 06.09.2032; 12.08.2032 12.08.32 9,70 48,50 (excluding 12.27.2017– 45,04) 4 500 000 210 UA4000199855 5 529 UAH (capitalization) According to the CMU resolution dated 12.27.2017 № 1039 12.28.17 02.07.2018; 09.05.2018; 03.06.2019; 09.04.2019; 03.04.2020; 09.02.2020; 03.03.2021; 09.01.2021; 03.02.2022; 08.31.2022; 03.01.2023; 08.30.2023; 02.28.2024; 08.28.2024; 02.26.2025; 08.27.2025; 02.25.2026; 08.26.2026; 02.24.2027; 08.25.2027; 02.23.2028; 08.23.2028; 02.21.2029; 08.22.2029 02.20.2030; 08.21.2030; 02.19.2031; 08.20.2031; 02.18.2032; 08.18.2032; 02.16.2033 02.16.33 8,75 43,75 (excluding 03.07.2018– 16,59) 2 875 060 211 UA4000199863 5 592 UAH (capitalization) According to the CMU resolution dated 12.27.2017 № 1039 12.28.17 05.09.2018; 11.07.2018; 05.08.2019; 11.06.2019; 05.06.2020; 11.04.2020; 05.05.2021; 11.03.2021; 05.04.2022; 11.02.2022; 05.03.2023; 11.01.2023; 05.01.2024; 10.30.2024; 04.30.2025; 10.29.2025; 04.29.2026; 10.28.2026; 04.28.2027; 10.27.2027; 04.26.2028; 10.25.2028; 04.25.2029; 10.24.2029 04.24.2030; 10.23.2030; 04.23.2031; 10.22.2031; 04.21.2032; 10.20.2032; 04.20.2033 04.20.33 8,75 43,75 (excluding 05.09.2018– 31,73) 2 875 060 212 UA4000197628 5 695 UAH According to the CMU resolution dated 10.04.2017. № 748 10.06.17 11.28.2017; 05.29.2018; 11.27.2018; 05.28.2019; 11.26.2019; 05.26.2020; 11.24.2020; 05.25.2021; 11.23.2021; 05.24.2022; 11.22.2022; 05.23.2023; 11.21.2023; 05.21.2024; 11.19.2024; 05.20.2025; 11.18.2025; 05.19.2026; 11.17.2026; 05.18.2027; 11.16.2027; 05.16.2028; 11.14.2028; 05.15.2029 11.13.2029; 05.14.2030; 11.12.2030; 05.13.2031; 11.11.2031; 05.11.2032; 11.09.2032; 05.10.2033 05.10.33 8,63 43,15 (excluding 11.28.2017– 12,57) 6 048 872
- 26. 213 UA4000197636 5 879 UAH According to the CMU resolution dated 10.04.2017. № 748 10.06.17 11.30.2017; 05.31.2018; 11.29.2018; 05.30.2019; 11.28.2019; 05.28.2020; 11.26.2020; 05.27.2021; 11.25.2021; 05.26.2022; 11.24.2022; 05.25.2023; 11.23.2023; 05.23.2024; 11.21.2024; 05.22.2025; 11.20.2025; 05.21.2026; 11.19.2026; 05.20.2027; 11.18.2027; 05.18.2028; 11.16.2028; 05.17.2029; 11.15.2029; 05.16.2030; 11.14.2030; 05.15.2031; 11.13.2031; 05.13.2032; 11.11.2032; 05.12.2033; 11.10.2033 11.10.33 8,52 42,60 (excluding 11.30.2017– 12,87) 6 048 872 214 UA4000197644 6 060 UAH According to the CMU resolution dated 10.04.2017. № 748 10.06.17 11.29.2017; 05.30.2018; 11.28.2018; 05.29.2019; 11.27.2019; 05.27.2020; 11.25.2020; 05.26.2021; 11.24.2021; 05.25.2022; 11.23.2022; 05.24.2023; 11.22.2023; 05.22.2024; 11.20.2024; 05.21.2025; 11.19.2025; 05.20.2026; 11.18.2026; 05.19.2027; 11.17.2027; 05.17.2028; 11.15.2028; 05.16.2029 11.14.2029; 05.15.2030; 11.13.2030; 05.14.2031; 11.12.2031; 05.12.2032; 11.10.2032; 05.11.2033; 11.09.2033; 05.10.2034 05.10.34 8,42 42,10 (excluding 11.29.2017– 12,49) 6 048 872 215 UA4000197651 6 244 UAH According to the CMU resolution dated 10.04.2017. № 748 10.06.17 12.01.2017; 06.01.2018; 11.30.2018; 05.31.2019; 11.29.2019; 05.29.2020; 11.27.2020; 05.28.2021; 11.26.2021; 05.27.2022; 11.25.2022; 05.26.2023; 11.24.2023; 05.24.2024; 11.22.2024; 05.23.2025; 11.21.2025; 05.22.2026; 11.20.2026; 05.21.2027; 11.19.2027; 05.19.2028; 11.17.2028; 05.18.2029; 11.16.2029; 05.17.2030; 11.15.2030; 05.16.2031; 11.14.2031; 05.14.2032; 11.12.2032; 05.13.2033; 11.11.2033; 05.12.2034; 11.10.2034 11.10.34 8,31 41,55 (excluding 12.01.2017– 12,78) 6 048 872 216 UA4000197669 6 425 UAH According to the CMU resolution dated 10.04.2017. № 748 10.06.17 11.30.2017; 05.31.2018; 11.29.2018; 05.30.2019; 11.28.2019; 05.28.2020; 11.26.2020; 05.27.2021; 11.25.2021; 05.26.2022; 11.24.2022; 05.25.2023; 11.23.2023; 05.23.2024; 11.21.2024; 05.22.2025; 11.20.2025; 05.21.2026; 11.19.2026; 05.20.2027; 11.18.2027; 05.18.2028; 11.16.2028; 05.17.2029 11.15.2029; 05.16.2030; 11.14.2030; 05.15.2031; 11.13.2031; 05.13.2032; 11.11.2032; 05.12.2033; 11.10.2033; 05.11.2034; 11.09.2034; 05.10.2035 05.10.35 8,22 41,10 (excluding 11.30.2017–12,42) 6 048 872 217 UA4000197677 6 609 UAH According to the CMU resolution dated 10.04.2017. № 748 10.06.17 12.02.2017; 06.02.2018; 12.01.2018; 06.01.2019; 11.30.2019; 05.30.2020; 11.28.2020; 05.29.2021; 11.27.2021; 05.28.2022; 11.26.2022; 05.27.2023; 11.25.2023; 05.25.2024; 11.23.2024; 05.24.2025; 11.22.2025; 05.23.2026; 11.21.2026; 05.22.2027; 11.20.2027; 05.20.2028; 11.18.2028; 05.19.2029 11.17.2029; 05.18.2030; 11.16.2030; 05.17.2031; 11.15.2031; 05.15.2032; 11.13.2032; 05.14.2033; 11.12.2033; 05.13.2034; 11.11.2034; 05.12.2035; 11.10.2035 11.10.35 8,12 40,60 (excluding 12.02.2017– 12,72) 6 048 872 218 UA4000197685 6 791 UAH (inflation-linked) According to the CMU resolution dated 10.04.2017. № 748 10.06.17 05.10.2018 05.10.2019 05.10.2020 05.10.2021 05.10.2022 05.10.2023 05.10.2024 05.10.2025 05.10.2026 05.10.2027 05.10.2028 05.10.2029 05.10.2030 05.10.2031 05.10.2032 05.10.2033 05.10.2034 05.10.2035 05.10.2036 05.10.36 According to the CMU resolution dated 10.04.2017. № 748 According to the CMU resolution dated 10.04.2017. № 748 6 048 872
- 27. 219 UA4000197693 6 975 UAH (inflation-linked) According to the CMU resolution dated 10.04.2017. № 748 10.06.17 11.10.2018 11.10.2019 11.10.2020 11.10.2021 11.10.2022 11.10.2023 11.10.2024 11.10.2025 11.10.2026 11.10.2027 11.10.2028 11.10.2029 11.10.2030 11.10.2031 11.10.2032 11.10.2033 11.10.2034 11.10.2035 11.10.2036 11.10.36 According to the CMU resolution dated 10.04.2017. № 748 According to the CMU resolution dated 10.04.2017. № 748 6 048 872 220 UA4000197701 7 156 UAH (inflation-linked) According to the CMU resolution dated 10.04.2017. № 748 10.06.17 05.10.2018 05.10.2019 05.10.2020 05.10.2021 05.10.2022 05.10.2023 05.10.2024 05.10.2025 05.10.2026 05.10.2027 05.10.2028 05.10.2029 05.10.2030 05.10.2031 05.10.2032 05.10.2033 05.10.2034 05.10.2035 05.10.2036 05.10.2037 05.10.37 According to the CMU resolution dated 10.04.2017. № 748 According to the CMU resolution dated 10.04.2017. № 748 6 048 872 221 UA4000197719 7 340 UAH (inflation-linked) According to the CMU resolution dated 10.04.2017. № 748 10.06.17 11.10.2018 11.10.2019 11.10.2020 11.10.2021 11.10.2022 11.10.2023 11.10.2024 11.10.2025 11.10.2026 11.10.2027 11.10.2028 11.10.2029 11.10.2030 11.10.2031 11.10.2032 11.10.2033 11.10.2034 11.10.2035 11.10.2036 11.10.2037 11.10.37 According to the CMU resolution dated 10.04.2017. № 748 According to the CMU resolution dated 10.04.2017. № 748 6 048 872 222 UA4000197727 7 521 UAH (inflation-linked) According to the CMU resolution dated 10.04.2017. № 748 10.06.17 05.10.2018 05.10.2019 05.10.2020 05.10.2021 05.10.2022 05.10.2023 05.10.2024 05.10.2025 05.10.2026 05.10.2027 05.10.2028 05.10.2029 05.10.2030 05.10.2031 05.10.2032 05.10.2033 05.10.2034 05.10.2035 05.10.2036 05.10.2037 05.10.2038 05.10.38 According to the CMU resolution dated 10.04.2017. № 748 According to the CMU resolution dated 10.04.2017. № 748 6 048 872 223 UA4000197735 7 705 UAH (inflation-linked) According to the CMU resolution dated 10.04.2017. № 748 10.06.17 11.10.2018 11.10.2019 11.10.2020 11.10.2021 11.10.2022 11.10.2023 11.10.2024 11.10.2025 11.10.2026 11.10.2027 11.10.2028 11.10.2029 11.10.2030 11.10.2031 11.10.2032 11.10.2033 11.10.2034 11.10.2035 11.10.2036 11.10.2037 11.10.2038 11.10.38 According to the CMU resolution dated 10.04.2017. № 748 According to the CMU resolution dated 10.04.2017. № 748 6 048 872 224 UA4000197743 7 886 UAH (inflation-linked) According to the CMU resolution dated 10.04.2017. № 748 10.06.17 05.10.2018 05.10.2019 05.10.2020 05.10.2021 05.10.2022 05.10.2023 05.10.2024 05.10.2025 05.10.2026 05.10.2027 05.10.2028 05.10.2029 05.10.2030 05.10.2031 05.10.2032 05.10.2033 05.10.2034 05.10.2035 05.10.2036 05.10.2037 05.10.2038 05.10.2039 05.10.39 According to the CMU resolution dated 10.04.2017. № 748 According to the CMU resolution dated 10.04.2017. № 748 6 048 872
- 28. 225 UA4000197750 8 070 UAH (inflation-linked) According to the CMU resolution dated 10.04.2017. № 748 10.06.17 11.10.2018 11.10.2019 11.10.2020 11.10.2021 11.10.2022 11.10.2023 11.10.2024 11.10.2025 11.10.2026 11.10.2027 11.10.2028 11.10.2029 11.10.2030 11.10.2031 11.10.2032 11.10.2033 11.10.2034 11.10.2035 11.10.2036 11.10.2037 11.10.2038 11.10.2039 11.10.39 According to the CMU resolution dated 10.04.2017. № 748 According to the CMU resolution dated 10.04.2017. № 748 6 048 872 226 UA4000197768 8 252 UAH (inflation-linked) According to the CMU resolution dated 10.04.2017. № 748 10.06.17 05.10.2018 05.10.2019 05.10.2020 05.10.2021 05.10.2022 05.10.2023 05.10.2024 05.10.2025 05.10.2026 05.10.2027 05.10.2028 05.10.2029 05.10.2030 05.10.2031 05.10.2032 05.10.2033 05.10.2034 05.10.2035 05.10.2036 05.10.2037 05.10.2038 05.10.2039 05.10.2040 05.10.40 According to the CMU resolution dated 10.04.2017. № 748 According to the CMU resolution dated 10.04.2017. № 748 6 048 872 227 UA4000197776 8 436 UAH (inflation-linked) According to the CMU resolution dated 10.04.2017. № 748 10.06.17 11.10.2018 11.10.2019 11.10.2020 11.10.2021 11.10.2022 11.10.2023 11.10.2024 11.10.2025 11.10.2026 11.10.2027 11.10.2028 11.10.2029 11.10.2030 11.10.2031 11.10.2032 11.10.2033 11.10.2034 11.10.2035 11.10.2036 11.10.2037 11.10.2038 11.10.2039 11.10.2040 11.10.40 According to the CMU resolution dated 10.04.2017. № 748 According to the CMU resolution dated 10.04.2017. № 748 6 048 872 228 UA4000197784 8 617 UAH (inflation-linked) According to the CMU resolution dated 10.04.2017. № 748 10.06.17 05.10.2018 05.10.2019 05.10.2020 05.10.2021 05.10.2022 05.10.2023 05.10.2024 05.10.2025 05.10.2026 05.10.2027 05.10.2028 05.10.2029 05.10.2030 05.10.2031 05.10.2032 05.10.2033 05.10.2034 05.10.2035 05.10.2036 05.10.2037 05.10.2038 05.10.2039 05.10.2040 05.10.2041 05.10.41 According to the CMU resolution dated 10.04.2017. № 748 According to the CMU resolution dated 10.04.2017. № 748 6 048 872 229 UA4000197792 8 801 UAH (inflation-linked) According to the CMU resolution dated 10.04.2017. № 748 10.06.17 11.10.2018 11.10.2019 11.10.2020 11.10.2021 11.10.2022 11.10.2023 11.10.2024 11.10.2025 11.10.2026 11.10.2027 11.10.2028 11.10.2029 11.10.2030 11.10.2031 11.10.2032 11.10.2033 11.10.2034 11.10.2035 11.10.2036 11.10.2037 11.10.2038 11.10.2039 11.10.2040 11.10.2041 11.10.41 According to the CMU resolution dated 10.04.2017. № 748 According to the CMU resolution dated 10.04.2017. № 748 6 048 872
- 29. 230 UA4000197800 8 982 UAH (inflation-linked) According to the CMU resolution dated 10.04.2017. № 748 10.06.17 05.10.2018 05.10.2019 05.10.2020 05.10.2021 05.10.2022 05.10.2023 05.10.2024 05.10.2025 05.10.2026 05.10.2027 05.10.2028 05.10.2029 05.10.2030 05.10.2031 05.10.2032 05.10.2033 05.10.2034 05.10.2035 05.10.2036 05.10.2037 05.10.2038 05.10.2039 05.10.2040 05.10.2041 05.10.2042 05.10.42 According to the CMU resolution dated 10.04.2017. № 748 According to the CMU resolution dated 10.04.2017. № 748 6 048 872 231 UA4000197818 9 166 UAH (inflation-linked) According to the CMU resolution dated 10.04.2017. № 748 10.06.17 11.10.2018 11.10.2019 11.10.2020 11.10.2021 11.10.2022 11.10.2023 11.10.2024 11.10.2025 11.10.2026 11.10.2027 11.10.2028 11.10.2029 11.10.2030 11.10.2031 11.10.2032 11.10.2033 11.10.2034 11.10.2035 11.10.2036 11.10.2037 11.10.2038 11.10.2039 11.10.2040 11.10.2041 11.10.2042 11.10.42 According to the CMU resolution dated 10.04.2017. № 748 According to the CMU resolution dated 10.04.2017. № 748 6 048 872 232 UA4000197826 9 347 UAH (inflation-linked) According to the CMU resolution dated 10.04.2017. № 748 10.06.17 05.10.2018; 05.10.2019; 05.10.2020; 05.10.2021; 05.10.2022; 05.10.2023; 05.10.2024; 05.10.2025; 05.10.2026; 05.10.2027; 05.10.2028; 05.10.2029; 05.10.2030; 05.10.2031; 05.10.2032; 05.10.2033; 05.10.2034; 05.10.2035; 05.10.2036; 05.10.2037; 05.10.2038; 05.10.2039; 05.10.2040; 05.10.2041 05.10.2042; 05.10.2043 05.10.43 According to the CMU resolution dated 10.04.2017. № 748 According to the CMU resolution dated 10.04.2017. № 748 6 048 872 233 UA4000197834 9 531 UAH (inflation-linked) According to the CMU resolution dated 10.04.2017. № 748 10.06.17 11.10.2018 11.10.2019 11.10.2020 11.10.2021 11.10.2022 11.10.2023 11.10.2024 11.10.2025 11.10.2026 11.10.2027 11.10.2028 11.10.2029 11.10.2030 11.10.2031 11.10.2032 11.10.2033 11.10.2034 11.10.2035 11.10.2036 11.10.2037 11.10.2038 11.10.2039 11.10.2040 11.10.2041 11.10.2042 11.10.2043 11.10.43 According to the CMU resolution dated 10.04.2017. № 748 According to the CMU resolution dated 10.04.2017. № 748 6 048 872 234 UA4000197842 9 713 UAH (inflation-linked) According to the CMU resolution dated 10.04.2017. № 748 10.06.17 05.10.2018; 05.10.2019; 05.10.2020; 05.10.2021; 05.10.2022; 05.10.2023; 05.10.2024; 05.10.2025; 05.10.2026; 05.10.2027; 05.10.2028; 05.10.2029; 05.10.2030; 05.10.2031; 05.10.2032; 05.10.2033; 05.10.2034; 05.10.2035; 05.10.2036; 05.10.2037; 05.10.2038; 05.10.2039; 05.10.2040; 05.10.2041 05.10.2042; 05.10.2043; 05.10.2044 05.10.44 According to the CMU resolution dated 10.04.2017. № 748 According to the CMU resolution dated 10.04.2017. № 748 6 048 872 235 UA4000197859 9 897 UAH (inflation-linked) According to the CMU resolution dated 10.04.2017. № 748 10.06.17 11.10.2018; 11.10.2019; 11.10.2020; 11.10.2021; 11.10.2022; 11.10.2023; 11.10.2024; 11.10.2025; 11.10.2026; 11.10.2027; 11.10.2028; 11.10.2029; 11.10.2030; 11.10.2031; 11.10.2032; 11.10.2033; 11.10.2034; 11.10.2035; 11.10.2036; 11.10.2037; 11.10.2038; 11.10.2039; 11.10.2040; 11.10.2041 11.10.2042; 11.10.2043; 11.10.2044 11.10.44 According to the CMU resolution dated 10.04.2017. № 748 According to the CMU resolution dated 10.04.2017. № 748 6 048 872
- 30. 236 UA4000197867 10 078 UAH (inflation-linked) According to the CMU resolution dated 10.04.2017. № 748 10.06.17 05.10.2018; 05.10.2019; 05.10.2020; 05.10.2021; 05.10.2022; 05.10.2023; 05.10.2024; 05.10.2025; 05.10.2026; 05.10.2027; 05.10.2028; 05.10.2029; 05.10.2030; 05.10.2031; 05.10.2032; 05.10.2033; 05.10.2034; 05.10.2035; 05.10.2036; 05.10.2037; 05.10.2038; 05.10.2039; 05.10.2040; 05.10.2041 05.10.2042; 05.10.2043; 05.10.2044; 05.10.2045 05.10.45 According to the CMU resolution dated 10.04.2017. № 748 According to the CMU resolution dated 10.04.2017. № 748 6 048 872 237 UA4000197875 10 262 UAH (inflation-linked) According to the CMU resolution dated 10.04.2017. № 748 10.06.17 11.10.2018; 11.10.2019; 11.10.2020; 11.10.2021; 11.10.2022; 11.10.2023; 11.10.2024; 11.10.2025; 11.10.2026; 11.10.2027; 11.10.2028; 11.10.2029; 11.10.2030; 11.10.2031; 11.10.2032; 11.10.2033; 11.10.2034; 11.10.2035; 11.10.2036; 11.10.2037; 11.10.2038; 11.10.2039; 11.10.2040; 11.10.2041; 11.10.2042; 11.10.2043; 11.10.2044; 11.10.2045 11.10.45 According to the CMU resolution dated 10.04.2017. № 748 According to the CMU resolution dated 10.04.2017. № 748 6 048 872 238 UA4000197883 10 443 UAH (inflation-linked) According to the CMU resolution dated 10.04.2017. № 748 10.06.17 05.10.2018; 05.10.2019; 05.10.2020; 05.10.2021; 05.10.2022; 05.10.2023; 05.10.2024; 05.10.2025; 05.10.2026; 05.10.2027; 05.10.2028; 05.10.2029; 05.10.2030; 05.10.2031; 05.10.2032; 05.10.2033; 05.10.2034; 05.10.2035; 05.10.2036; 05.10.2037; 05.10.2038; 05.10.2039; 05.10.2040; 05.10.2041 05.10.2042; 05.10.2043; 05.10.2044; 05.10.2045; 05.10.2046 05.10.46 According to the CMU resolution dated 10.04.2017. № 748 According to the CMU resolution dated 10.04.2017. № 748 6 048 872 239 UA4000197891 10 627 UAH (inflation-linked) According to the CMU resolution dated 10.04.2017. № 748 10.06.17 11.10.2018; 11.10.2019; 11.10.2020; 11.10.2021; 11.10.2022; 11.10.2023; 11.10.2024; 11.10.2025; 11.10.2026; 11.10.2027; 11.10.2028; 11.10.2029; 11.10.2030; 11.10.2031; 11.10.2032; 11.10.2033; 11.10.2034; 11.10.2035; 11.10.2036; 11.10.2037; 11.10.2038; 11.10.2039; 11.10.2040; 11.10.2041; 11.10.2042; 11.10.2043; 11.10.2044; 11.10.2045; 11.10.2046 11.10.46 According to the CMU resolution dated 10.04.2017. № 748 According to the CMU resolution dated 10.04.2017. № 748 6 048 872 240 UA4000197909 10 808 UAH (inflation-linked) According to the CMU resolution dated 10.04.2017. № 748 10.06.17 05.10.2018; 05.10.2019; 05.10.2020; 05.10.2021; 05.10.2022; 05.10.2023; 05.10.2024; 05.10.2025; 05.10.2026; 05.10.2027; 05.10.2028; 05.10.2029; 05.10.2030; 05.10.2031; 05.10.2032; 05.10.2033; 05.10.2034; 05.10.2035; 05.10.2036; 05.10.2037; 05.10.2038; 05.10.2039; 05.10.2040; 05.10.2041 05.10.2042; 05.10.2043; 05.10.2044; 05.10.2045; 05.10.2046; 05.10.2047 05.10.47 According to the CMU resolution dated 10.04.2017. № 748 According to the CMU resolution dated 10.04.2017. № 748 6 048 872 241 UA4000197917 10 992 UAH (inflation-linked) According to the CMU resolution dated 10.04.2017. № 748 10.06.17 11.10.2018; 11.10.2019; 11.10.2020; 11.10.2021; 11.10.2022; 11.10.2023; 11.10.2024; 11.10.2025; 11.10.2026; 11.10.2027; 11.10.2028; 11.10.2029; 11.10.2030; 11.10.2031; 11.10.2032; 11.10.2033; 11.10.2034; 11.10.2035; 11.10.2036; 11.10.2037; 11.10.2038; 11.10.2039; 11.10.2040; 11.10.2041 11.10.2042; 11.10.2043; 11.10.2044; 11.10.2045; 11.10.2046; 11.10.2047 11.10.47 According to the CMU resolution dated 10.04.2017. № 748 According to the CMU resolution dated 10.04.2017. № 748 6 048 879 636 664 051