Download to read offline
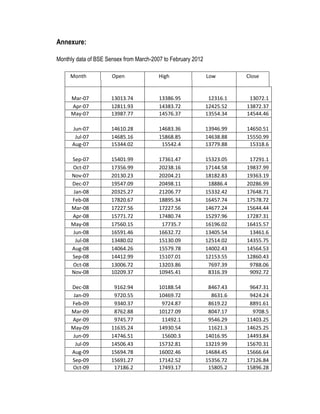


The document provides monthly data for the BSE Sensex, S&P CNX Nifty stock market indices, and foreign institutional investments from March 2007 to February 2012. It includes the open, high, low, and close values for the indices each month, as well as the equity and debt amounts and totals for foreign institutional investments on a monthly basis.


