SlideShare a Scribd company logo
1 of 2
Download to read offline
Mounth $ kWh bbl kWh/bbl thermtherm/bbl$(electricity)
Dec-13 74.72 830.00 0.00 - 271.00 - 64.72 719.11 -
Jan-14 29.81 331.00 0.00 - 635.00 - 19.81 220.11 -
Feb-14 27.55 306.00 0.00 - 726.00 - 17.55 195.00 -
Mar-14 37.52 417.00 0.00 - 655.00 - 27.52 305.78 -
Apr-14 37.52 417.00 0.00 - 220.00 - 27.52 305.78 -
May-14 45.54 506.00 0.00 - 184.00 - 35.54 394.89 -
Jun-14 101.74 1130.00 0.00 - 248.00 - 91.74 1019.33 -
Jul-14 330.13 3668.00 80.00 45.85 711.00 8.89 320.13 3557.00 44.46
Aug-14 711.14 7902.00 32.00 - 413.00 - 701.14 7790.44 -
Sep-14 821.18 9124.00 16.00 570.25 413.00 25.81 811.18 9013.11 563.32
Oct-14 1158.99 12878.00 0.00 - 324.00 - 1148.99 12766.56 -
Nov-14 612.79 6809.00 32.00 212.78 303.00 9.47 602.79 6697.67 209.30
Dec-14 517.12 5746.00 32.00 179.56 897.00 28.03 507.12 5634.67 176.08
Jan-15 590.61 6562.00 1.00 - 1141.00 - 580.61 6451.22 -
Feb-15 590.60 6562.00 37.00 177.35 556.00 15.03 580.60 6451.11 174.35
Mar-15 551.71 6130.00 48.00 127.71 833.00 17.35 541.71 6019.00 125.40
Apr-15 620.76 6897.00 41.00 168.22 386.00 9.41 610.76 6786.22 165.52
May-15 581.12 6547.00 0.00 - 421.00 - 571.12 6345.78 -
Jun-15 696.84 7743.00 16.00 483.94 218.00 13.63 686.84 7631.56 476.97
Jul-15 819.77 9109.00 87.00 104.70 373.00 4.29 809.77 8997.44 103.42
Aug-15 950.00 10556.00 32.00 329.88 300.00 9.38 940.00 10444.44 326.39
Sep-15 801.65 8907.00 17.00 523.94 264.00 15.53 791.65 8796.11 517.42
Oct-15 705.14 7835.00 115.00 68.13 219.00 1.90 695.14 7723.78 67.16
Nov-15 681.94 7577.00 122.00 62.11 726.00 5.95 671.94 7466.00 61.20
Average 234.95 12.67 231.61
Total 134489.00 708.00 ####### 131732.11
189.96 16.15 186.06kWh/bbl
(using
total of
energy
and bbl)
therm/bb
l (using
total of
therm
and bbl)
0.00
20.00
40.00
60.00
80.00
100.00
120.00
140.00
0.00
100.00
200.00
300.00
400.00
500.00
600.00
1 2 3 4 5 6 7 8 9 10 11 12 13 14 15 16 17 18 19 20 21 22 23 24
bbl
kWh/bbl
Month
Electricity Usage
kWh/bbl bbl
SB Average
BA Average
0.00
20.00
40.00
60.00
80.00
100.00
120.00
140.00
0.00
5.00
10.00
15.00
20.00
25.00
30.00
1 2 3 4 5 6 7 8 9 10 11 12 13 14 15 16 17 18 19 20 21 22 23 24
bbl
therm/bbl
Month
Natural Gas Usage
therm/bbl bbl
BA Average

More Related Content

Similar to Electricity and natural gas usage data by month

Similar to Electricity and natural gas usage data by month (20)

Stock Indicies
Stock IndiciesStock Indicies
Stock Indicies
 
Laporan Oktober 2010
Laporan Oktober 2010Laporan Oktober 2010
Laporan Oktober 2010
 
Fondos inversion primer semestre2013 participesportipodefondo_rafaelalguacilr...
Fondos inversion primer semestre2013 participesportipodefondo_rafaelalguacilr...Fondos inversion primer semestre2013 participesportipodefondo_rafaelalguacilr...
Fondos inversion primer semestre2013 participesportipodefondo_rafaelalguacilr...
 
Electricity Production Data (YAP)
Electricity Production Data (YAP)Electricity Production Data (YAP)
Electricity Production Data (YAP)
 
Operational Data 2015
Operational Data 2015Operational Data 2015
Operational Data 2015
 
EmployeeGoalSetting
EmployeeGoalSettingEmployeeGoalSetting
EmployeeGoalSetting
 
Lampiran
LampiranLampiran
Lampiran
 
Bse 30 pe histry
Bse 30  pe histryBse 30  pe histry
Bse 30 pe histry
 
Refrigerant properties charts 4-5
Refrigerant properties charts 4-5Refrigerant properties charts 4-5
Refrigerant properties charts 4-5
 
Erlang table
Erlang tableErlang table
Erlang table
 
Erlang table
Erlang tableErlang table
Erlang table
 
Erlang table
Erlang tableErlang table
Erlang table
 
Erlang table
Erlang tableErlang table
Erlang table
 
Data calculation of_thesis_2011
Data calculation of_thesis_2011Data calculation of_thesis_2011
Data calculation of_thesis_2011
 
Impulse Trend Performance
Impulse Trend PerformanceImpulse Trend Performance
Impulse Trend Performance
 
Unemployment & S&P500 Jan 1980 Aug 2009 Raw Data
Unemployment & S&P500 Jan 1980   Aug 2009   Raw DataUnemployment & S&P500 Jan 1980   Aug 2009   Raw Data
Unemployment & S&P500 Jan 1980 Aug 2009 Raw Data
 
Electricity Production Data (KOSRAE)
Electricity Production Data (KOSRAE)Electricity Production Data (KOSRAE)
Electricity Production Data (KOSRAE)
 
Pipe wall thickness and weight
Pipe wall thickness and weightPipe wall thickness and weight
Pipe wall thickness and weight
 
Spotmarket Data 2007
Spotmarket Data 2007Spotmarket Data 2007
Spotmarket Data 2007
 
SRLDC Monthly Grid Report_Jul2023.pdf
SRLDC Monthly Grid Report_Jul2023.pdfSRLDC Monthly Grid Report_Jul2023.pdf
SRLDC Monthly Grid Report_Jul2023.pdf
 

More from William Pelland

More from William Pelland (6)

FTEC_460LR3
FTEC_460LR3FTEC_460LR3
FTEC_460LR3
 
422labreport
422labreport422labreport
422labreport
 
FTEC 492 Poster
FTEC 492 PosterFTEC 492 Poster
FTEC 492 Poster
 
ERHS220 poster
ERHS220 posterERHS220 poster
ERHS220 poster
 
PvOResearchPaper
PvOResearchPaperPvOResearchPaper
PvOResearchPaper
 
OdellResume
OdellResumeOdellResume
OdellResume
 

Electricity and natural gas usage data by month

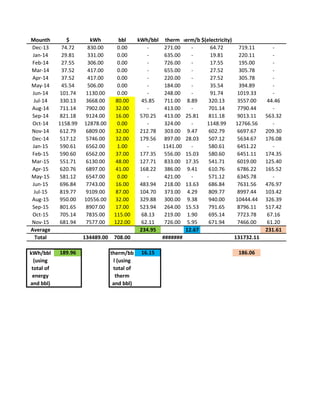
  • 1. Mounth $ kWh bbl kWh/bbl thermtherm/bbl$(electricity) Dec-13 74.72 830.00 0.00 - 271.00 - 64.72 719.11 - Jan-14 29.81 331.00 0.00 - 635.00 - 19.81 220.11 - Feb-14 27.55 306.00 0.00 - 726.00 - 17.55 195.00 - Mar-14 37.52 417.00 0.00 - 655.00 - 27.52 305.78 - Apr-14 37.52 417.00 0.00 - 220.00 - 27.52 305.78 - May-14 45.54 506.00 0.00 - 184.00 - 35.54 394.89 - Jun-14 101.74 1130.00 0.00 - 248.00 - 91.74 1019.33 - Jul-14 330.13 3668.00 80.00 45.85 711.00 8.89 320.13 3557.00 44.46 Aug-14 711.14 7902.00 32.00 - 413.00 - 701.14 7790.44 - Sep-14 821.18 9124.00 16.00 570.25 413.00 25.81 811.18 9013.11 563.32 Oct-14 1158.99 12878.00 0.00 - 324.00 - 1148.99 12766.56 - Nov-14 612.79 6809.00 32.00 212.78 303.00 9.47 602.79 6697.67 209.30 Dec-14 517.12 5746.00 32.00 179.56 897.00 28.03 507.12 5634.67 176.08 Jan-15 590.61 6562.00 1.00 - 1141.00 - 580.61 6451.22 - Feb-15 590.60 6562.00 37.00 177.35 556.00 15.03 580.60 6451.11 174.35 Mar-15 551.71 6130.00 48.00 127.71 833.00 17.35 541.71 6019.00 125.40 Apr-15 620.76 6897.00 41.00 168.22 386.00 9.41 610.76 6786.22 165.52 May-15 581.12 6547.00 0.00 - 421.00 - 571.12 6345.78 - Jun-15 696.84 7743.00 16.00 483.94 218.00 13.63 686.84 7631.56 476.97 Jul-15 819.77 9109.00 87.00 104.70 373.00 4.29 809.77 8997.44 103.42 Aug-15 950.00 10556.00 32.00 329.88 300.00 9.38 940.00 10444.44 326.39 Sep-15 801.65 8907.00 17.00 523.94 264.00 15.53 791.65 8796.11 517.42 Oct-15 705.14 7835.00 115.00 68.13 219.00 1.90 695.14 7723.78 67.16 Nov-15 681.94 7577.00 122.00 62.11 726.00 5.95 671.94 7466.00 61.20 Average 234.95 12.67 231.61 Total 134489.00 708.00 ####### 131732.11 189.96 16.15 186.06kWh/bbl (using total of energy and bbl) therm/bb l (using total of therm and bbl)
  • 2. 0.00 20.00 40.00 60.00 80.00 100.00 120.00 140.00 0.00 100.00 200.00 300.00 400.00 500.00 600.00 1 2 3 4 5 6 7 8 9 10 11 12 13 14 15 16 17 18 19 20 21 22 23 24 bbl kWh/bbl Month Electricity Usage kWh/bbl bbl SB Average BA Average 0.00 20.00 40.00 60.00 80.00 100.00 120.00 140.00 0.00 5.00 10.00 15.00 20.00 25.00 30.00 1 2 3 4 5 6 7 8 9 10 11 12 13 14 15 16 17 18 19 20 21 22 23 24 bbl therm/bbl Month Natural Gas Usage therm/bbl bbl BA Average