Technical Report Writing
BENG102P
Dr. I. Ajit,
Assistant Professor in English,
School of Social Sciences & Languages,
VIT University – Chennai Campus
2.
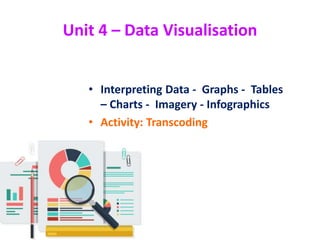
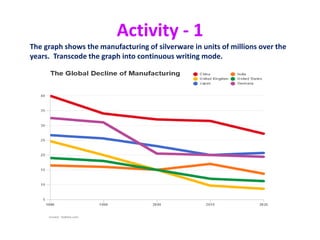
Unit 4 –Data Visualisation
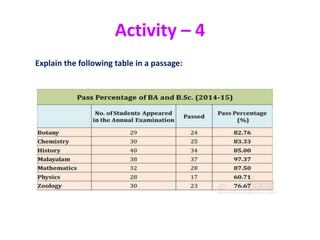
• Interpreting Data - Graphs - Tables
– Charts - Imagery - Infographics
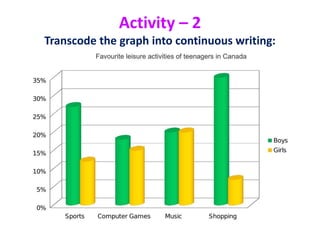
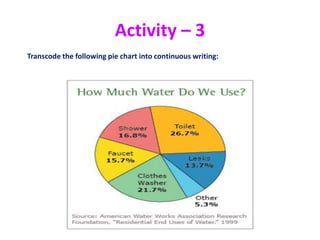
• Activity: Transcoding
3.
Graphics
• Integral partof technical communication
• Pictorial representation of data
• Features of Graphics
– Brevity
– Clarity
– Variety
– Effectiveness
– Accessibility
– Comprehensibility
4.
Types of GraphicalRepresentation
• Line Graph / Chart
• Bar Chart / Histogram
• Flow Chart
• Pie Chart
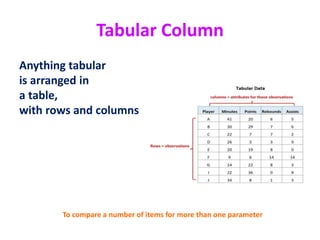
• Tabular Column
• Tree Diagram
5.
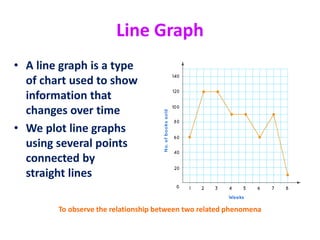
Line Graph
• Aline graph is a type
of chart used to show
information that
changes over time
• We plot line graphs
using several points
connected by
straight lines
To observe the relationship between two related phenomena
6.
Bar Graph /Histogram
• A bar graph is
a pictorial
representation using
vertical and horizontal
bars in a graph
• A histogram is also
a pictorial
representation of data
using rectangular bars,
that are adjacent
to each other
To compare two or more facts with reference to a particular item
7.
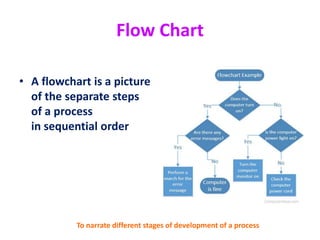
Flow Chart
• Aflowchart is a picture
of the separate steps
of a process
in sequential order
To narrate different stages of development of a process
8.
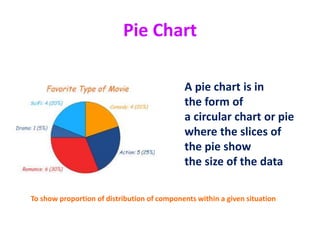
Pie Chart
A piechart is in
the form of
a circular chart or pie
where the slices of
the pie show
the size of the data
To show proportion of distribution of components within a given situation
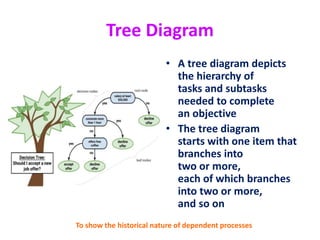
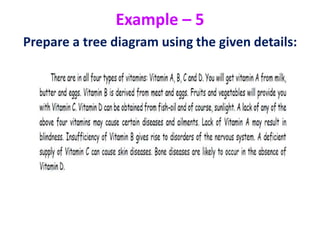
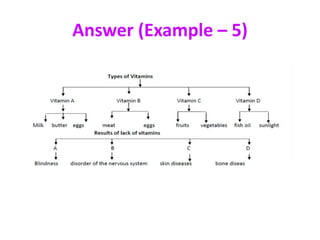
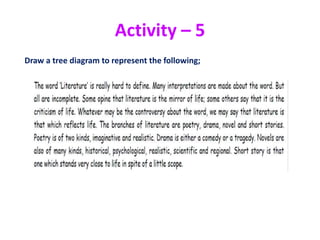
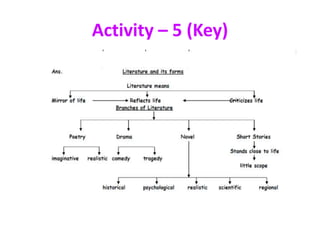
Tree Diagram
• Atree diagram depicts
the hierarchy of
tasks and subtasks
needed to complete
an objective
• The tree diagram
starts with one item that
branches into
two or more,
each of which branches
into two or more,
and so on
To show the historical nature of dependent processes
11.
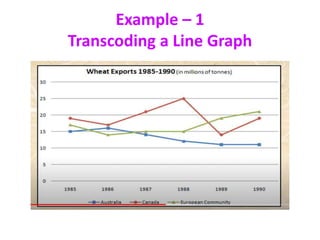
Transcoding
• Charts, technicaldiagrams and maps may be clear
to the designer or author,
but readers often have difficulty
discerning a meaning
• Transcoding is often used to convert
one format into another
• Moving data from a chart to continuous writing
or vice versa is transcoding
12.
Procedure for Transcoding
•Observe the given chart
• Understand the idea
• Interpret / Infer messages from the figures
• Prepare a rough draft
• Arrange it logically
• Begin the paragraph with a topic sentence
• Use discourse markers
13.
Discourse Markers
in continuouswriting
• Discourse markers are expressions
that are used to show how a discourse
is constructed. For example –
– Balancing contrast points:
on the other hand, while, whereas…
– Emphasizing a contrast:
however, nevertheless, still, yet, in spite of this…
– Similarity: similarly, in the same way…
– Counter-argument: however, even so, but, nonetheless
– Structuring: first(ly), first of all, second(ly), lastly, finally
14.
Discourse Markers
in continuouswriting
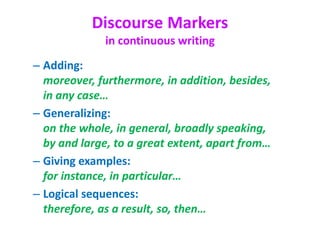
– Adding:
moreover, furthermore, in addition, besides,
in any case…
– Generalizing:
on the whole, in general, broadly speaking,
by and large, to a great extent, apart from…
– Giving examples:
for instance, in particular…
– Logical sequences:
therefore, as a result, so, then…
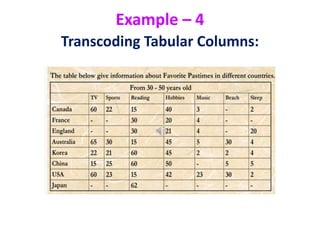
Answer (Example –2)
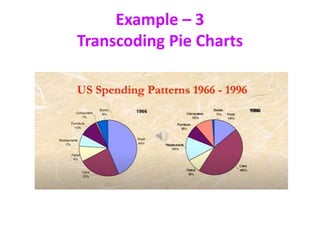
1. Introduction
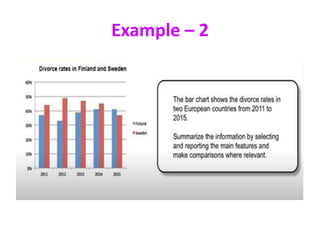
The bar chart provides information about the percentages of
divorces in Finland and Sweden between 2011 and 2015.
2. General Overview
Overall, Sweden experienced a downward trend, while Finland
showed an upward trend throughout the period. Both countries’
divorce rates had some fluctuations. Although Finland initially
had a lower rate, it outraced Sweden at the end of the period.
[Contd…
21.
Answer (Example –2)
3. Specific Details
Sweden’s divorce rate was about 45% in 2011, being higher than
Finland’s rate by approximately 8%. Then, it rose to almost fifty percent
in 2012. However, the figure showed a gradual decrease to about 47%
in 2013, and continued to decline steadily to the end of the period,
reaching around 45% in 2014 and hitting a low-point of about 37%
in 2015.
Percentage of divorces in Finland was less than 40% in 2011, and it
decreased in 2012, when about one third of marriages in Finland ended
with a divorce (as opposed to almost a half in Sweden). However, the
figure experienced a steady growth during the next two years. It rose
to approximately 39% in 2013, then increased by around 3% in 2014,
and remained steady for the next year, outracing the rate of Sweden.