SlideShare a Scribd company logo
1 of 1
Download to read offline
Effect of pH and Ionic Strength (Salinity) on Geochemical Water-Rock Interactions During
Hydraulic Fracturing in the Frontier Formation of the Powder River Basin, Wyoming
Bratcher, Jordan1, Herz-Thyhsen, Ryan1, Kaszuba, John1,2
1) Department of Geology and Geophysics, University of Wyoming 2) School of Energy Resources, University of Wyoming
Experimental Design
Experimental Design
Completion
Report
Fluid
Additives
USGS Data
Formation
Water
Geochemical
Model
Experimental
Frac Fluid
Chemical Field Purpose Mass Fraction
Frontier Fm. Water Solvent 86.9%
Bauxite Proppant 11%
HCl Dissolves Rock 0.12%
Tetramethylammonium Chloride Clay stabilizer 0.088%
Methanol
Prevents corrosion and reduces
friction
0.07%
Sodium Erythorbate Prevents metal precipitation 0.0009%
Results
Conclusions
Future Work
Acknowledgements and References
0.01
0.1
1
10
100
1000
10000
-50 0 50 100 150
Conc.(mol/kg)
Time (hrs)
Neutral pH Experiment
0.01
0.1
1
10
100
1000
10000
-50 0 50 100 150
Time (hrs)
Low pH Experiment
SiSi
Ca
Ca
Li Li
Sr
Sr
Ab
Qtz
50 m
Cc
Qtz
50 m
0.13
0.135
0.14
0.145
0.15
0.155
0
1
2
3
4
5
6
7
8
-50 50 150 250 350 450 550 650
pH
pH of Neutral
Experiment
pH of low pH
Experiment
Ionic Strength of
Neutral pH
Experiment
Ionic Strength of
Low pH
Experiment
I(molal)
Time (hrs)
Experimental pH and Ionic Strength vs. Predictive Model Model
87% Water
2% Additives
11%
Proppant
Figure 2: Percent composition of frac fluid by
volume. Water is by far the most important
component.
Background
Hornbuckle 1-11H
Herz-Thyhsen, 2014 (unpublished)
Figure 4: Hornbuckle 1-11H well located in the
southwest corner of the Powder River Basin.
Figure 3: Experimental Apparatus. Pressure vessel consists of a stainless steel
bomb housing a flexible gold bag capable of sampling during experimentation
while maintaining constant temperature and pressure.
Figure 1: Hydraulic fracturing overview. Large
volumes of fresh water are needed to fracture a
well which needs to be collected for treatment
and disposal after production.
http://imgbuddy.com/hydraulic-fracturing.asp
ii
i
Quartz
64%
Calcite
20%
Illite
10%
Albite 5% Pyrite 1%
i
iii
iii
• USGS data from the
surrounding research area
were compared to
geochemical models to
design the Frontier Fm.
water chemistry (Figure 7)
• Geochemical model allows
Frontier Fm. mineralogy
(Figure 6) to equilibrate with
water. Water chemistry
generated by model
approximates average USGS
Frontier Fm. chemistry well
(Figure 7)
Figure 6: Simplified Frontier Fm. composition.
Five minerals were chosen to represent the
Frontier Fm. for use in geochemical models
(Herz-Thyhsen, 2014 (unpublished)).
Well Data
Average
Model
ii
Figure 7: Development of Frontier Fm. water chemistry. Blue triangles represent USGS Frontier
Fm. water chemistry taken from surrounding wells. Red circle is the statistical average of blue
triangles. Green star represents formation water predicted by geochemical model.
Figure 5: Development of experimental frac fluid.
Data from several different sources were used to
develop the frac fluid composition used in
experiments.
Figure 8: Experimental frac fluid chemistry. Fluid additives were selected from the Hornbuckle
1-11H (Figure 4) completion report based on functionality, lab safety, and accessibility (Herz-
Thyhsen, 2014 (unpublished)).
• 4 experiments over a range of pH
and ionic strengths take place for a
month at a time each (Figure 9)
• Geochemical models are used to
predict and analyze experimental
results
• Rock samples are taken from the
Frontier Fm. interval of Hornbuckle
1-11H core (Figure 4), reacted with
frac fluid, and both liquids and solids
are analyzed
• Data from 84 wells
surrounding the Hornbuckle
1-11H were averaged and
compared to geochemical
model results (Figure 7)
• Experimental ionic
strength range
designed to represent
naturally existing ionic
strength range in
Frontier Fm. water and
extended to include
more saline flowback/
produced waters
• Make use of produced
and flowback waters
• Free up freshwater for
other uses
• Mitigate transport,
treatment, and
disposal costs
• Predict and track
downhole changes
quickly
Research Impacts
• Calcite and albite both show strong dissolution features among
experiments however calcite is much more sensitive to low pH
• Geochemical model predicts pH, ionic strength, and most major
aqueous species within reasonable accuracy
• This information forms a basis for predicting and tracing downhole
chemical changes based on frac fluid chemistry
• Understanding downhole chemistry is the first step to replacing
freshwater with produced/flowback water in hydraulic fracturing
• Compare results of
experiments 1, 2, and 3 to
better understand the
effect of ionic strength on
geochemical water-rock
interactions
Funding/ Support: UW Cretaceous Tight Oil Consortium II, School of Energy Resources
Laboratory/Technical Aid: Norbert Swoboda-Colberg, Susan Swapp, Janet Dewey, Virginia Marcon, Alexa Socianu,
Quin Miller, Jonathan Pullam, Bianca Majumder, Amber Zandanel
References
• Heier “Trace Elements in Feldspars-A Review” Norsk. Geol. Tidsskr., v. 42, 415-454
• Paquette and Reeder “Relationship Between Surface Structure, Growth Mechanism, and Trace Element
Incorporation in Calcite” Geochimica et Cosmochimica Acta, v. 59, 735-749
Experimental Design
0.01
0.1
1
10
100
1000
10000
100000
1000000
-50 0 50 100 150 200 250 300 350 400 450 500 550 600 650
Conc.(mol/kg)
Time (hrs)
Neutral pH Experiment
SO4
Cl
Na
K
Mg
Ca
Si
Li
Sr
Al
Model
Initial pH = 7.3
T = 115 C
P = 350 bar
I = ~0.15 molal
0.01
0.1
1
10
100
1000
10000
100000
1000000
-50 0 50 100 150 200 250 300 350 400 450 500 550 600 650
Conc.(mol/kg)
Time (hrs)
SO4
Cl
Na
K
Mg
Si
Li
Sr
Al
ModelLow pH Experiment
Initial pH = 7.3
T = 115 C
P = 350 bar
I = ~0.15 molal
Figure 9: Initial conditions of each experiment.
Subsequent figures focus on the effect of pH on
geochemical reactions (expt. 2 and 4).
• Geochemical model
adequately predicts pH
• Ionic strength predictions
within 10% difference
• Geochemical model
accurately predicts
concentrations of most
aqueous species for
experiments 2 and 4
Figure 9: SEM images of dissolving albite (left) and calcite (right) in reacted chips. While both
minerals show dissolution features, calcite shows a stronger dissolution response to low pH.
Fluid Characterization
Figure 10: Comparison of pH and ionic strength for experiments 2 and 4 to predictive model.
Model predicts pH of both low and neutral experiments well while ionic strength is still within
10% difference.
Figure 11: Comparison of aqueous species of experiment 4 to predictive model. Na, Cl, SO4,
and Si are predicted well by model while K and Ca are predicted to be lower concentrations.
Figure 12: Comparison of aqueous species from experiment 2 to predictive model. Ca and K
are still predicted at lower concentrations. Noticeable differences between experiment 2 and
4 are the elevated concentrations of Ca, Sr, and Mg.
Figure 13: Comparison of major and minor elements associated with calcite and albite
between experiments 2 and 4. Ca and Sr show the strongest response to low pH conditions
indicating an increase in dissolution of calcite. Li and Si show little response meaning albite
dissolution is relatively unaffected by changing pH on experimental time scales.
• Fresh water usage in
hydraulic fracturing is critical
(Figure 1 and 2)
• 2 - 8 million gallons
freshwater required per well
(USGS)
• Freshwater typically hauled
to drilling sites
• Wastewater is collected
during production to be
treated and disposed of
(Figure 1)
• The potential to replace
freshwater with produced
and flowback water exists
• The ability to use
geochemical analysis and
models to predict and
track downhole changes
in siliciclastic reservoirs
such as the Frontier
Formation is appealing
Results
Robert Kirkwood – background image
Seyfried et al., 1987
Gold Bag
Sample Port
Pressure Vessel

More Related Content

What's hot

Effect of physico-chemical pretreatment on the removal [Read-Only] [Compatibi...
Effect of physico-chemical pretreatment on the removal [Read-Only] [Compatibi...Effect of physico-chemical pretreatment on the removal [Read-Only] [Compatibi...
Effect of physico-chemical pretreatment on the removal [Read-Only] [Compatibi...MUNANURA JAMES
 
Molofsky_et_al-2016-Groundwater
Molofsky_et_al-2016-GroundwaterMolofsky_et_al-2016-Groundwater
Molofsky_et_al-2016-GroundwaterLisa Molofsky
 
Dow Wetlands Restoration Project
Dow Wetlands Restoration ProjectDow Wetlands Restoration Project
Dow Wetlands Restoration ProjectWilliam Mavrode
 
Suitability Assessment of Shallow Groundwater of a Typical Coastal Aquifers f...
Suitability Assessment of Shallow Groundwater of a Typical Coastal Aquifers f...Suitability Assessment of Shallow Groundwater of a Typical Coastal Aquifers f...
Suitability Assessment of Shallow Groundwater of a Typical Coastal Aquifers f...iosrjce
 
adewale_SADIQ_seminar_submitted
adewale_SADIQ_seminar_submittedadewale_SADIQ_seminar_submitted
adewale_SADIQ_seminar_submittedadewale SADIQ
 
Water Quality Assessment through GIS: A Case Study of Sukhna Lake, Chandigarh...
Water Quality Assessment through GIS: A Case Study of Sukhna Lake, Chandigarh...Water Quality Assessment through GIS: A Case Study of Sukhna Lake, Chandigarh...
Water Quality Assessment through GIS: A Case Study of Sukhna Lake, Chandigarh...IRJET Journal
 
Quantitative water quality survey of wetland habitats at a contaminated brown...
Quantitative water quality survey of wetland habitats at a contaminated brown...Quantitative water quality survey of wetland habitats at a contaminated brown...
Quantitative water quality survey of wetland habitats at a contaminated brown...David Bryan
 
Water Quality Assessment of VIT University “Green” Lake Using GIS
Water Quality Assessment of VIT University “Green” Lake Using GISWater Quality Assessment of VIT University “Green” Lake Using GIS
Water Quality Assessment of VIT University “Green” Lake Using GISinventionjournals
 
Water and Health Issues and Opportunities
Water and Health Issues and OpportunitiesWater and Health Issues and Opportunities
Water and Health Issues and OpportunitiesNebraska Water Center
 
Assessment-of-Sediment-Quality-in-Hussainsagar-Lake-and-Its-Inlet-Channels
Assessment-of-Sediment-Quality-in-Hussainsagar-Lake-and-Its-Inlet-ChannelsAssessment-of-Sediment-Quality-in-Hussainsagar-Lake-and-Its-Inlet-Channels
Assessment-of-Sediment-Quality-in-Hussainsagar-Lake-and-Its-Inlet-ChannelsSathyanarayana .
 
Water Quality Modeling for Groundwater, Surface Water, and Watersheds: Basic ...
Water Quality Modeling for Groundwater, Surface Water, and Watersheds: Basic ...Water Quality Modeling for Groundwater, Surface Water, and Watersheds: Basic ...
Water Quality Modeling for Groundwater, Surface Water, and Watersheds: Basic ...Nebraska Water Center
 
WATER QUALITY MODELING DR. YANTI
WATER QUALITY MODELING DR. YANTIWATER QUALITY MODELING DR. YANTI
WATER QUALITY MODELING DR. YANTIPebri Nurhayati
 
Harbor-Wide Water Quality Monitoring Report for the New York-New Jersey Harbo...
Harbor-Wide Water Quality Monitoring Report for the New York-New Jersey Harbo...Harbor-Wide Water Quality Monitoring Report for the New York-New Jersey Harbo...
Harbor-Wide Water Quality Monitoring Report for the New York-New Jersey Harbo...hudsonriverfoundation
 
Graphical presentation and classification for assessment of Ground water Qual...
Graphical presentation and classification for assessment of Ground water Qual...Graphical presentation and classification for assessment of Ground water Qual...
Graphical presentation and classification for assessment of Ground water Qual...Indian School of Mines, Dhanbad, India
 
Determination of k 2
Determination of k 2Determination of k 2
Determination of k 2MD AL-AMIN
 
Mp gw ground water quality in jabalpur urban area with emphasis on transport ...
Mp gw ground water quality in jabalpur urban area with emphasis on transport ...Mp gw ground water quality in jabalpur urban area with emphasis on transport ...
Mp gw ground water quality in jabalpur urban area with emphasis on transport ...hydrologywebsite1
 
11.application of principal component analysis & multiple regression models i...
11.application of principal component analysis & multiple regression models i...11.application of principal component analysis & multiple regression models i...
11.application of principal component analysis & multiple regression models i...Alexander Decker
 
DIMENSIONAL ANALYSIS DESIGN MODEL OF BIOCHEMICAL OXYGEN DEMAND IN INTEGRATED ...
DIMENSIONAL ANALYSIS DESIGN MODEL OF BIOCHEMICAL OXYGEN DEMAND IN INTEGRATED ...DIMENSIONAL ANALYSIS DESIGN MODEL OF BIOCHEMICAL OXYGEN DEMAND IN INTEGRATED ...
DIMENSIONAL ANALYSIS DESIGN MODEL OF BIOCHEMICAL OXYGEN DEMAND IN INTEGRATED ...IAEME Publication
 

What's hot (20)

Lake Water Environment Capacity Analysis Based on Steady-State Model
Lake Water Environment Capacity Analysis Based on Steady-State ModelLake Water Environment Capacity Analysis Based on Steady-State Model
Lake Water Environment Capacity Analysis Based on Steady-State Model
 
Effect of physico-chemical pretreatment on the removal [Read-Only] [Compatibi...
Effect of physico-chemical pretreatment on the removal [Read-Only] [Compatibi...Effect of physico-chemical pretreatment on the removal [Read-Only] [Compatibi...
Effect of physico-chemical pretreatment on the removal [Read-Only] [Compatibi...
 
Molofsky_et_al-2016-Groundwater
Molofsky_et_al-2016-GroundwaterMolofsky_et_al-2016-Groundwater
Molofsky_et_al-2016-Groundwater
 
Dow Wetlands Restoration Project
Dow Wetlands Restoration ProjectDow Wetlands Restoration Project
Dow Wetlands Restoration Project
 
Suitability Assessment of Shallow Groundwater of a Typical Coastal Aquifers f...
Suitability Assessment of Shallow Groundwater of a Typical Coastal Aquifers f...Suitability Assessment of Shallow Groundwater of a Typical Coastal Aquifers f...
Suitability Assessment of Shallow Groundwater of a Typical Coastal Aquifers f...
 
adewale_SADIQ_seminar_submitted
adewale_SADIQ_seminar_submittedadewale_SADIQ_seminar_submitted
adewale_SADIQ_seminar_submitted
 
Water Quality Assessment through GIS: A Case Study of Sukhna Lake, Chandigarh...
Water Quality Assessment through GIS: A Case Study of Sukhna Lake, Chandigarh...Water Quality Assessment through GIS: A Case Study of Sukhna Lake, Chandigarh...
Water Quality Assessment through GIS: A Case Study of Sukhna Lake, Chandigarh...
 
Quantitative water quality survey of wetland habitats at a contaminated brown...
Quantitative water quality survey of wetland habitats at a contaminated brown...Quantitative water quality survey of wetland habitats at a contaminated brown...
Quantitative water quality survey of wetland habitats at a contaminated brown...
 
Water Quality Assessment of VIT University “Green” Lake Using GIS
Water Quality Assessment of VIT University “Green” Lake Using GISWater Quality Assessment of VIT University “Green” Lake Using GIS
Water Quality Assessment of VIT University “Green” Lake Using GIS
 
Water and Health Issues and Opportunities
Water and Health Issues and OpportunitiesWater and Health Issues and Opportunities
Water and Health Issues and Opportunities
 
Assessment-of-Sediment-Quality-in-Hussainsagar-Lake-and-Its-Inlet-Channels
Assessment-of-Sediment-Quality-in-Hussainsagar-Lake-and-Its-Inlet-ChannelsAssessment-of-Sediment-Quality-in-Hussainsagar-Lake-and-Its-Inlet-Channels
Assessment-of-Sediment-Quality-in-Hussainsagar-Lake-and-Its-Inlet-Channels
 
Jabari Lee Poster
Jabari Lee PosterJabari Lee Poster
Jabari Lee Poster
 
Water Quality Modeling for Groundwater, Surface Water, and Watersheds: Basic ...
Water Quality Modeling for Groundwater, Surface Water, and Watersheds: Basic ...Water Quality Modeling for Groundwater, Surface Water, and Watersheds: Basic ...
Water Quality Modeling for Groundwater, Surface Water, and Watersheds: Basic ...
 
WATER QUALITY MODELING DR. YANTI
WATER QUALITY MODELING DR. YANTIWATER QUALITY MODELING DR. YANTI
WATER QUALITY MODELING DR. YANTI
 
Harbor-Wide Water Quality Monitoring Report for the New York-New Jersey Harbo...
Harbor-Wide Water Quality Monitoring Report for the New York-New Jersey Harbo...Harbor-Wide Water Quality Monitoring Report for the New York-New Jersey Harbo...
Harbor-Wide Water Quality Monitoring Report for the New York-New Jersey Harbo...
 
Graphical presentation and classification for assessment of Ground water Qual...
Graphical presentation and classification for assessment of Ground water Qual...Graphical presentation and classification for assessment of Ground water Qual...
Graphical presentation and classification for assessment of Ground water Qual...
 
Determination of k 2
Determination of k 2Determination of k 2
Determination of k 2
 
Mp gw ground water quality in jabalpur urban area with emphasis on transport ...
Mp gw ground water quality in jabalpur urban area with emphasis on transport ...Mp gw ground water quality in jabalpur urban area with emphasis on transport ...
Mp gw ground water quality in jabalpur urban area with emphasis on transport ...
 
11.application of principal component analysis & multiple regression models i...
11.application of principal component analysis & multiple regression models i...11.application of principal component analysis & multiple regression models i...
11.application of principal component analysis & multiple regression models i...
 
DIMENSIONAL ANALYSIS DESIGN MODEL OF BIOCHEMICAL OXYGEN DEMAND IN INTEGRATED ...
DIMENSIONAL ANALYSIS DESIGN MODEL OF BIOCHEMICAL OXYGEN DEMAND IN INTEGRATED ...DIMENSIONAL ANALYSIS DESIGN MODEL OF BIOCHEMICAL OXYGEN DEMAND IN INTEGRATED ...
DIMENSIONAL ANALYSIS DESIGN MODEL OF BIOCHEMICAL OXYGEN DEMAND IN INTEGRATED ...
 

Viewers also liked

REACTION KINETICS
REACTION KINETICSREACTION KINETICS
REACTION KINETICSAsra Hameed
 
Reaction Kinetics
Reaction KineticsReaction Kinetics
Reaction Kineticsmiss j
 
Chemical Kinetics
Chemical KineticsChemical Kinetics
Chemical Kineticsjc762006
 
Chapter 14 Lecture- Chemical Kinetics
Chapter 14 Lecture- Chemical KineticsChapter 14 Lecture- Chemical Kinetics
Chapter 14 Lecture- Chemical KineticsMary Beth Smith
 

Viewers also liked (6)

P05 Chemical Kinetics
P05 Chemical KineticsP05 Chemical Kinetics
P05 Chemical Kinetics
 
REACTION KINETICS
REACTION KINETICSREACTION KINETICS
REACTION KINETICS
 
Reaction Kinetics
Reaction KineticsReaction Kinetics
Reaction Kinetics
 
Chemical Kinetics
Chemical KineticsChemical Kinetics
Chemical Kinetics
 
Chapter 14 Lecture- Chemical Kinetics
Chapter 14 Lecture- Chemical KineticsChapter 14 Lecture- Chemical Kinetics
Chapter 14 Lecture- Chemical Kinetics
 
Chemical kinetics presentation
Chemical kinetics   presentationChemical kinetics   presentation
Chemical kinetics presentation
 

Similar to RMR_Poster_Final

An investigation on role of salinity, pH and DO on heavy metals elimination t...
An investigation on role of salinity, pH and DO on heavy metals elimination t...An investigation on role of salinity, pH and DO on heavy metals elimination t...
An investigation on role of salinity, pH and DO on heavy metals elimination t...GJESM Publication
 
Evaluation and and comparison of of water qualityparameters from from fresh ...
Evaluation and and comparison of of water qualityparameters  from from fresh ...Evaluation and and comparison of of water qualityparameters  from from fresh ...
Evaluation and and comparison of of water qualityparameters from from fresh ...Alexander Decker
 
ISOTOPE BUDGETS.pptx
ISOTOPE BUDGETS.pptxISOTOPE BUDGETS.pptx
ISOTOPE BUDGETS.pptxHarsha42681
 
Environmental Qualitative assessment of rivers sediments
Environmental Qualitative assessment of rivers sedimentsEnvironmental Qualitative assessment of rivers sediments
Environmental Qualitative assessment of rivers sedimentsGJESM Publication
 
Water quality assessment and application of the hydrochemistry
Water quality assessment and application of the hydrochemistryWater quality assessment and application of the hydrochemistry
Water quality assessment and application of the hydrochemistryAlexander Decker
 
An Experimental Study on the Migration of Pb in the Groundwater Table Fluctua...
An Experimental Study on the Migration of Pb in the Groundwater Table Fluctua...An Experimental Study on the Migration of Pb in the Groundwater Table Fluctua...
An Experimental Study on the Migration of Pb in the Groundwater Table Fluctua...NOMADPOWER
 
Hydrogen bonding and molecular design (BrazMedChem 2010)
Hydrogen bonding and molecular design (BrazMedChem 2010)Hydrogen bonding and molecular design (BrazMedChem 2010)
Hydrogen bonding and molecular design (BrazMedChem 2010)Peter Kenny
 
Studies of Hydrogeochemical in Groundwater Quality around Chakghat Area, Rew...
Studies of Hydrogeochemical in Groundwater Quality around Chakghat  Area, Rew...Studies of Hydrogeochemical in Groundwater Quality around Chakghat  Area, Rew...
Studies of Hydrogeochemical in Groundwater Quality around Chakghat Area, Rew...IJMER
 
Modeling of Predictive interaction of Water Parameters in Groundwater
Modeling of Predictive interaction of Water Parameters in GroundwaterModeling of Predictive interaction of Water Parameters in Groundwater
Modeling of Predictive interaction of Water Parameters in Groundwaterijtsrd
 
FINAL Chemosphere 168_435_440
FINAL Chemosphere 168_435_440FINAL Chemosphere 168_435_440
FINAL Chemosphere 168_435_440Guy Gilron
 
Baseline Water Study of 113 Wells in Chenango County, NY
Baseline Water Study of 113 Wells in Chenango County, NYBaseline Water Study of 113 Wells in Chenango County, NY
Baseline Water Study of 113 Wells in Chenango County, NYMarcellus Drilling News
 
EVALUATION OF GROUNDWATER QUALITY OF VAIPPAR BASIN, TAMIL NADU, INDIA: A GEOI...
EVALUATION OF GROUNDWATER QUALITY OF VAIPPAR BASIN, TAMIL NADU, INDIA: A GEOI...EVALUATION OF GROUNDWATER QUALITY OF VAIPPAR BASIN, TAMIL NADU, INDIA: A GEOI...
EVALUATION OF GROUNDWATER QUALITY OF VAIPPAR BASIN, TAMIL NADU, INDIA: A GEOI...SagarChougule11
 
Poster_Housela_Updated_10_26
Poster_Housela_Updated_10_26Poster_Housela_Updated_10_26
Poster_Housela_Updated_10_26Lindsay House
 

Similar to RMR_Poster_Final (20)

Lab Report 1
Lab Report 1Lab Report 1
Lab Report 1
 
An investigation on role of salinity, pH and DO on heavy metals elimination t...
An investigation on role of salinity, pH and DO on heavy metals elimination t...An investigation on role of salinity, pH and DO on heavy metals elimination t...
An investigation on role of salinity, pH and DO on heavy metals elimination t...
 
Evaluation and and comparison of of water qualityparameters from from fresh ...
Evaluation and and comparison of of water qualityparameters  from from fresh ...Evaluation and and comparison of of water qualityparameters  from from fresh ...
Evaluation and and comparison of of water qualityparameters from from fresh ...
 
ISOTOPE BUDGETS.pptx
ISOTOPE BUDGETS.pptxISOTOPE BUDGETS.pptx
ISOTOPE BUDGETS.pptx
 
Environmental Qualitative assessment of rivers sediments
Environmental Qualitative assessment of rivers sedimentsEnvironmental Qualitative assessment of rivers sediments
Environmental Qualitative assessment of rivers sediments
 
revised11
revised11revised11
revised11
 
AAPG_2016_Bratcher
AAPG_2016_BratcherAAPG_2016_Bratcher
AAPG_2016_Bratcher
 
Water quality assessment and application of the hydrochemistry
Water quality assessment and application of the hydrochemistryWater quality assessment and application of the hydrochemistry
Water quality assessment and application of the hydrochemistry
 
H0413437
H0413437H0413437
H0413437
 
An Experimental Study on the Migration of Pb in the Groundwater Table Fluctua...
An Experimental Study on the Migration of Pb in the Groundwater Table Fluctua...An Experimental Study on the Migration of Pb in the Groundwater Table Fluctua...
An Experimental Study on the Migration of Pb in the Groundwater Table Fluctua...
 
Hydrogen bonding and molecular design (BrazMedChem 2010)
Hydrogen bonding and molecular design (BrazMedChem 2010)Hydrogen bonding and molecular design (BrazMedChem 2010)
Hydrogen bonding and molecular design (BrazMedChem 2010)
 
Studies of Hydrogeochemical in Groundwater Quality around Chakghat Area, Rew...
Studies of Hydrogeochemical in Groundwater Quality around Chakghat  Area, Rew...Studies of Hydrogeochemical in Groundwater Quality around Chakghat  Area, Rew...
Studies of Hydrogeochemical in Groundwater Quality around Chakghat Area, Rew...
 
Modeling of Predictive interaction of Water Parameters in Groundwater
Modeling of Predictive interaction of Water Parameters in GroundwaterModeling of Predictive interaction of Water Parameters in Groundwater
Modeling of Predictive interaction of Water Parameters in Groundwater
 
FINAL Chemosphere 168_435_440
FINAL Chemosphere 168_435_440FINAL Chemosphere 168_435_440
FINAL Chemosphere 168_435_440
 
IMWA2009_Turner
IMWA2009_TurnerIMWA2009_Turner
IMWA2009_Turner
 
Baseline Water Study of 113 Wells in Chenango County, NY
Baseline Water Study of 113 Wells in Chenango County, NYBaseline Water Study of 113 Wells in Chenango County, NY
Baseline Water Study of 113 Wells in Chenango County, NY
 
EVALUATION OF GROUNDWATER QUALITY OF VAIPPAR BASIN, TAMIL NADU, INDIA: A GEOI...
EVALUATION OF GROUNDWATER QUALITY OF VAIPPAR BASIN, TAMIL NADU, INDIA: A GEOI...EVALUATION OF GROUNDWATER QUALITY OF VAIPPAR BASIN, TAMIL NADU, INDIA: A GEOI...
EVALUATION OF GROUNDWATER QUALITY OF VAIPPAR BASIN, TAMIL NADU, INDIA: A GEOI...
 
Fields-Sommers_SFS_presentation
Fields-Sommers_SFS_presentationFields-Sommers_SFS_presentation
Fields-Sommers_SFS_presentation
 
Aijrfans14 233
Aijrfans14 233Aijrfans14 233
Aijrfans14 233
 
Poster_Housela_Updated_10_26
Poster_Housela_Updated_10_26Poster_Housela_Updated_10_26
Poster_Housela_Updated_10_26
 

RMR_Poster_Final

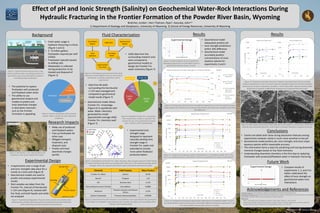
  • 1. Effect of pH and Ionic Strength (Salinity) on Geochemical Water-Rock Interactions During Hydraulic Fracturing in the Frontier Formation of the Powder River Basin, Wyoming Bratcher, Jordan1, Herz-Thyhsen, Ryan1, Kaszuba, John1,2 1) Department of Geology and Geophysics, University of Wyoming 2) School of Energy Resources, University of Wyoming Experimental Design Experimental Design Completion Report Fluid Additives USGS Data Formation Water Geochemical Model Experimental Frac Fluid Chemical Field Purpose Mass Fraction Frontier Fm. Water Solvent 86.9% Bauxite Proppant 11% HCl Dissolves Rock 0.12% Tetramethylammonium Chloride Clay stabilizer 0.088% Methanol Prevents corrosion and reduces friction 0.07% Sodium Erythorbate Prevents metal precipitation 0.0009% Results Conclusions Future Work Acknowledgements and References 0.01 0.1 1 10 100 1000 10000 -50 0 50 100 150 Conc.(mol/kg) Time (hrs) Neutral pH Experiment 0.01 0.1 1 10 100 1000 10000 -50 0 50 100 150 Time (hrs) Low pH Experiment SiSi Ca Ca Li Li Sr Sr Ab Qtz 50 m Cc Qtz 50 m 0.13 0.135 0.14 0.145 0.15 0.155 0 1 2 3 4 5 6 7 8 -50 50 150 250 350 450 550 650 pH pH of Neutral Experiment pH of low pH Experiment Ionic Strength of Neutral pH Experiment Ionic Strength of Low pH Experiment I(molal) Time (hrs) Experimental pH and Ionic Strength vs. Predictive Model Model 87% Water 2% Additives 11% Proppant Figure 2: Percent composition of frac fluid by volume. Water is by far the most important component. Background Hornbuckle 1-11H Herz-Thyhsen, 2014 (unpublished) Figure 4: Hornbuckle 1-11H well located in the southwest corner of the Powder River Basin. Figure 3: Experimental Apparatus. Pressure vessel consists of a stainless steel bomb housing a flexible gold bag capable of sampling during experimentation while maintaining constant temperature and pressure. Figure 1: Hydraulic fracturing overview. Large volumes of fresh water are needed to fracture a well which needs to be collected for treatment and disposal after production. http://imgbuddy.com/hydraulic-fracturing.asp ii i Quartz 64% Calcite 20% Illite 10% Albite 5% Pyrite 1% i iii iii • USGS data from the surrounding research area were compared to geochemical models to design the Frontier Fm. water chemistry (Figure 7) • Geochemical model allows Frontier Fm. mineralogy (Figure 6) to equilibrate with water. Water chemistry generated by model approximates average USGS Frontier Fm. chemistry well (Figure 7) Figure 6: Simplified Frontier Fm. composition. Five minerals were chosen to represent the Frontier Fm. for use in geochemical models (Herz-Thyhsen, 2014 (unpublished)). Well Data Average Model ii Figure 7: Development of Frontier Fm. water chemistry. Blue triangles represent USGS Frontier Fm. water chemistry taken from surrounding wells. Red circle is the statistical average of blue triangles. Green star represents formation water predicted by geochemical model. Figure 5: Development of experimental frac fluid. Data from several different sources were used to develop the frac fluid composition used in experiments. Figure 8: Experimental frac fluid chemistry. Fluid additives were selected from the Hornbuckle 1-11H (Figure 4) completion report based on functionality, lab safety, and accessibility (Herz- Thyhsen, 2014 (unpublished)). • 4 experiments over a range of pH and ionic strengths take place for a month at a time each (Figure 9) • Geochemical models are used to predict and analyze experimental results • Rock samples are taken from the Frontier Fm. interval of Hornbuckle 1-11H core (Figure 4), reacted with frac fluid, and both liquids and solids are analyzed • Data from 84 wells surrounding the Hornbuckle 1-11H were averaged and compared to geochemical model results (Figure 7) • Experimental ionic strength range designed to represent naturally existing ionic strength range in Frontier Fm. water and extended to include more saline flowback/ produced waters • Make use of produced and flowback waters • Free up freshwater for other uses • Mitigate transport, treatment, and disposal costs • Predict and track downhole changes quickly Research Impacts • Calcite and albite both show strong dissolution features among experiments however calcite is much more sensitive to low pH • Geochemical model predicts pH, ionic strength, and most major aqueous species within reasonable accuracy • This information forms a basis for predicting and tracing downhole chemical changes based on frac fluid chemistry • Understanding downhole chemistry is the first step to replacing freshwater with produced/flowback water in hydraulic fracturing • Compare results of experiments 1, 2, and 3 to better understand the effect of ionic strength on geochemical water-rock interactions Funding/ Support: UW Cretaceous Tight Oil Consortium II, School of Energy Resources Laboratory/Technical Aid: Norbert Swoboda-Colberg, Susan Swapp, Janet Dewey, Virginia Marcon, Alexa Socianu, Quin Miller, Jonathan Pullam, Bianca Majumder, Amber Zandanel References • Heier “Trace Elements in Feldspars-A Review” Norsk. Geol. Tidsskr., v. 42, 415-454 • Paquette and Reeder “Relationship Between Surface Structure, Growth Mechanism, and Trace Element Incorporation in Calcite” Geochimica et Cosmochimica Acta, v. 59, 735-749 Experimental Design 0.01 0.1 1 10 100 1000 10000 100000 1000000 -50 0 50 100 150 200 250 300 350 400 450 500 550 600 650 Conc.(mol/kg) Time (hrs) Neutral pH Experiment SO4 Cl Na K Mg Ca Si Li Sr Al Model Initial pH = 7.3 T = 115 C P = 350 bar I = ~0.15 molal 0.01 0.1 1 10 100 1000 10000 100000 1000000 -50 0 50 100 150 200 250 300 350 400 450 500 550 600 650 Conc.(mol/kg) Time (hrs) SO4 Cl Na K Mg Si Li Sr Al ModelLow pH Experiment Initial pH = 7.3 T = 115 C P = 350 bar I = ~0.15 molal Figure 9: Initial conditions of each experiment. Subsequent figures focus on the effect of pH on geochemical reactions (expt. 2 and 4). • Geochemical model adequately predicts pH • Ionic strength predictions within 10% difference • Geochemical model accurately predicts concentrations of most aqueous species for experiments 2 and 4 Figure 9: SEM images of dissolving albite (left) and calcite (right) in reacted chips. While both minerals show dissolution features, calcite shows a stronger dissolution response to low pH. Fluid Characterization Figure 10: Comparison of pH and ionic strength for experiments 2 and 4 to predictive model. Model predicts pH of both low and neutral experiments well while ionic strength is still within 10% difference. Figure 11: Comparison of aqueous species of experiment 4 to predictive model. Na, Cl, SO4, and Si are predicted well by model while K and Ca are predicted to be lower concentrations. Figure 12: Comparison of aqueous species from experiment 2 to predictive model. Ca and K are still predicted at lower concentrations. Noticeable differences between experiment 2 and 4 are the elevated concentrations of Ca, Sr, and Mg. Figure 13: Comparison of major and minor elements associated with calcite and albite between experiments 2 and 4. Ca and Sr show the strongest response to low pH conditions indicating an increase in dissolution of calcite. Li and Si show little response meaning albite dissolution is relatively unaffected by changing pH on experimental time scales. • Fresh water usage in hydraulic fracturing is critical (Figure 1 and 2) • 2 - 8 million gallons freshwater required per well (USGS) • Freshwater typically hauled to drilling sites • Wastewater is collected during production to be treated and disposed of (Figure 1) • The potential to replace freshwater with produced and flowback water exists • The ability to use geochemical analysis and models to predict and track downhole changes in siliciclastic reservoirs such as the Frontier Formation is appealing Results Robert Kirkwood – background image Seyfried et al., 1987 Gold Bag Sample Port Pressure Vessel