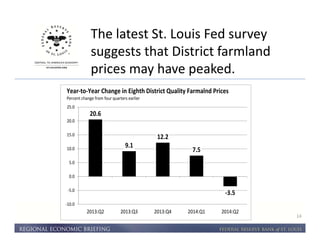
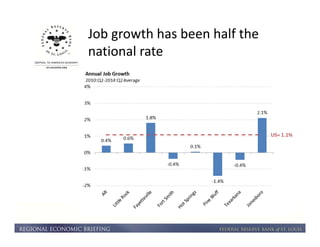
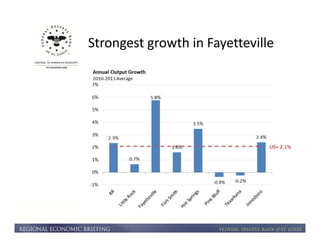
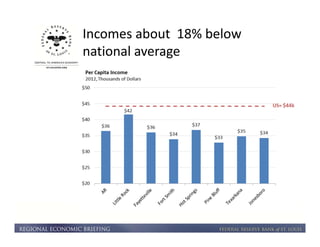
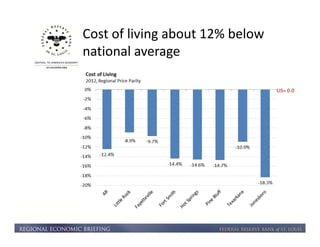
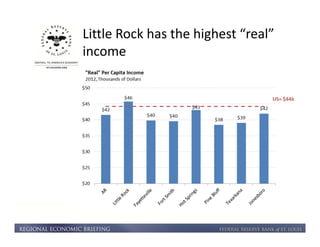
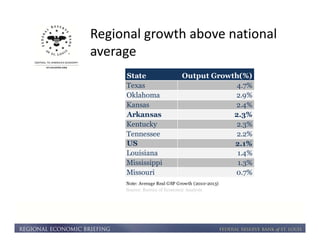
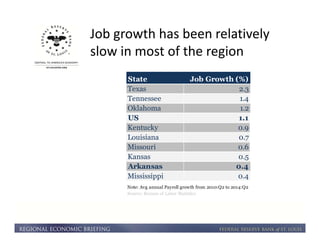
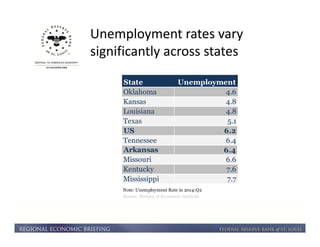
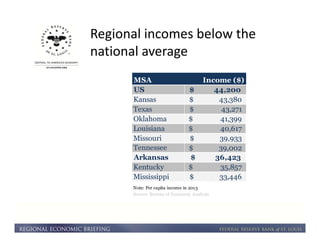
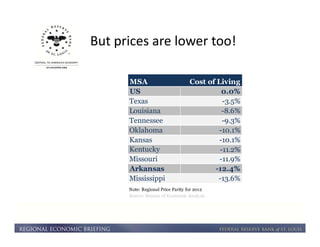
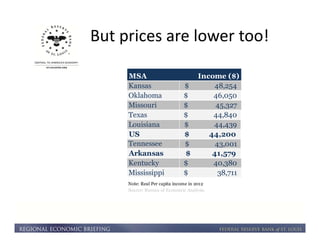
An Examination of 
Current Economic 
Conditions in the Nation 
and in Arkansas 
October 15, 2014 
Little Rock, AR 
Kevin L. Kliesen, 
FRB St. Louis 
Charles S. Gascon, 
FRB St. Louis 
Michael R. Pakko, 
UALR
Disclaimer 
The views we will express are our own 
and do not necessarily reflect the 
positions of the Federal Reserve Bank 
of St. Louis or the Federal Reserve 
System.
Uncertainty in Decision-making 
3 
• “There’s uncertainty about what the path of the 
economy will be.”—Chair Janet Yellen (June 18) 
• Information gleaned from our contacts helps to reduce 
this uncertainty. 
• A positive feedback loop: less uncertainty helps to 
create better policy, and thus better economic 
outcomes. 
• Forums like this are vitally important to the Fed!
A Brief on the U.S. Economy 
4 
• Momentum interrupted . . . Momentum restored. 
• Job growth has averaged more than 200,000/month 
this year and the unemployment rate continues to fall. 
• Inflation is slowing thanks to falling oil prices and slower 
growth of food and medical care prices. 
• This is good for the consumer.
Lower oil prices are mostly bullish 
for the near-term outlook. 
5 
Spot Crude Oil Prices: Brent 
Dollars per barrel 
120 
115 
110 
105 
100 
95 
90 
85 
Jan.2014 Mar.2014 May.2014 Jul.2014 Sep.2014 
Last observation: October 10, 2014
A Brief on the U.S. Economy 
6 
• Business capital spending appears to be on a more solid 
footing. 
• Housing has been more mixed, but still looks to be on 
an upward trajectory. 
• Less drag from government—expenditures and hiring 
are increasing modestly. 
• A stronger dollar and weaker global growth could 
pressure U.S. exports in Q4 and into 2015.
Financial stress levels have 
increased but still remain below 
average. 
7 
The St. Louis Fed's Financial Stress Index 
Weekly data 
1.5 
1.0 
0.5 
0.0 
-0.5 
-1.0 
-1.5 
European 
Turmoil, 2010 
Dec.09 Aug.10 Apr.11 Dec.11 Aug.12 Apr.13 Dec.13 Aug.14 
Last observation: Week of Oct. 3, 2014. 
S&P Downgrade, GDP Revision, 
and Europe, 2011 
European Turmoil, 
2012 
Week of 
June 18, 2013 FOMC 
Zero is 
“normal”
Lower levels of uncertainty bodes 
well for businesses and markets— 
and vice versa. 
8 
Economic Policy Uncertainty Index 
Mean=100 
275 
250 
225 
200 
175 
150 
125 
100 
75 
50 
Jan.2005 Oct.2006 Jul.2008 Apr.2010 Jan.2012 Oct.2013 
Last actual observation is September 2014
The Near-Term Outlook: 
The “Central Tendency” 
9 
• The Fed’s latest asset purchase program is coming to an 
end. 
• New exit strategy principles established. 
• However, markets believe that the return to a “normal” 
policy rate will be a slow process. 
• Depends on the evolution of the data, though.
FOMC Participants: Stronger 
growth, low inflation, and a falling 
unemployment rate. 
10 
September 2014 FOMC Economic Projections for 2014-2015 
Percent 
3.1 
7.0 
1.0 
2013 (A) 
2014 
2015 
2.1 
6.0 
1.6 
2.8 
5.5 
1.8 
8.0 
6.0 
4.0 
2.0 
0.0 
Real GDP Unemp. Rate Inflation 
NOTE: FOMC Projections are the mid-points of the central tendencies. The unemployment 
rate is the average of the fourth-quarter for the year indicated.
Risks to the economy and 
alternative views of the outlook. 
11 
• Some risks are known but are difficult to quantify 
(pandemics, geopolitical risks, etc.). 
• Signs of financial market excesses. 
• Global growth slows by more than expected. 
• The economy achieves “escape velocity” . . . the 
markets begin to worry that the Fed is behind the 
curve.
Fed Views vs. Market Views 
Expected Federal Funds Rates Estimated from Financial Futures Along with 
Median of SEP Projections 
Percent 
4.0 
3.5 
3.0 
2.5 
2.0 
1.5 
1.0 
0.5 
0.0 
2016 2017 
9/17/2014 
Median June '14 SEP Projection 
Median Sept '14 SEP Projection 
2015 
2014 
Oct.2014 Apr.2015 Oct.2015 Apr.2016 Oct.2016 Apr.2017 Oct.2017 Apr.2018 Oct.2018
• According to the St. Louis Fed’s latest report on agricultural 
credit conditions in the second quarter of 2014: 
– Farm income decreased modestly from a year earlier. 
– Quality farmland values averaged $5,473/acre, down slightly over 
the past year. 
– Bankers expect farm income and equipment expenditures in the 
third quarter to be sharply below last year’s levels. 
13
The latest St. Louis Fed survey 
suggests that District farmland 
prices may have peaked. 
14 
Year-to-Year Change in Eighth District Quality Farmalnd Prices 
Percent change from four quarters earlier 
20.6 
9.1 
12.2 
7.5 
-3.5 
25.0 
20.0 
15.0 
10.0 
5.0 
0.0 
-5.0 
-10.0 
2013:Q2 2013:Q3 2013:Q4 2014:Q1 2014:Q2
Four Looks at 
Arkansas’ Economy 
Charles S. Gascon 
Regional Economist, Sr. Research Support Coordinator 
October 15, 2014
A Look Back 
2006 2010 2013
Output is up 8%
Producing more with fewer workers
Shift in employment toward the 
service sector
Shift in employment toward the 
service sector
Shift in employment toward the 
service sector
Government payrolls shrinking 
since 2010
Manufacturing and construction 
sectors out almost 60,000 jobs
Housing prices have continued 
to recover…
…but demand remains sluggish
A Look From Above 
County Unemployment Rates, 2014:Q2
Unemployment rates consistent 
with national average
Job growth has been half the 
national rate
Strongest growth in Fayetteville
Incomes about 18% below 
national average
Cost of living about 12% below 
national average
Little Rock has the highest “real” 
income
A Look Around the Region 
Are we 
keeping up 
with the 
Joneses?
Regional growth above national 
average 
State Output Growth(%) 
Texas 4.7% 
Oklahoma 2.9% 
Kansas 2.4% 
Arkansas 2.3% 
Kentucky 2.3% 
Tennessee 2.2% 
US 2.1% 
Louisiana 1.4% 
Mississippi 1.3% 
Missouri 0.7% 
Note: Average Real GSP Growth (2010-2013) 
Source: Bureau of Economic Analysis
Job growth has been relatively 
slow in most of the region 
State Job Growth (%) 
Texas 2.3 
Tennessee 1.4 
Oklahoma 1.2 
US 1.1 
Kentucky 0.9 
Louisiana 0.7 
Missouri 0.6 
Kansas 0.5 
Arkansas 0.4 
Mississippi 0.4 
Note: Avg annual Payroll growth from 2010:Q2 to 2014:Q2 
Source: Bureau of Labor Statistics
Unemployment rates vary 
significantly across states 
State Unemployment 
Oklahoma 4.6 
Kansas 4.8 
Louisiana 4.8 
Texas 5.1 
US 6.2 
Tennessee 6.4 
Arkansas 6.4 
Missouri 6.6 
Kentucky 7.6 
Mississippi 7.7 
Note: Unemployment Rate in 2014:Q2 
Source: Bureau of Economic Analysis
Regional incomes below the 
national average 
MSA Income ($) 
US $ 4 4,200 
Kansas $ 43,380 
Texas $ 43,271 
Oklahoma $ 41,399 
Louisiana $ 40,617 
Missouri $ 39,933 
Tennessee $ 39,002 
Arkansas $ 36,423 
Kentucky $ 35,857 
Mississippi $ 3 3,446 
Note: Per capita income in 2013 
Source: Bureau of Economic Analysis
But prices are lower too! 
MSA Cost of Living 
US 0.0% 
Texas -3.5% 
Louisiana -8.6% 
Tennessee -9.3% 
Oklahoma -10.1% 
Kansas -10.1% 
Kentucky -11.2% 
Missouri -11.9% 
Arkansas -12.4% 
Mississippi -13.6% 
Note: Regional Price Parity for 2012 
Source: Bureau of Economic Analysis
But prices are lower too! 
MSA Income ($) 
Kansas $ 48,254 
Oklahoma $ 46,050 
Missouri $ 45,327 
Texas $ 44,840 
Louisiana $ 44,439 
US $ 4 4,200 
Tennessee $ 43,001 
Arkansas $ 4 1,579 
Kentucky $ 40,380 
Mississippi $ 38,711 
Note: Real Per capita income in 2012 
Source: Bureau of Economic Analysis
Business Outlook
Expectations for Local Economic 
Conditions
Expectations for Local Economic 
Conditions

Kliesen gascon october 15

  • 1.
    An Examination of Current Economic Conditions in the Nation and in Arkansas October 15, 2014 Little Rock, AR Kevin L. Kliesen, FRB St. Louis Charles S. Gascon, FRB St. Louis Michael R. Pakko, UALR
  • 2.
    Disclaimer The viewswe will express are our own and do not necessarily reflect the positions of the Federal Reserve Bank of St. Louis or the Federal Reserve System.
  • 3.
    Uncertainty in Decision-making 3 • “There’s uncertainty about what the path of the economy will be.”—Chair Janet Yellen (June 18) • Information gleaned from our contacts helps to reduce this uncertainty. • A positive feedback loop: less uncertainty helps to create better policy, and thus better economic outcomes. • Forums like this are vitally important to the Fed!
  • 4.
    A Brief onthe U.S. Economy 4 • Momentum interrupted . . . Momentum restored. • Job growth has averaged more than 200,000/month this year and the unemployment rate continues to fall. • Inflation is slowing thanks to falling oil prices and slower growth of food and medical care prices. • This is good for the consumer.
  • 5.
    Lower oil pricesare mostly bullish for the near-term outlook. 5 Spot Crude Oil Prices: Brent Dollars per barrel 120 115 110 105 100 95 90 85 Jan.2014 Mar.2014 May.2014 Jul.2014 Sep.2014 Last observation: October 10, 2014
  • 6.
    A Brief onthe U.S. Economy 6 • Business capital spending appears to be on a more solid footing. • Housing has been more mixed, but still looks to be on an upward trajectory. • Less drag from government—expenditures and hiring are increasing modestly. • A stronger dollar and weaker global growth could pressure U.S. exports in Q4 and into 2015.
  • 7.
    Financial stress levelshave increased but still remain below average. 7 The St. Louis Fed's Financial Stress Index Weekly data 1.5 1.0 0.5 0.0 -0.5 -1.0 -1.5 European Turmoil, 2010 Dec.09 Aug.10 Apr.11 Dec.11 Aug.12 Apr.13 Dec.13 Aug.14 Last observation: Week of Oct. 3, 2014. S&P Downgrade, GDP Revision, and Europe, 2011 European Turmoil, 2012 Week of June 18, 2013 FOMC Zero is “normal”
  • 8.
    Lower levels ofuncertainty bodes well for businesses and markets— and vice versa. 8 Economic Policy Uncertainty Index Mean=100 275 250 225 200 175 150 125 100 75 50 Jan.2005 Oct.2006 Jul.2008 Apr.2010 Jan.2012 Oct.2013 Last actual observation is September 2014
  • 9.
    The Near-Term Outlook: The “Central Tendency” 9 • The Fed’s latest asset purchase program is coming to an end. • New exit strategy principles established. • However, markets believe that the return to a “normal” policy rate will be a slow process. • Depends on the evolution of the data, though.
  • 10.
    FOMC Participants: Stronger growth, low inflation, and a falling unemployment rate. 10 September 2014 FOMC Economic Projections for 2014-2015 Percent 3.1 7.0 1.0 2013 (A) 2014 2015 2.1 6.0 1.6 2.8 5.5 1.8 8.0 6.0 4.0 2.0 0.0 Real GDP Unemp. Rate Inflation NOTE: FOMC Projections are the mid-points of the central tendencies. The unemployment rate is the average of the fourth-quarter for the year indicated.
  • 11.
    Risks to theeconomy and alternative views of the outlook. 11 • Some risks are known but are difficult to quantify (pandemics, geopolitical risks, etc.). • Signs of financial market excesses. • Global growth slows by more than expected. • The economy achieves “escape velocity” . . . the markets begin to worry that the Fed is behind the curve.
  • 12.
    Fed Views vs.Market Views Expected Federal Funds Rates Estimated from Financial Futures Along with Median of SEP Projections Percent 4.0 3.5 3.0 2.5 2.0 1.5 1.0 0.5 0.0 2016 2017 9/17/2014 Median June '14 SEP Projection Median Sept '14 SEP Projection 2015 2014 Oct.2014 Apr.2015 Oct.2015 Apr.2016 Oct.2016 Apr.2017 Oct.2017 Apr.2018 Oct.2018
  • 13.
    • According tothe St. Louis Fed’s latest report on agricultural credit conditions in the second quarter of 2014: – Farm income decreased modestly from a year earlier. – Quality farmland values averaged $5,473/acre, down slightly over the past year. – Bankers expect farm income and equipment expenditures in the third quarter to be sharply below last year’s levels. 13
  • 14.
    The latest St.Louis Fed survey suggests that District farmland prices may have peaked. 14 Year-to-Year Change in Eighth District Quality Farmalnd Prices Percent change from four quarters earlier 20.6 9.1 12.2 7.5 -3.5 25.0 20.0 15.0 10.0 5.0 0.0 -5.0 -10.0 2013:Q2 2013:Q3 2013:Q4 2014:Q1 2014:Q2
  • 15.
    Four Looks at Arkansas’ Economy Charles S. Gascon Regional Economist, Sr. Research Support Coordinator October 15, 2014
  • 16.
    A Look Back 2006 2010 2013
  • 17.
  • 18.
    Producing more withfewer workers
  • 19.
    Shift in employmenttoward the service sector
  • 20.
    Shift in employmenttoward the service sector
  • 21.
    Shift in employmenttoward the service sector
  • 22.
  • 23.
    Manufacturing and construction sectors out almost 60,000 jobs
  • 24.
    Housing prices havecontinued to recover…
  • 25.
  • 26.
    A Look FromAbove County Unemployment Rates, 2014:Q2
  • 27.
    Unemployment rates consistent with national average
  • 28.
    Job growth hasbeen half the national rate
  • 29.
    Strongest growth inFayetteville
  • 30.
    Incomes about 18%below national average
  • 31.
    Cost of livingabout 12% below national average
  • 32.
    Little Rock hasthe highest “real” income
  • 33.
    A Look Aroundthe Region Are we keeping up with the Joneses?
  • 34.
    Regional growth abovenational average State Output Growth(%) Texas 4.7% Oklahoma 2.9% Kansas 2.4% Arkansas 2.3% Kentucky 2.3% Tennessee 2.2% US 2.1% Louisiana 1.4% Mississippi 1.3% Missouri 0.7% Note: Average Real GSP Growth (2010-2013) Source: Bureau of Economic Analysis
  • 35.
    Job growth hasbeen relatively slow in most of the region State Job Growth (%) Texas 2.3 Tennessee 1.4 Oklahoma 1.2 US 1.1 Kentucky 0.9 Louisiana 0.7 Missouri 0.6 Kansas 0.5 Arkansas 0.4 Mississippi 0.4 Note: Avg annual Payroll growth from 2010:Q2 to 2014:Q2 Source: Bureau of Labor Statistics
  • 36.
    Unemployment rates vary significantly across states State Unemployment Oklahoma 4.6 Kansas 4.8 Louisiana 4.8 Texas 5.1 US 6.2 Tennessee 6.4 Arkansas 6.4 Missouri 6.6 Kentucky 7.6 Mississippi 7.7 Note: Unemployment Rate in 2014:Q2 Source: Bureau of Economic Analysis
  • 37.
    Regional incomes belowthe national average MSA Income ($) US $ 4 4,200 Kansas $ 43,380 Texas $ 43,271 Oklahoma $ 41,399 Louisiana $ 40,617 Missouri $ 39,933 Tennessee $ 39,002 Arkansas $ 36,423 Kentucky $ 35,857 Mississippi $ 3 3,446 Note: Per capita income in 2013 Source: Bureau of Economic Analysis
  • 38.
    But prices arelower too! MSA Cost of Living US 0.0% Texas -3.5% Louisiana -8.6% Tennessee -9.3% Oklahoma -10.1% Kansas -10.1% Kentucky -11.2% Missouri -11.9% Arkansas -12.4% Mississippi -13.6% Note: Regional Price Parity for 2012 Source: Bureau of Economic Analysis
  • 39.
    But prices arelower too! MSA Income ($) Kansas $ 48,254 Oklahoma $ 46,050 Missouri $ 45,327 Texas $ 44,840 Louisiana $ 44,439 US $ 4 4,200 Tennessee $ 43,001 Arkansas $ 4 1,579 Kentucky $ 40,380 Mississippi $ 38,711 Note: Real Per capita income in 2012 Source: Bureau of Economic Analysis
  • 40.
  • 41.
    Expectations for LocalEconomic Conditions
  • 42.
    Expectations for LocalEconomic Conditions