The document summarizes the national economic outlook presented at the 2013 Arkansas Economic Forecast Conference. It includes the following key points:
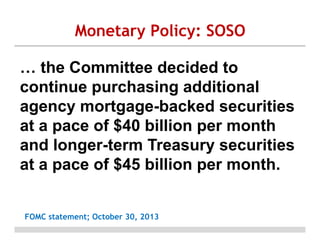
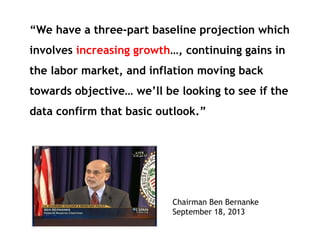
1) The Federal Reserve will continue its quantitative easing program of $40 billion in mortgage backed securities and $45 billion in Treasury securities per month.
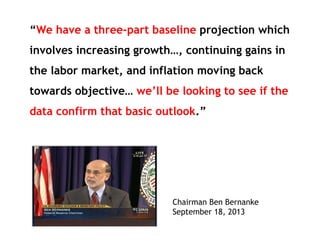
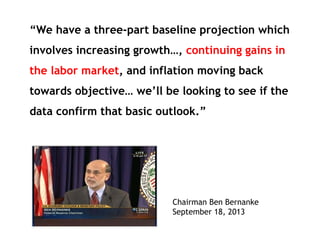
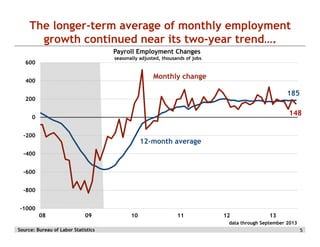
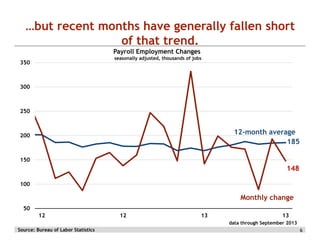
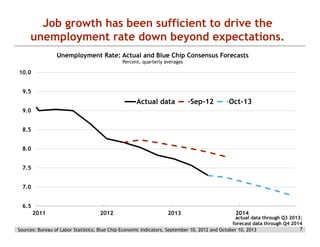
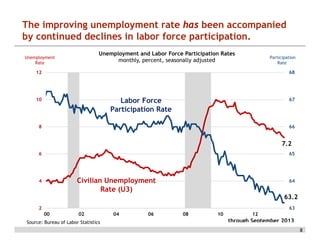
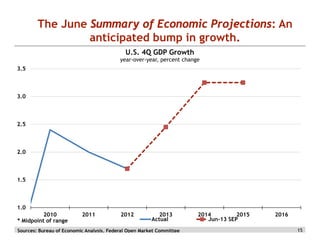
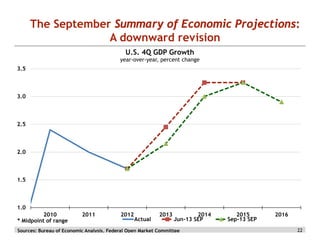
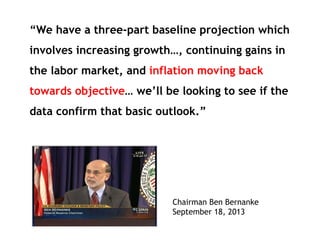
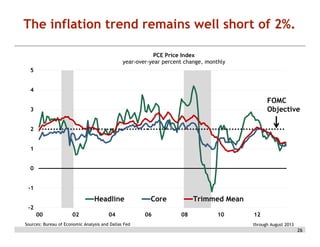
2) Recent economic data has fallen short of projections of increasing growth, ongoing job gains, and inflation moving back to 2%. Unemployment has declined faster than expected but labor force participation continues to drop.
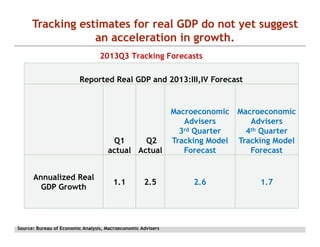
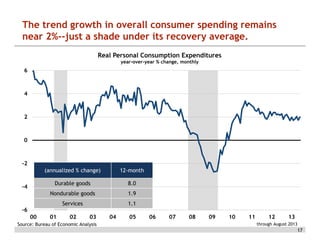
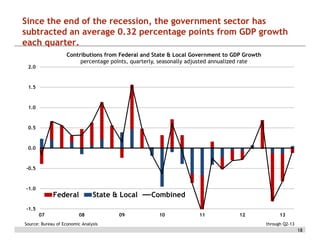
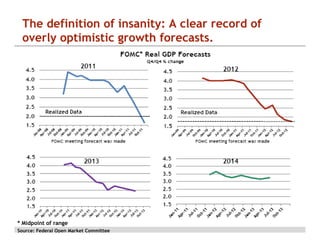
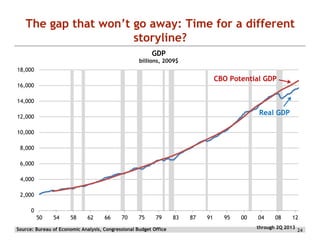
3) While consumer spending growth has remained around 2%, government spending cuts have subtracted from GDP growth. Estimates of GDP growth have been revised downward and forecasts have historically been too optimistic. Inflation remains below the Fed


![4th Qtr Year End 2011 Economic Review Feb 15 [Autosaved] [Autosaved]](https://cdn.slidesharecdn.com/ss_thumbnails/4thqtryearend2011economicreviewfeb15autosavedautosaved-13329676670408-phpapp01-120328155136-phpapp01-thumbnail.jpg?width=640&height=640&fit=bounds)
![4th Qtr Year End 2011 Economic Review Feb 15 [Autosaved] [Autosaved]](https://cdn.slidesharecdn.com/ss_thumbnails/4thqtryearend2011economicreviewfeb15autosavedautosaved-13329663799627-phpapp01-120328152725-phpapp01-thumbnail.jpg?width=640&height=640&fit=bounds)

![4th Qtr Year End 2011 Economic Review Feb 15 [Autosaved] [Autosaved]](https://cdn.slidesharecdn.com/ss_thumbnails/4thqtryearend2011economicreviewfeb15autosavedautosaved-13439227651427-phpapp01-120802105911-phpapp01-thumbnail.jpg?width=640&height=640&fit=bounds)


