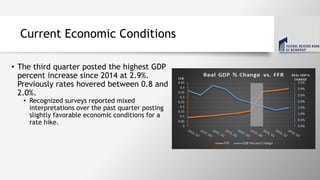
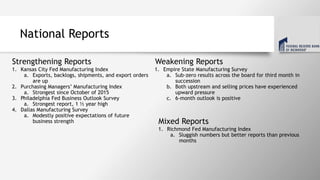
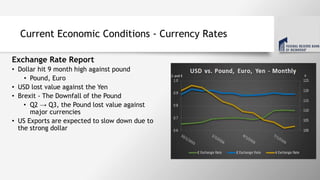
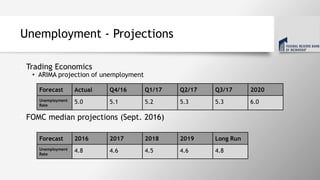
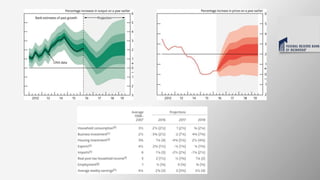
2. Economic Policy Team
Director of Research
Vice President of Research
Assistant Policy Advisor
Senior Economist
Economic Policy Analyst
Financial Economist
Dr. Tsang:
J Breuer :
Abdi Jima :
Elijah Fiore :
Mateo Carrasco :
Devon Norton :
3. Current Economic Conditions
• The third quarter posted the highest GDP
percent increase since 2014 at 2.9%.
Previously rates hovered between 0.8 and
2.0%.
• Recognized surveys reported mixed
interpretations over the past quarter posting
slightly favorable economic conditions for a
rate hike.
4. National Reports
Strengthening Reports
1. Empire State Manufacturing Survey
a. Sub-zero results across the board for third month in
succession
b. Both upstream and selling prices have experienced
upward pressure
c. 6-month outlook is positive
1. Kansas City Fed Manufacturing Index
a. Exports, backlogs, shipments, and export orders
are up
2. Purchasing Managers’ Manufacturing Index
a. Strongest since October of 2015
3. Philadelphia Fed Business Outlook Survey
a. Strongest report, 1 ½ year high
4. Dallas Manufacturing Survey
a. Modestly positive expectations of future
business strength Mixed Reports
Weakening Reports
1. Richmond Fed Manufacturing Index
a. Sluggish numbers but better reports than previous
months
5. Current Economic Conditions - Currency Rates
Exchange Rate Report
• Dollar hit 9 month high against pound
• Pound, Euro
• USD lost value against the Yen
• Brexit - The Downfall of the Pound
• Q2 → Q3, the Pound lost value against
major currencies
• US Exports are expected to slow down due to
the strong dollar
£ and € ¥
6. Current Economic Conditions - Trade Deficit
The US current account deficit
• Q1 2016 - $131.8 Billion
• Q2 2016 - $119.9 Billion
Goods and services deficit
• Decreased 1.3% in 2016 from the
same period in 2015
7. International Economic Conditions - Growth Rates
• Growth rates of other developed countries
The E.U growth rate of GDP was 0.3% in Q2 2016
The Japanese growth rate 0.2% in Q2 2016 and is
forecasted to grow at 0.5% in Q3
• Growth rates of key emerging economies
India’s GDP grew by 7.6% in Q2 2016
China’s GDP grew 6.7% in in Q2 2016 and is
forecasted to slow down to 6.2% in 2017
8. Inflation - Current Economic Conditions
• BEA August Personal Income and Outlays
• Dallas Fed calculates trimmed mean PCE inflation using BEA
releases
Mar-16 Apr-16 May-16 Jun-16 Jul-16 Aug-16
PCE 0.8 4.0 2.1 1.4 0.4 1.7
Core PCE 0.8 2.4 2.0 1.0 1.5 2.2
Trimmed PCE 1.8 2.3 1.9 1.4 1.4 1.6
9. Inflation - Projections
• Fed’s inflation forecasts
• Cleveland Fed Inflation Nowcast
• Q4 2016 quarterly annualized PCE inflation at 2.41% and core PCE inflation is
at 1.59%
• FOMC median projections (Sept. 2016)
Forecast 2016 2017 2018 2019 Long Run
PCE Inflation 1.3 1.9 2.0 2.0 2.0
10. Inflation - Expectations
• Expected inflation has been declining since
1982, while the Inflation Risk Premium (IRP) has
stayed level
• With a stable IRP, investors can expect inflation
to not rise or fall more than expected over the
period in which they hold a bond
• The Cleveland Fed’s latest estimate of 10-year
expected inflation is 1.69%
• The public expects the inflation rate to be less
than 2% on average over the next decade
11. 10 Year TIPS Versus Trimmed PCE
Source: US Department of the Treasury and FRED
12. Employment - Current Economic Conditions
• Employment Situation for September (Oct. release)
• Household Survey Data
• Unemployment August:4.9%
• Unemployment September: 5.0%
• Participation rate up to 62.9%
• Those unemployed less than 5 weeks rose 284,000 up to
2.6 million
• Long term unemployed remained about 2.0 million, 24.9%
of total
14. Unemployment - Projections
• Trading Economics
• ARIMA projection of unemployment
• FOMC median projections (Sept. 2016)
Forecast Actual Q4/16 Q1/17 Q2/17 Q3/17 2020
Unemployment
Rate
5.0 5.1 5.2 5.3 5.3 6.0
Forecast 2016 2017 2018 2019 Long Run
Unemployment
Rate
4.8 4.6 4.5 4.6 4.8
15. Unemployment - Implications
• NAIRU and economic stability
• Natural rate of unemployment estimated at 4.8% by St. Louis Fed
• Unemployment under this level could increase inflationary pressures
• Inflation trends could signify a possible target rate hike in the
near future
16. Financial Markets - Projections
• Investor expectations lean
towards rate hike in December
• November rate hike effects:
• Volatility Index (VIX)
• Unpredictability
• Higher cost of borrowing
17. International Conditions - Projections
British Pound Implications
• GDP projections for 2017 dropped 1.5
points from 2.3 to 0.8 post Brexit
• Imports, Business Investment, and
Housing Investment are forecasting
negative changes
• Most projections are expecting the
economy to recover in 2018
• The central bank is welcoming a more
aggressive stance on expansionary
monetary policy throughout 2017-2018
• Unemployment forecasts remained the
same
• Credit rating downgrade to AA
• Delicate economic conditions with
special care and attention required
throughout Brexit negotiations
• Soft vs. Hard exit
18.
19. Key Economic Indicators
Monetary Policy Important Economic Variables
• Given the following reports,
we propose to hold the
federal funds rate between
0.25-0.50%.
• Interest rates on excess
reserves to be held at 0.5%
• GDP Forecast
• Economic surveys indicate a general consensus
on the strengthening economy
• Inflation Expectations
• Atlanta Fed’s Business Inflation Expectations
• Philadelphia Fed’s Survey of Professional
Forecasters
• New York Fed’s Survey of Consumer
Expenditures
• Employment
• Positive vs. negative signs
20. Indicators to Follow for December Meeting
Attention Needed For the Following Metrics
• Revised GDP
• Inflation Expectations
• U6 Unemployment
• Economic Surveys
• Brexit
• Negotiations
• Hard vs. Soft exit
• GPB/USD
• CME Group Market Expectations
• Volatility Index