Download to read offline

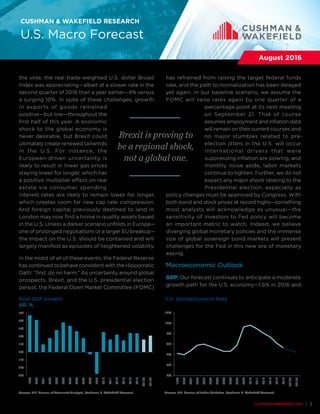
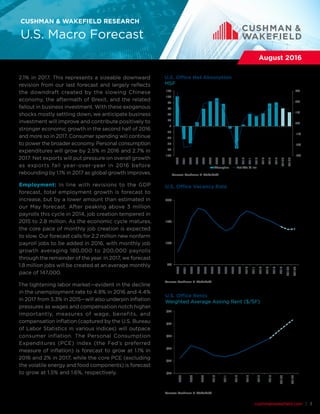
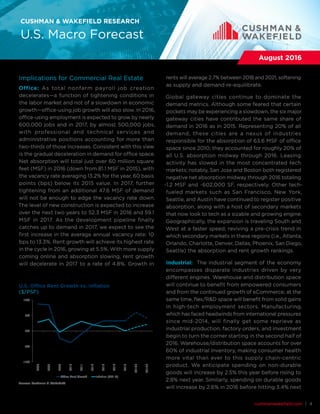
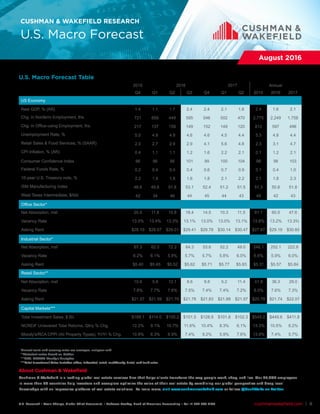

The document summarizes a U.S. macroeconomic forecast by Cushman & Wakefield. It finds that: 1) The U.S. economy has remained resilient despite global headwinds like Brexit, with strong consumer spending and job growth powering continued expansion. 2) GDP growth is expected to be moderate at 1.6% in 2016 and 2.1% in 2017, while employment growth will exceed 2.2 million new jobs in 2016 and 1.8 million in 2017. 3) Commercial real estate markets like office and industrial will continue tightening, with office rents growing 5.5% in 2016 and 4.8% in 2017 and industrial vacancy falling further before a modest rise in


