Downloaded 154 times

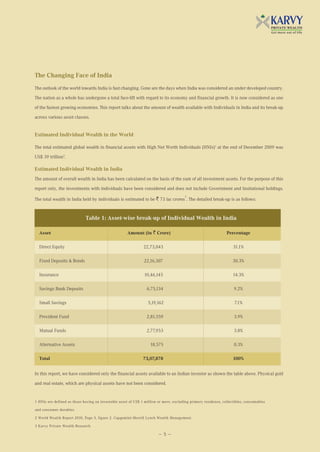
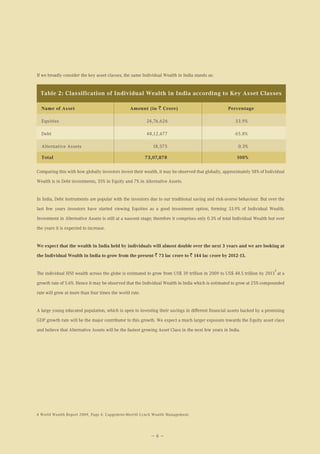

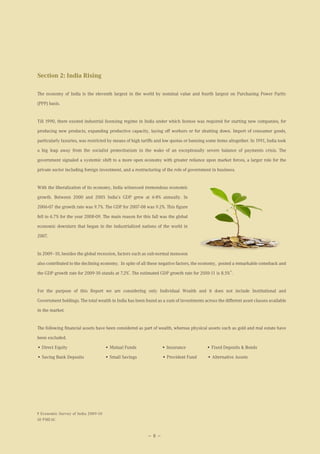
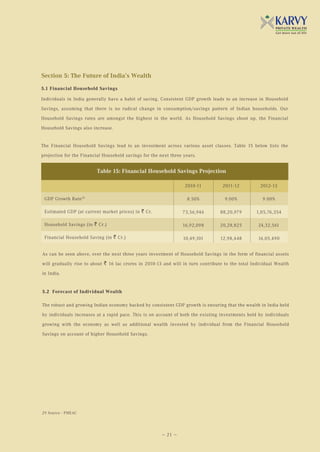
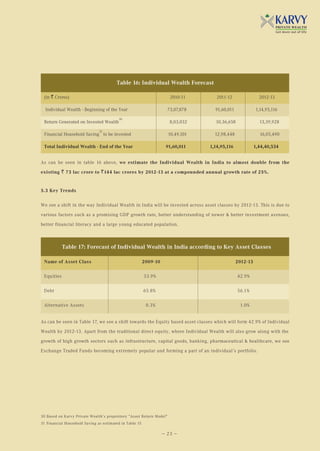


The 'India Wealth Report' by Karvy Private Wealth analyzes the investment landscape for individuals in India, forecasting that individual wealth will nearly double from ₹73 lakh crores to ₹144 lakh crores by 2013. The report highlights changing investment behaviors, with increasing allocations towards equities and the potential for alternative assets to grow significantly. It provides detailed breakdowns of individual wealth across various asset classes such as direct equity, mutual funds, insurance, and more, comparing them to global trends.


