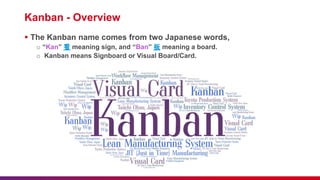
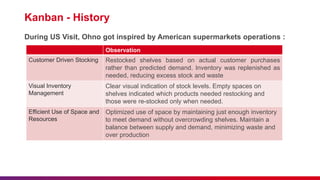
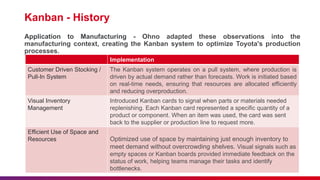
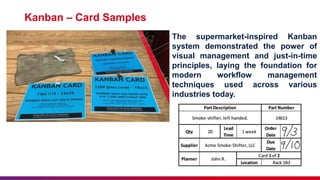
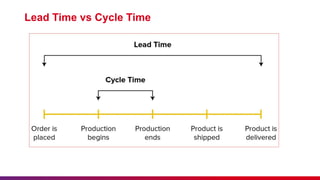
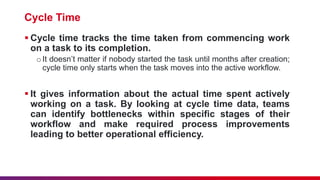
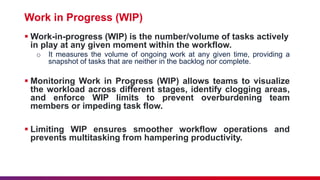
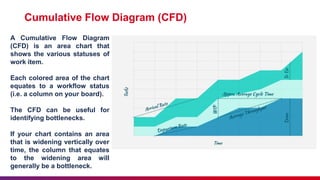
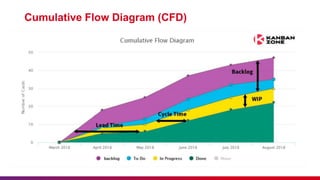
Kanban Metrics
POOJA CHAWLA
Lack of etiquette and manners is a huge turn off.
KnolX Etiquettes
 Punctuality
Join the session 5 minutes prior to the session start time. We start on
time and conclude on time!
 Feedback
Make sure to submit a constructive feedback for all sessions as it is very
helpful for the presenter.
 Silent Mode
Keep your mobile devices in silent mode, feel free to move out of session
in case you need to attend an urgent call.
 Avoid Disturbance
Avoid unwanted chit chat during the session.
1. Kanban – Overview
2. Kanban – History
3. Kanban – Card Samples
4. Kanban – Software Development
5. Kanban Metrics
o Lead Time
o Cycle Time
o Work in Progress (WIP)
o Throughput
o Cumulative Flow Diagram (CFD)
Kanban - Overview
 The Kanban name comes from two Japanese words,
o “Kan” 看 meaning sign, and “Ban” 板 meaning a board.
o Kanban means Signboard or Visual Board/Card.
Kanban - History
 During 1940s, Japan was recovering from World War II. Resources were
Scarce.
 Japanese car industry was in stagnation. Toyota was firmly making a
loss, could not compete at all with any of the American car manufacturers
(Ford or General Motors)
 This challenge necessitated innovative thinking and new approaches to
efficient production and inventory management.
 Executive including Taaichi Ohno were sent to USA to learn about
American Manufacturing Techniques and help improve efficiency of
manufacturing processes and inventory control.
Kanban - History
During US Visit, Ohno got inspired by American supermarkets operations :
Observation
Customer Driven Stocking Restocked shelves based on actual customer purchases
rather than predicted demand. Inventory was replenished as
needed, reducing excess stock and waste
Visual Inventory
Management
Clear visual indication of stock levels. Empty spaces on
shelves indicated which products needed restocking and
those were re-stocked only when needed.
Efficient Use of Space and
Resources
Optimized use of space by maintaining just enough inventory
to meet demand without overcrowding shelves. Maintain a
balance between supply and demand, minimizing waste and
over production
Kanban - History
Application to Manufacturing - Ohno adapted these observations into the
manufacturing context, creating the Kanban system to optimize Toyota's production
processes.
Implementation
Customer Driven Stocking /
Pull-In System
The Kanban system operates on a pull system, where production is
driven by actual demand rather than forecasts. Work is initiated based
on real-time needs, ensuring that resources are allocated efficiently
and reducing overproduction.
Visual Inventory
Management
Introduced Kanban cards to signal when parts or materials needed
replenishing. Each Kanban card represented a specific quantity of a
product or component. When an item was used, the card was sent
back to the supplier or production line to request more.
Efficient Use of Space and
Resources Optimized use of space by maintaining just enough inventory to
meet demand without overcrowding shelves. Visual signals such as
empty spaces or Kanban boards provided immediate feedback on the
status of work, helping teams manage their tasks and identify
bottlenecks.
Kanban – Card Samples
The supermarket-inspired Kanban
system demonstrated the power of
visual management and just-in-time
principles, laying the foundation for
modern workflow management
techniques used across various
industries today.
Kanban in Software Development
 Kanban is a visual framework that can transform how you manage
workflow and resources, making your projects more efficient and
transparent from end to end.
 A kanban board is an agile project management tool designed to
help visualize work, limit work-in-progress, and maximize
efficiency (or flow).
 Kanban is great for teams that need the flexibility to change
priorities on the fly and for projects where work comes in
continuously, such as support and maintenance tasks. It's also
beneficial in environments where the scope is variable or
unknown initially.
 When it comes to Kanban, four key metrics can make or break
your workflow. These metrics are lead time, cycle time, work-in-
progress, and throughput.
What is Lead Time
 Lead time is the duration from when a task is added to the
system until it's marked as complete.
o e.g. time from when you add a new software development task to the Kanban
board to the point where the team marks the task as complete.
 This metric provides an insight of how long it takes for a task
to move through the entire workflow—right from the customer
request to delivery.
 It tells the actual time taken for a request or requirement to be
fulfilled, providing valuable insights into process efficiency
and customer satisfaction.
Lead Time vs Cycle Time
Cycle Time
 Cycle time tracks the time taken from commencing work
on a task to its completion.
oIt doesn’t matter if nobody started the task until months after creation;
cycle time only starts when the task moves into the active workflow.
 It gives information about the actual time spent actively
working on a task. By looking at cycle time data, teams
can identify bottlenecks within specific stages of their
workflow and make required process improvements
leading to better operational efficiency.
Cycle Time – Scatter Plot
Work in Progress (WIP)
 Work-in-progress (WIP) is the number/volume of tasks actively
in play at any given moment within the workflow.
o It measures the volume of ongoing work at any given time, providing a
snapshot of tasks that are neither in the backlog nor complete.
 Monitoring Work in Progress (WIP) allows teams to visualize
the workload across different stages, identify clogging areas,
and enforce WIP limits to prevent overburdening team
members or impeding task flow.
 Limiting WIP ensures smoother workflow operations and
prevents multitasking from hampering productivity.
Throughput
 Throughput measures the number of tasks completed
within a specific timeframe such as a day, week or month
e.g.
oNumber of stories completed in 2 weeks time.
 Throughput metrics provide a macroscopic lens into
overall productivity and goal achievement, serving as an
indicator of team performance.
Cumulative Flow Diagram (CFD)
Rakesh Gupta - 14 out of
22 have completed.
Rakesh Gupta - 14 out of
22 have completed.
A Cumulative Flow Diagram
(CFD) is an area chart that
shows the various statuses of
work item.
Each colored area of the chart
equates to a workflow status
(i.e. a column on your board).
The CFD can be useful for
identifying bottlenecks.
If your chart contains an area
that is widening vertically over
time, the column that equates
to the widening area will
generally be a bottleneck.
Cumulative Flow Diagram (CFD)
References
 Kanban Metrics: How To Measure Kanban Work & Efficiency (scrum-institute.org)
 4 Kanban metrics you should be using in 2024 (atlassian.com)
 https://www.atlassian.com/agile/project-management/kanban-metrics
 How to Read a Cumulative Flow Diagram in Kanban - with Sample Spreadsheet (tipsographic.com)
 Kanban Principles and Practices - agile42
 Kanban Card | Manage inventory by using a kanban system (velaction.com)
 Cumulative Flow Diagram - What Information Does It Provide (kanbanzone.com)
Kanban Metrics Presentation (Project Management)

Kanban Metrics Presentation (Project Management)

  • 1.
  • 2.
    Lack of etiquetteand manners is a huge turn off. KnolX Etiquettes  Punctuality Join the session 5 minutes prior to the session start time. We start on time and conclude on time!  Feedback Make sure to submit a constructive feedback for all sessions as it is very helpful for the presenter.  Silent Mode Keep your mobile devices in silent mode, feel free to move out of session in case you need to attend an urgent call.  Avoid Disturbance Avoid unwanted chit chat during the session.
  • 3.
    1. Kanban –Overview 2. Kanban – History 3. Kanban – Card Samples 4. Kanban – Software Development 5. Kanban Metrics o Lead Time o Cycle Time o Work in Progress (WIP) o Throughput o Cumulative Flow Diagram (CFD)
  • 5.
    Kanban - Overview The Kanban name comes from two Japanese words, o “Kan” 看 meaning sign, and “Ban” 板 meaning a board. o Kanban means Signboard or Visual Board/Card.
  • 6.
    Kanban - History During 1940s, Japan was recovering from World War II. Resources were Scarce.  Japanese car industry was in stagnation. Toyota was firmly making a loss, could not compete at all with any of the American car manufacturers (Ford or General Motors)  This challenge necessitated innovative thinking and new approaches to efficient production and inventory management.  Executive including Taaichi Ohno were sent to USA to learn about American Manufacturing Techniques and help improve efficiency of manufacturing processes and inventory control.
  • 7.
    Kanban - History DuringUS Visit, Ohno got inspired by American supermarkets operations : Observation Customer Driven Stocking Restocked shelves based on actual customer purchases rather than predicted demand. Inventory was replenished as needed, reducing excess stock and waste Visual Inventory Management Clear visual indication of stock levels. Empty spaces on shelves indicated which products needed restocking and those were re-stocked only when needed. Efficient Use of Space and Resources Optimized use of space by maintaining just enough inventory to meet demand without overcrowding shelves. Maintain a balance between supply and demand, minimizing waste and over production
  • 8.
    Kanban - History Applicationto Manufacturing - Ohno adapted these observations into the manufacturing context, creating the Kanban system to optimize Toyota's production processes. Implementation Customer Driven Stocking / Pull-In System The Kanban system operates on a pull system, where production is driven by actual demand rather than forecasts. Work is initiated based on real-time needs, ensuring that resources are allocated efficiently and reducing overproduction. Visual Inventory Management Introduced Kanban cards to signal when parts or materials needed replenishing. Each Kanban card represented a specific quantity of a product or component. When an item was used, the card was sent back to the supplier or production line to request more. Efficient Use of Space and Resources Optimized use of space by maintaining just enough inventory to meet demand without overcrowding shelves. Visual signals such as empty spaces or Kanban boards provided immediate feedback on the status of work, helping teams manage their tasks and identify bottlenecks.
  • 9.
    Kanban – CardSamples The supermarket-inspired Kanban system demonstrated the power of visual management and just-in-time principles, laying the foundation for modern workflow management techniques used across various industries today.
  • 10.
    Kanban in SoftwareDevelopment  Kanban is a visual framework that can transform how you manage workflow and resources, making your projects more efficient and transparent from end to end.  A kanban board is an agile project management tool designed to help visualize work, limit work-in-progress, and maximize efficiency (or flow).  Kanban is great for teams that need the flexibility to change priorities on the fly and for projects where work comes in continuously, such as support and maintenance tasks. It's also beneficial in environments where the scope is variable or unknown initially.  When it comes to Kanban, four key metrics can make or break your workflow. These metrics are lead time, cycle time, work-in- progress, and throughput.
  • 11.
    What is LeadTime  Lead time is the duration from when a task is added to the system until it's marked as complete. o e.g. time from when you add a new software development task to the Kanban board to the point where the team marks the task as complete.  This metric provides an insight of how long it takes for a task to move through the entire workflow—right from the customer request to delivery.  It tells the actual time taken for a request or requirement to be fulfilled, providing valuable insights into process efficiency and customer satisfaction.
  • 12.
    Lead Time vsCycle Time
  • 13.
    Cycle Time  Cycletime tracks the time taken from commencing work on a task to its completion. oIt doesn’t matter if nobody started the task until months after creation; cycle time only starts when the task moves into the active workflow.  It gives information about the actual time spent actively working on a task. By looking at cycle time data, teams can identify bottlenecks within specific stages of their workflow and make required process improvements leading to better operational efficiency.
  • 14.
    Cycle Time –Scatter Plot
  • 15.
    Work in Progress(WIP)  Work-in-progress (WIP) is the number/volume of tasks actively in play at any given moment within the workflow. o It measures the volume of ongoing work at any given time, providing a snapshot of tasks that are neither in the backlog nor complete.  Monitoring Work in Progress (WIP) allows teams to visualize the workload across different stages, identify clogging areas, and enforce WIP limits to prevent overburdening team members or impeding task flow.  Limiting WIP ensures smoother workflow operations and prevents multitasking from hampering productivity.
  • 16.
    Throughput  Throughput measuresthe number of tasks completed within a specific timeframe such as a day, week or month e.g. oNumber of stories completed in 2 weeks time.  Throughput metrics provide a macroscopic lens into overall productivity and goal achievement, serving as an indicator of team performance.
  • 17.
    Cumulative Flow Diagram(CFD) Rakesh Gupta - 14 out of 22 have completed. Rakesh Gupta - 14 out of 22 have completed. A Cumulative Flow Diagram (CFD) is an area chart that shows the various statuses of work item. Each colored area of the chart equates to a workflow status (i.e. a column on your board). The CFD can be useful for identifying bottlenecks. If your chart contains an area that is widening vertically over time, the column that equates to the widening area will generally be a bottleneck.
  • 18.
  • 19.
    References  Kanban Metrics:How To Measure Kanban Work & Efficiency (scrum-institute.org)  4 Kanban metrics you should be using in 2024 (atlassian.com)  https://www.atlassian.com/agile/project-management/kanban-metrics  How to Read a Cumulative Flow Diagram in Kanban - with Sample Spreadsheet (tipsographic.com)  Kanban Principles and Practices - agile42  Kanban Card | Manage inventory by using a kanban system (velaction.com)  Cumulative Flow Diagram - What Information Does It Provide (kanbanzone.com)