


![JVM settings and logging
How do you find out what’s
happening in your JVM?
-verbose:GC
-XX:+PrintGCDetails
-XX:+PrintGCTimeStamps
!
[GC 64781K->22983K(71360K), 0.0242084 secs]
[GC 68487K->25003K(77888K), 0.0194041 secs]
[Full GC 25003K->20302K(89600K), 0.1713420 secs]
[GC 70670K->21755K(90048K), 0.0054093 secs]
[GC 71913K->46558K(94912K), 0.0295257 secs]
[Full GC 46558K->45267K(118336K), 0.2144038 secs]
[GC 88214K->84651K(133056K), 0.0674443 secs]
[Full GC 84651K->84633K(171648K), 0.1739369 secs]
[GC 117977K->115114K(180736K), 0.0623399 secs]
[GC 158613K->157136K(201152K), 0.0591171 secs]
[Full GC 157136K->157098K(254784K), 0.1868453 secs]
[GC 160678K->160455K(261184K), 0.0536678 secs]
01/24 19:36:22 Debug [scheduler-1] - Next mail spool run in 15 seconds.
[GC 202912K->200819K(268288K), 0.0625820 secs]
[Full GC 200819K->200776K(332224K), 0.2121724 secs]
[GC 213293K->212423K(339520K), 0.0426462 secs]
[GC 259465K->256115K(340288K), 0.0645039 secs]
[Full GC 256115K->255462K(418432K), 0.3226731 secs]
[GC 281947K->279651K(421760K), 0.0530268 secs]
[GC 331073K->323785K(422720K), 0.0695117 secs]
[Full GC 323785K->323697K(459264K), 0.2139458 secs]
[Full GC 364365K->361525K(459264K), 0.2180439 secs]
[Full GC 400859K->400859K(459264K), 0.1702890 secs]
[Full GC 400859K->43989K(274112K), 0.2642407 secs]
[GC 95197K->93707K(273216K), 0.0338568 secs]
[GC 146978K->140363K(276032K), 0.0664380 secs]
[GC 193696K->189635K(277952K), 0.0630006 secs]
[Full GC 189635K->189604K(425920K), 0.1913979 secs]
[GC 219773K->205157K(426048K), 0.0442126 secs]](https://image.slidesharecdn.com/jvm-is-your-friend-140515101850-phpapp01/75/The-JVM-is-your-friend-62-2048.jpg)


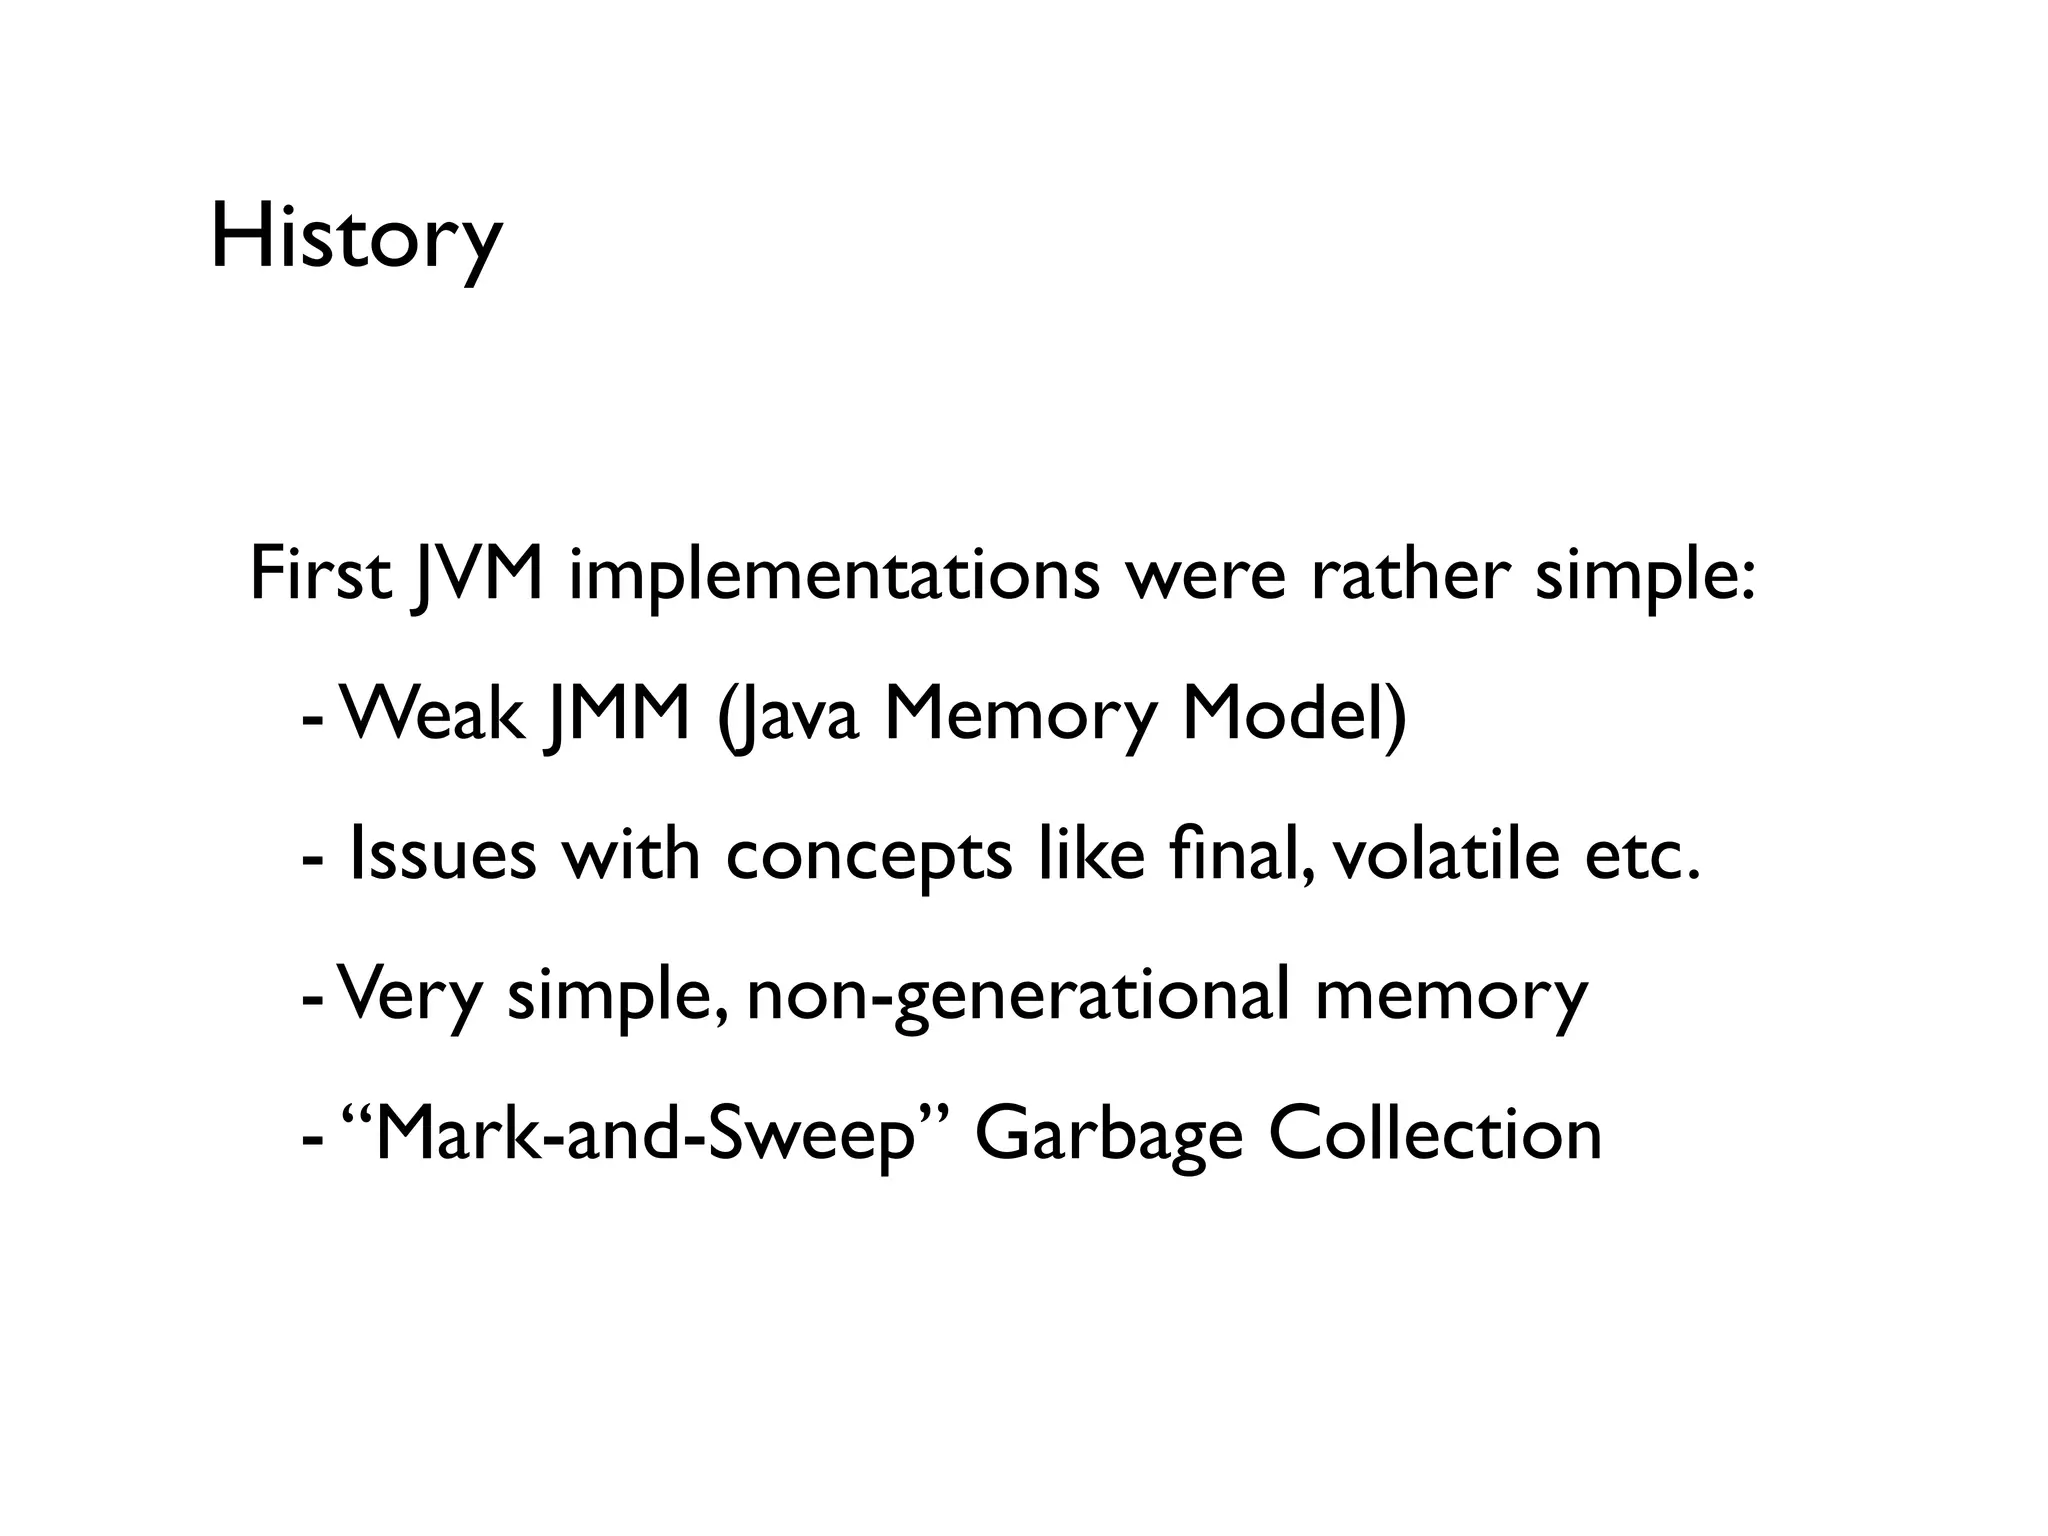
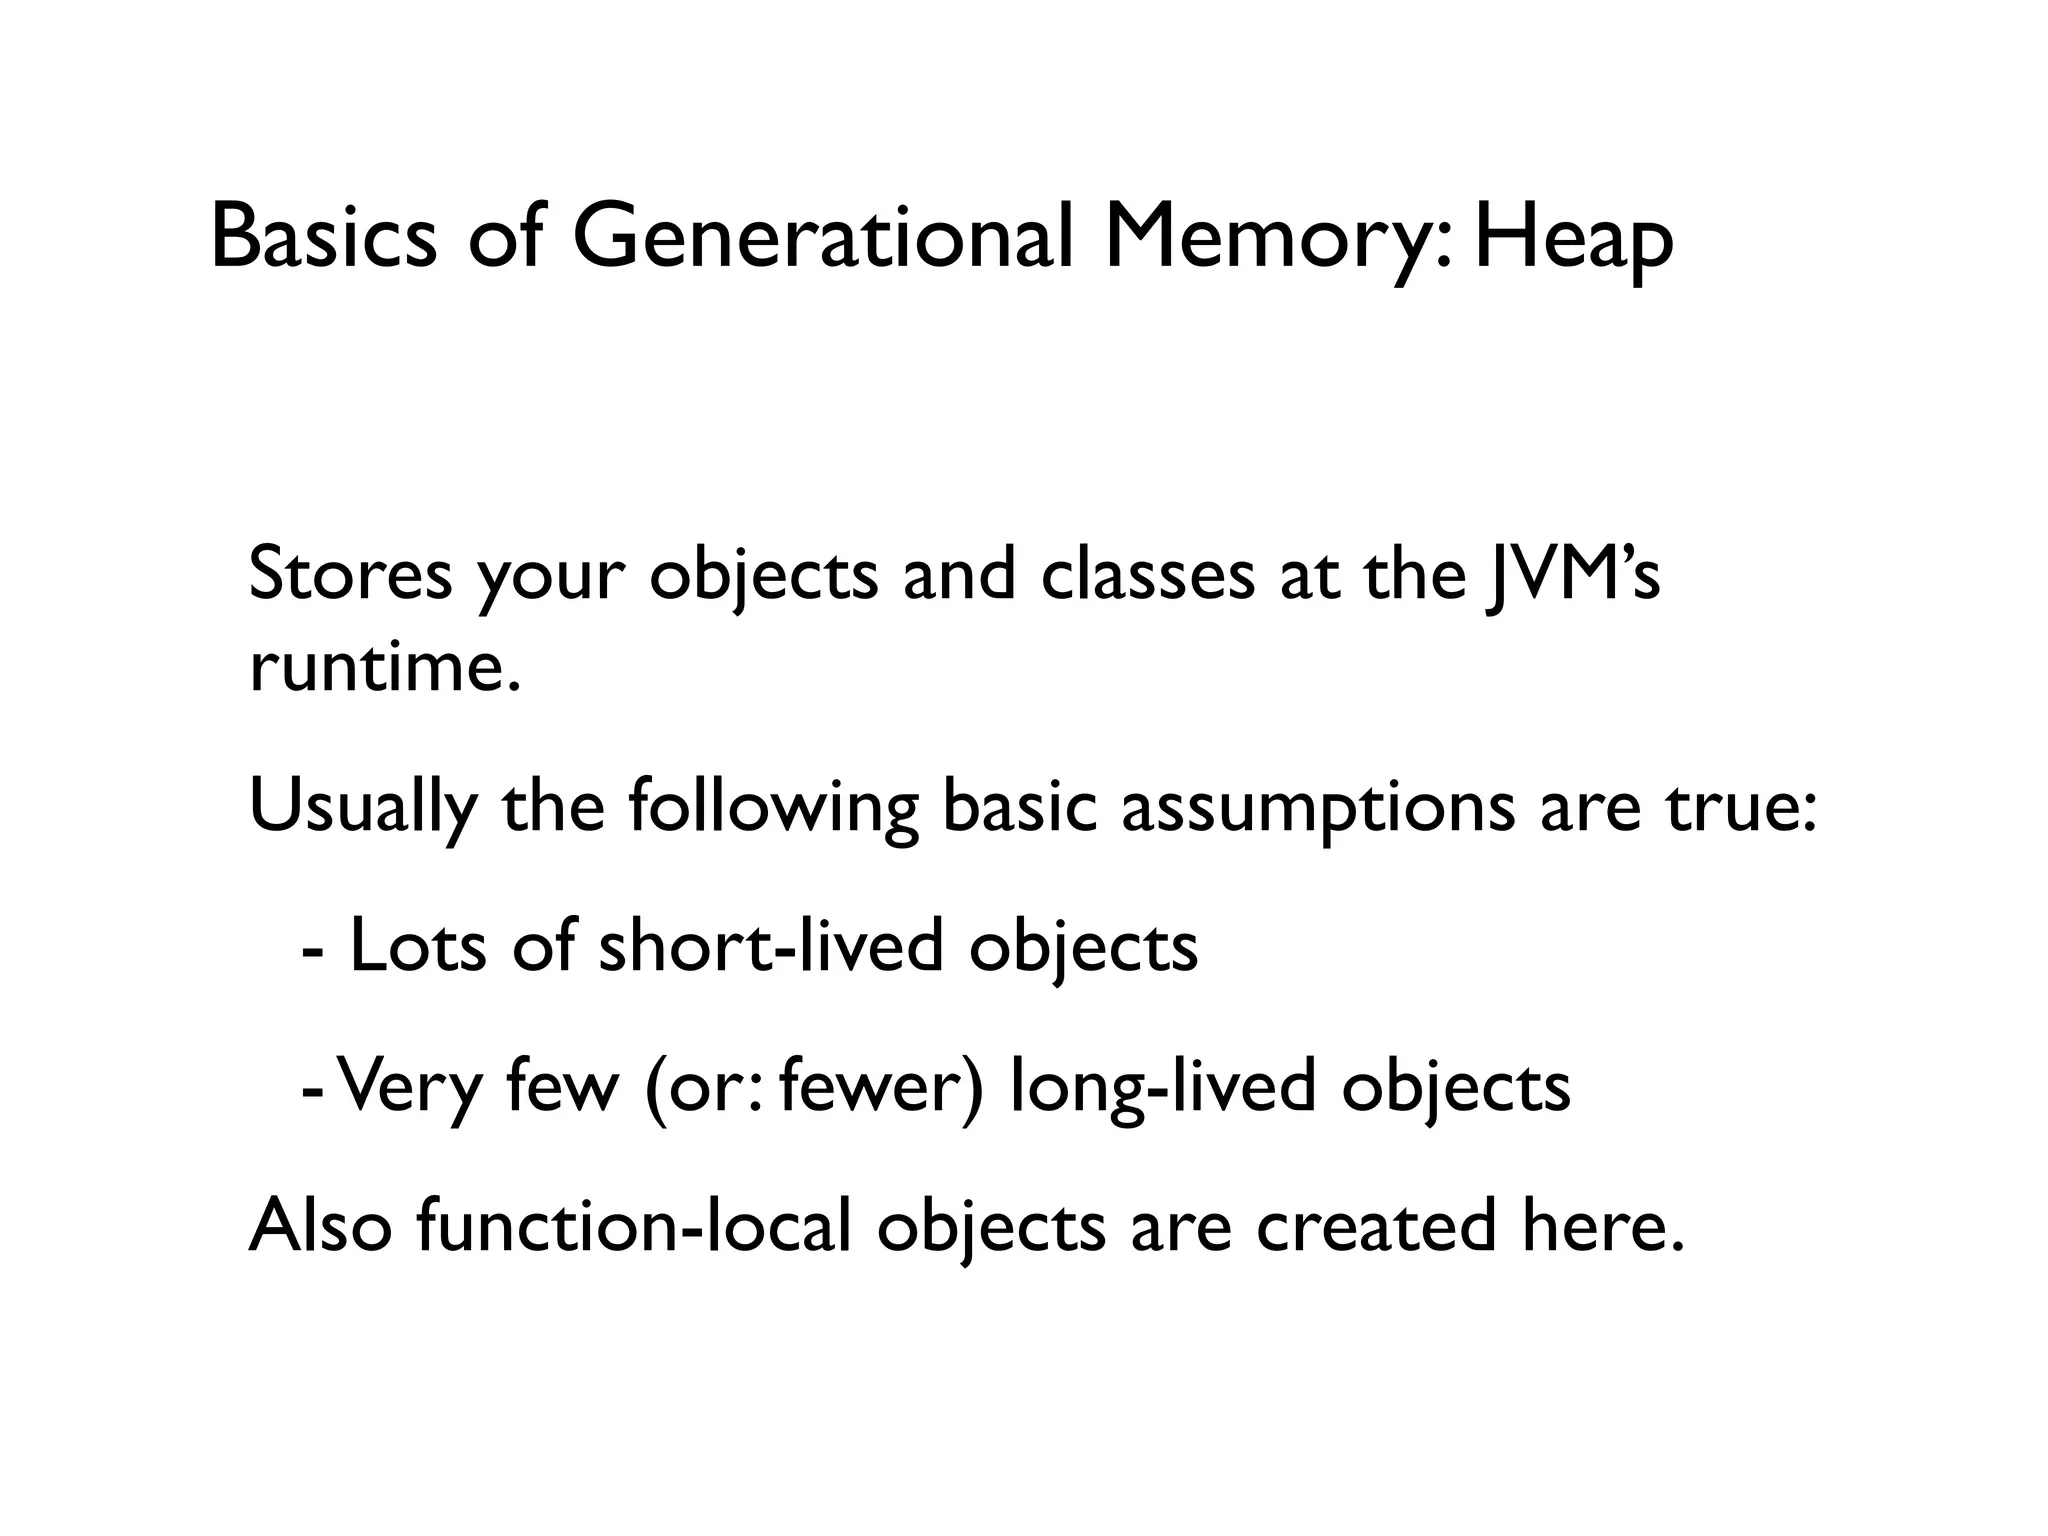
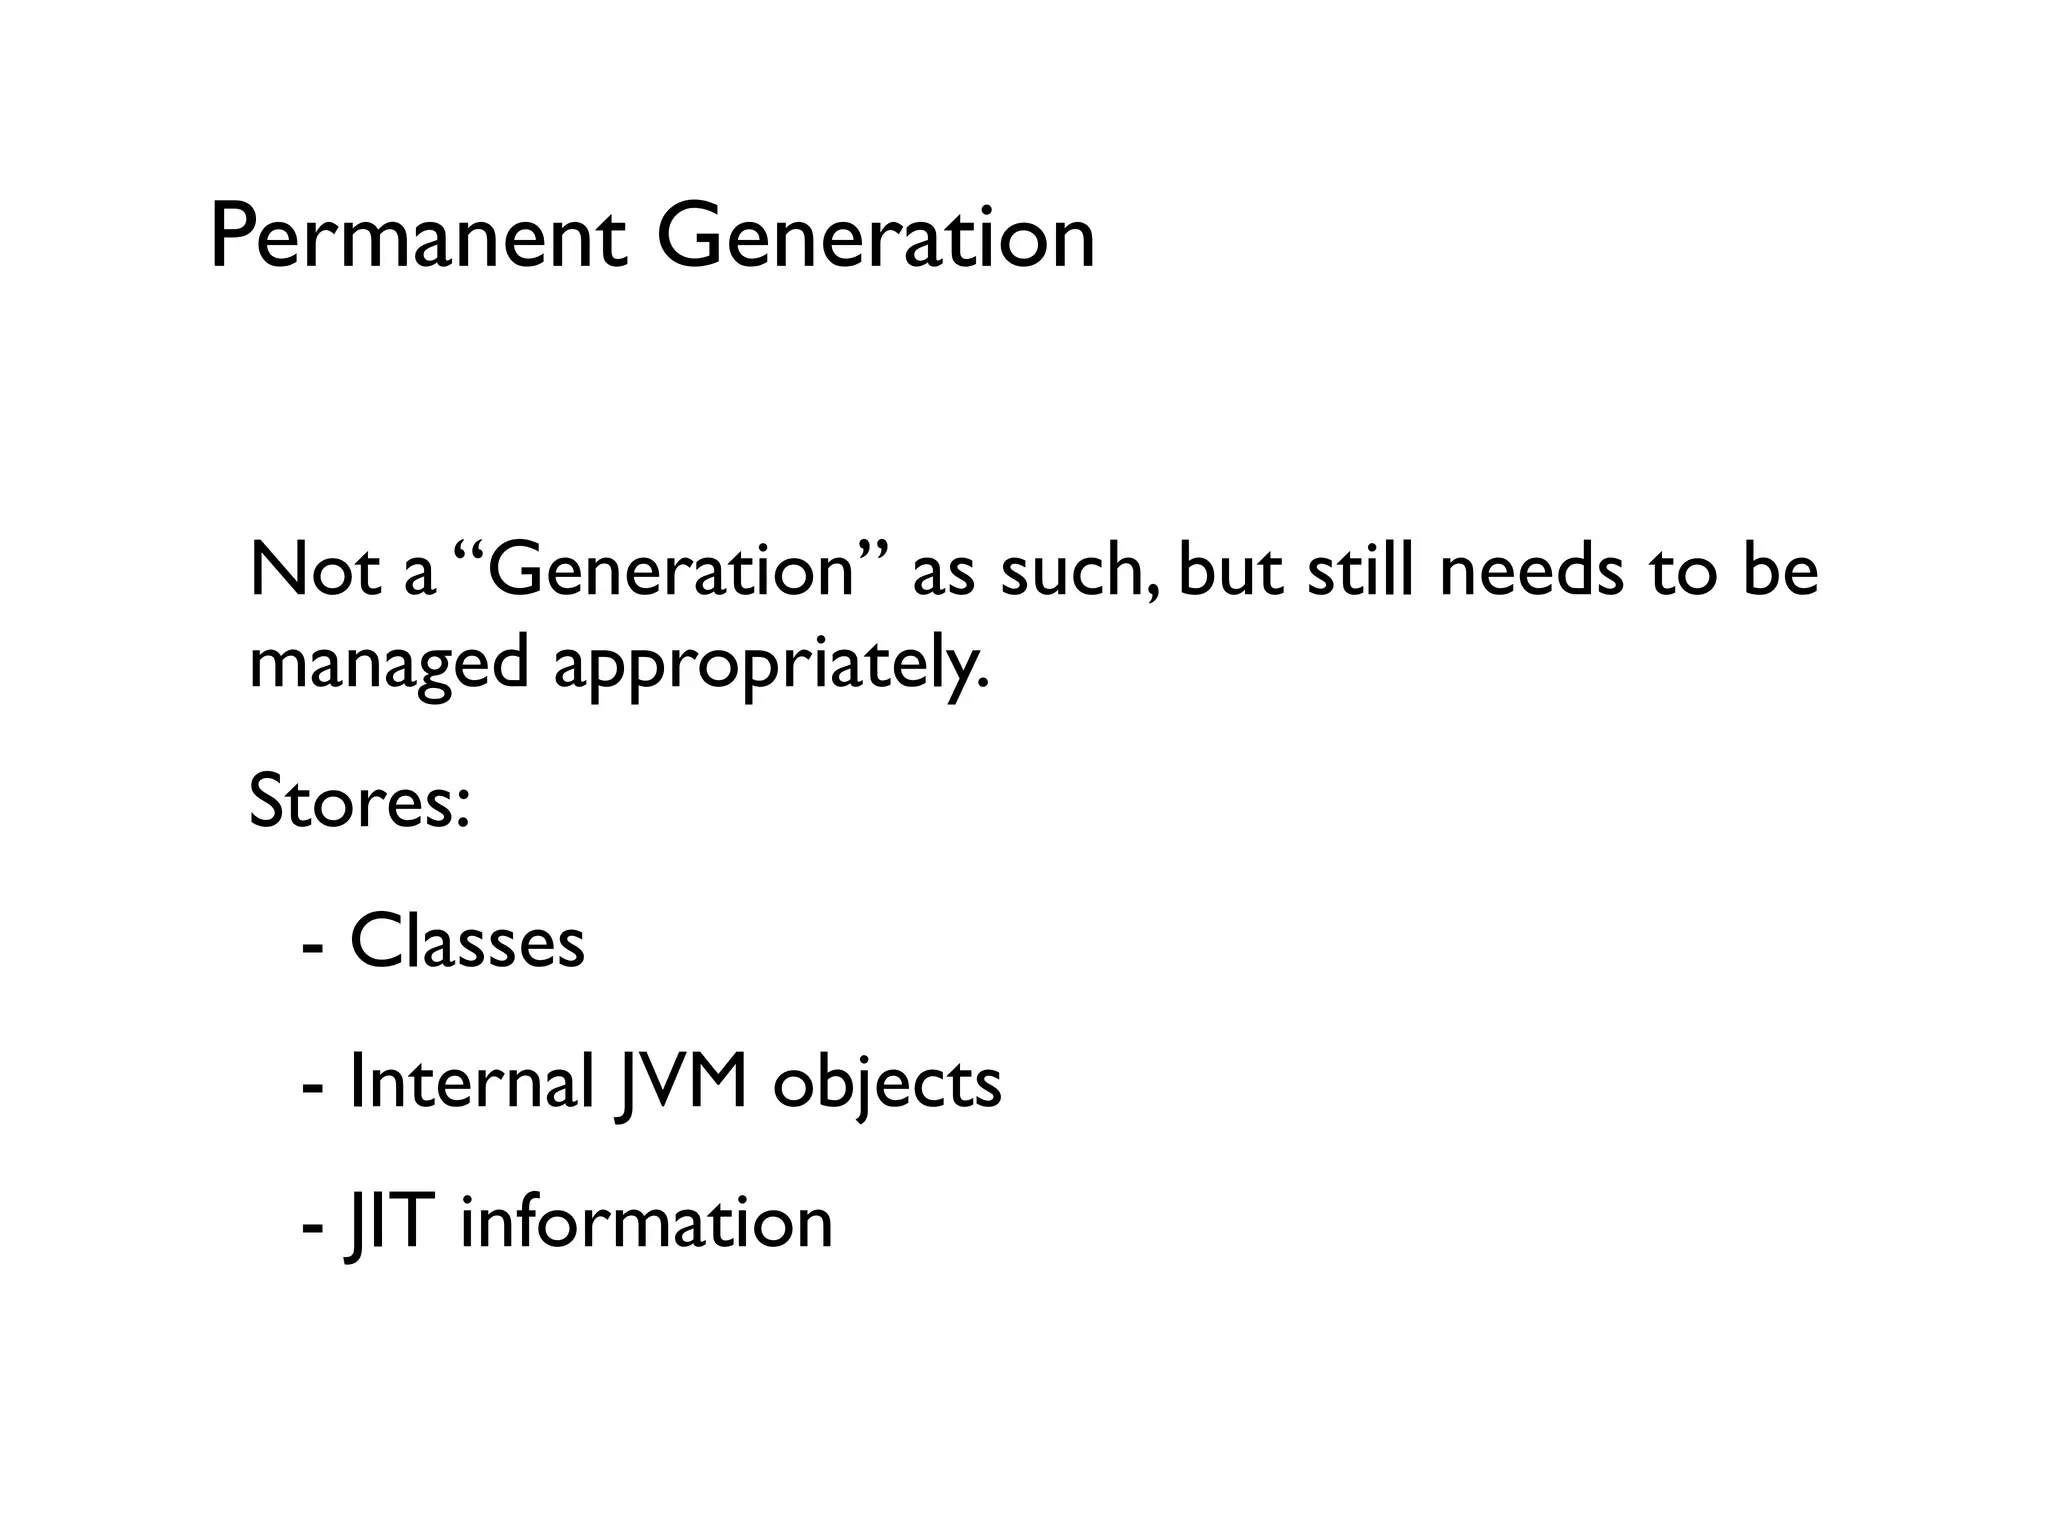
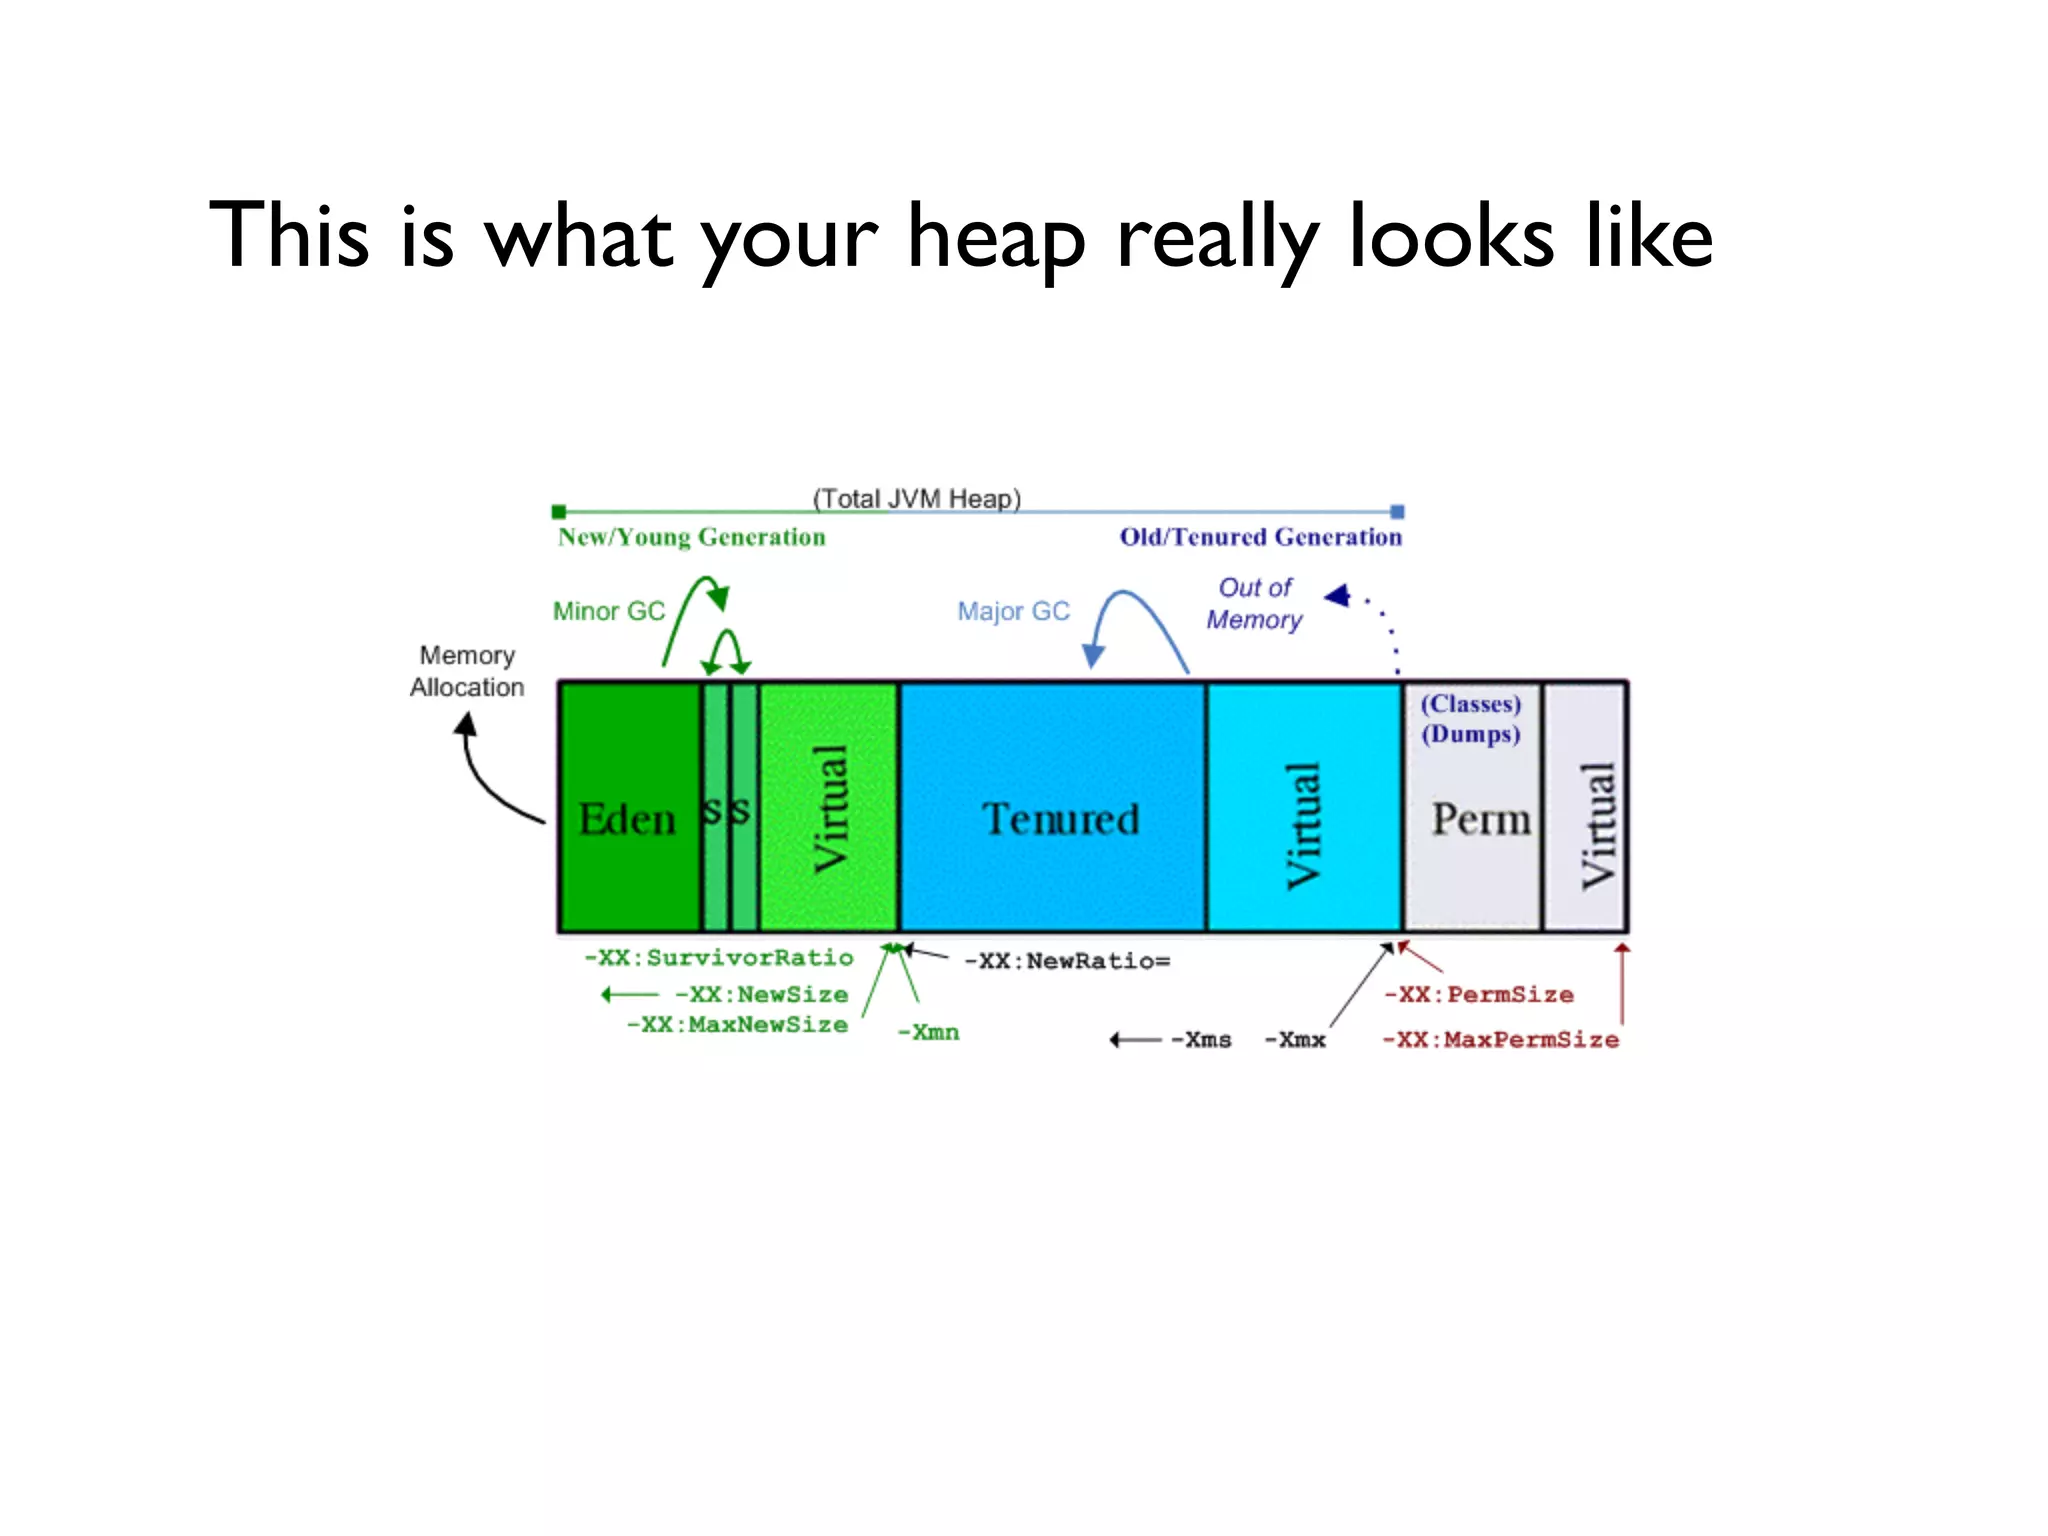
The document provides an overview of Java Virtual Machine (JVM) memory management and garbage collection strategies. It discusses the basic architecture of the JVM and how memory is divided into generations (young and old). The young generation uses strategies like mark-and-sweep and mark-and-copy for fast garbage collection of short-lived objects. The old generation uses mark-and-compact for longer-lived objects, which has higher overhead. It also describes different garbage collector implementations and considerations for selecting and tuning collectors based on application needs.
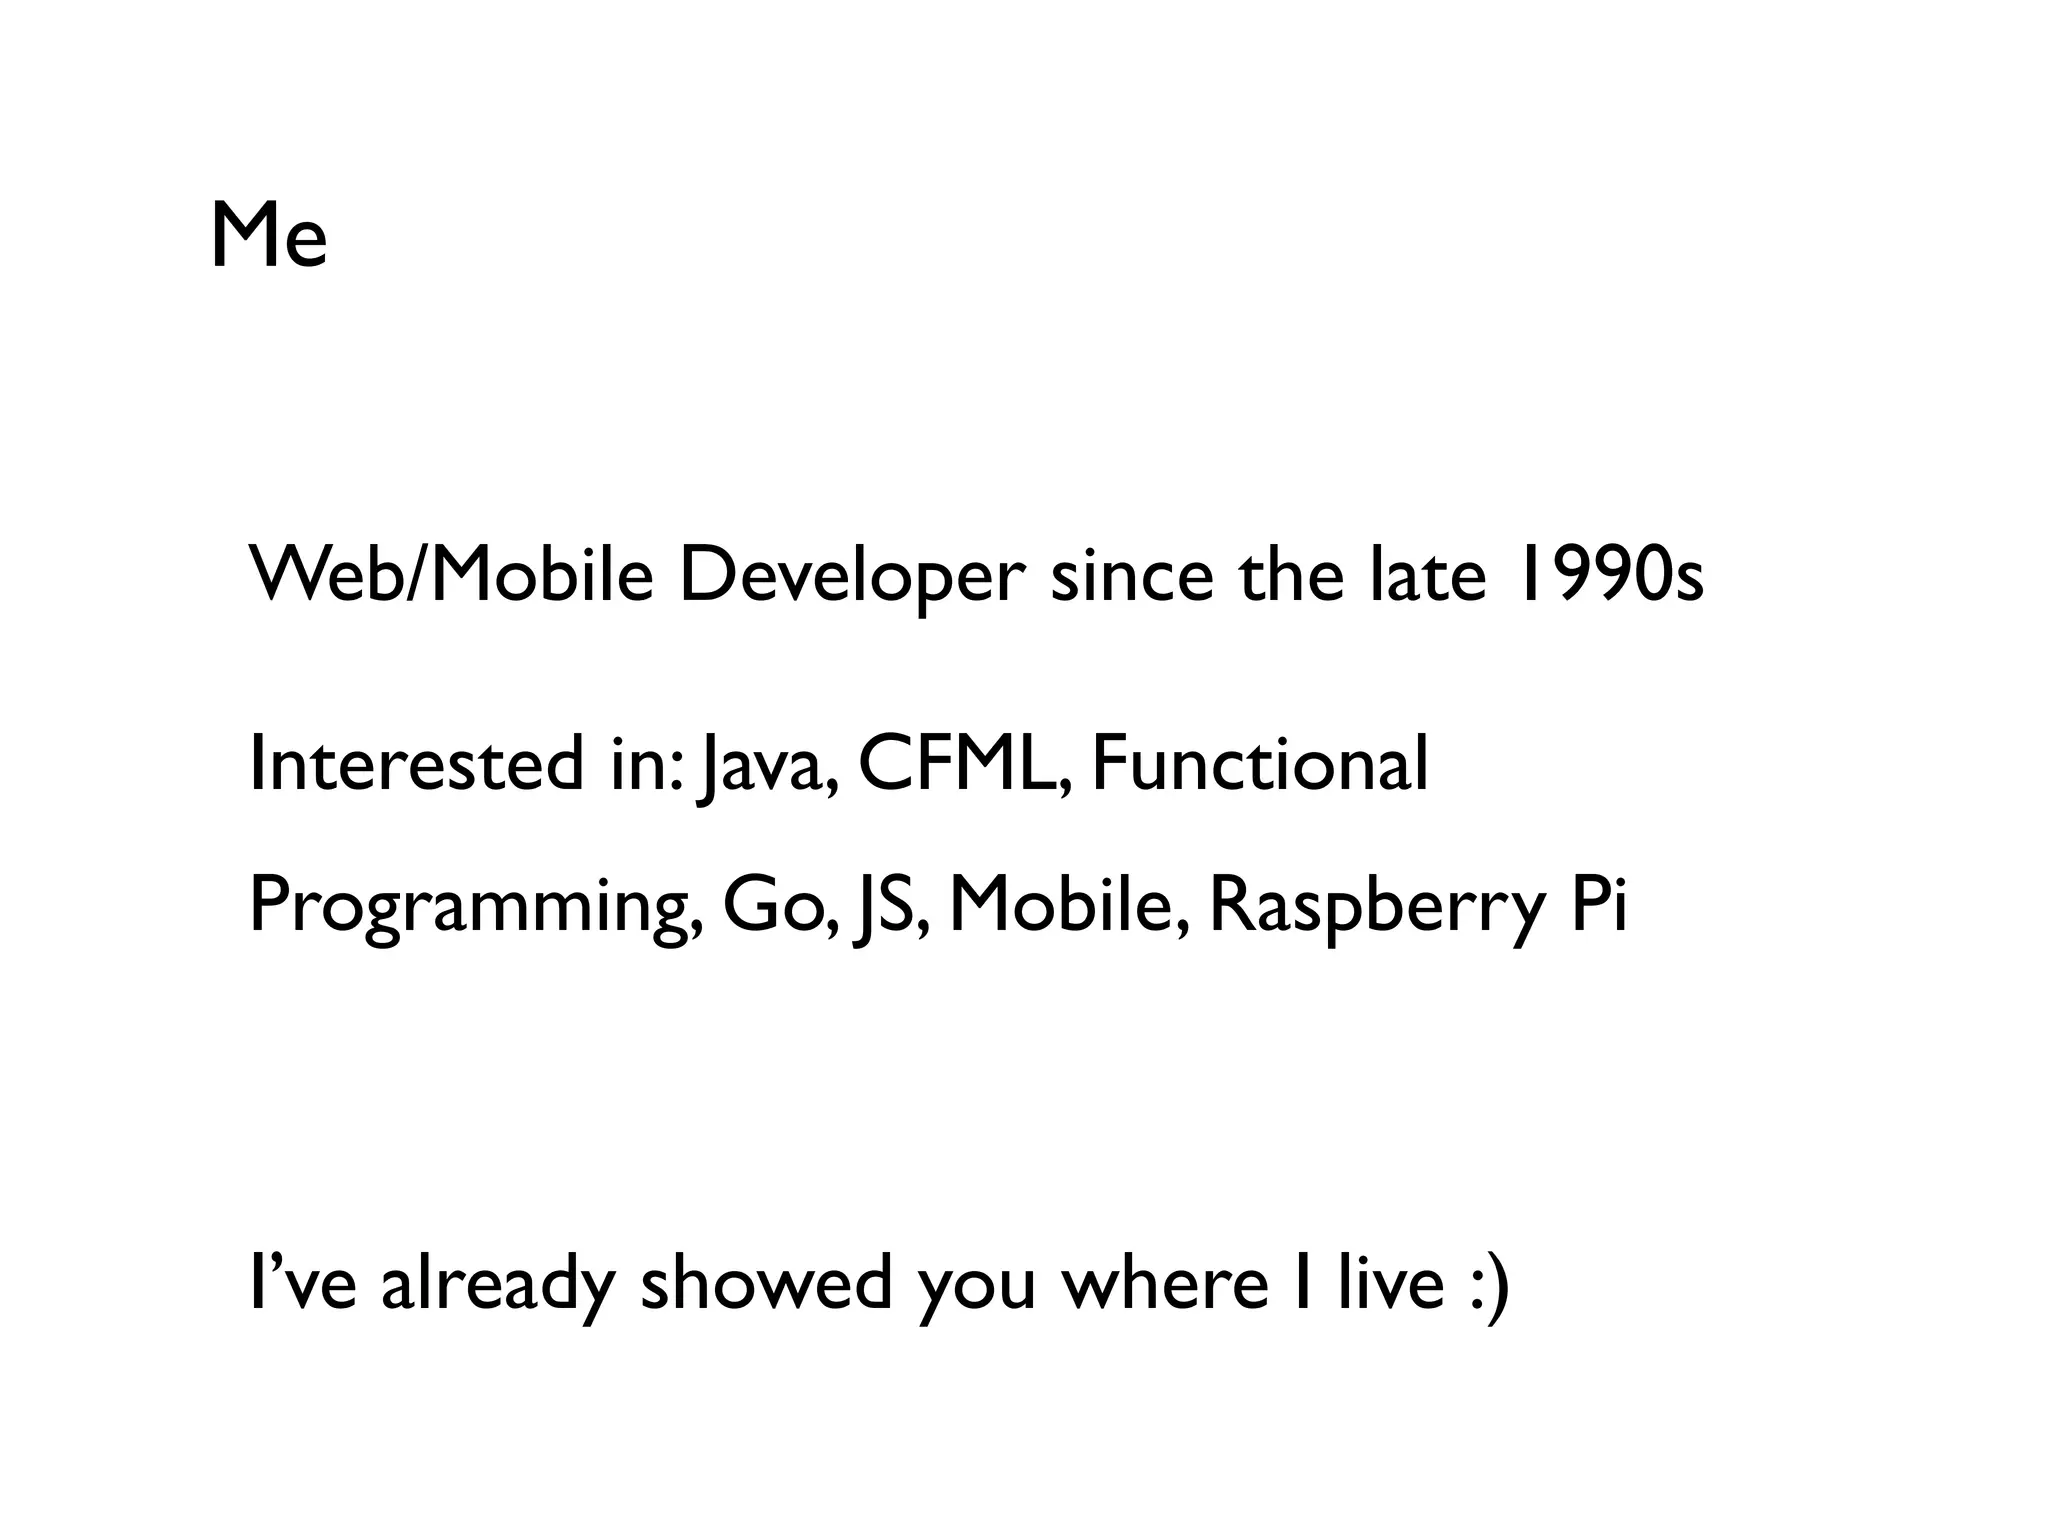
Introduction to the JVM importance by Kai Koenig. The speaker's experience as a developer since the late 1990s, expertise in various languages.
Agenda covers the JVM memory management, garbage collection (GC) importance, and tuning approaches.
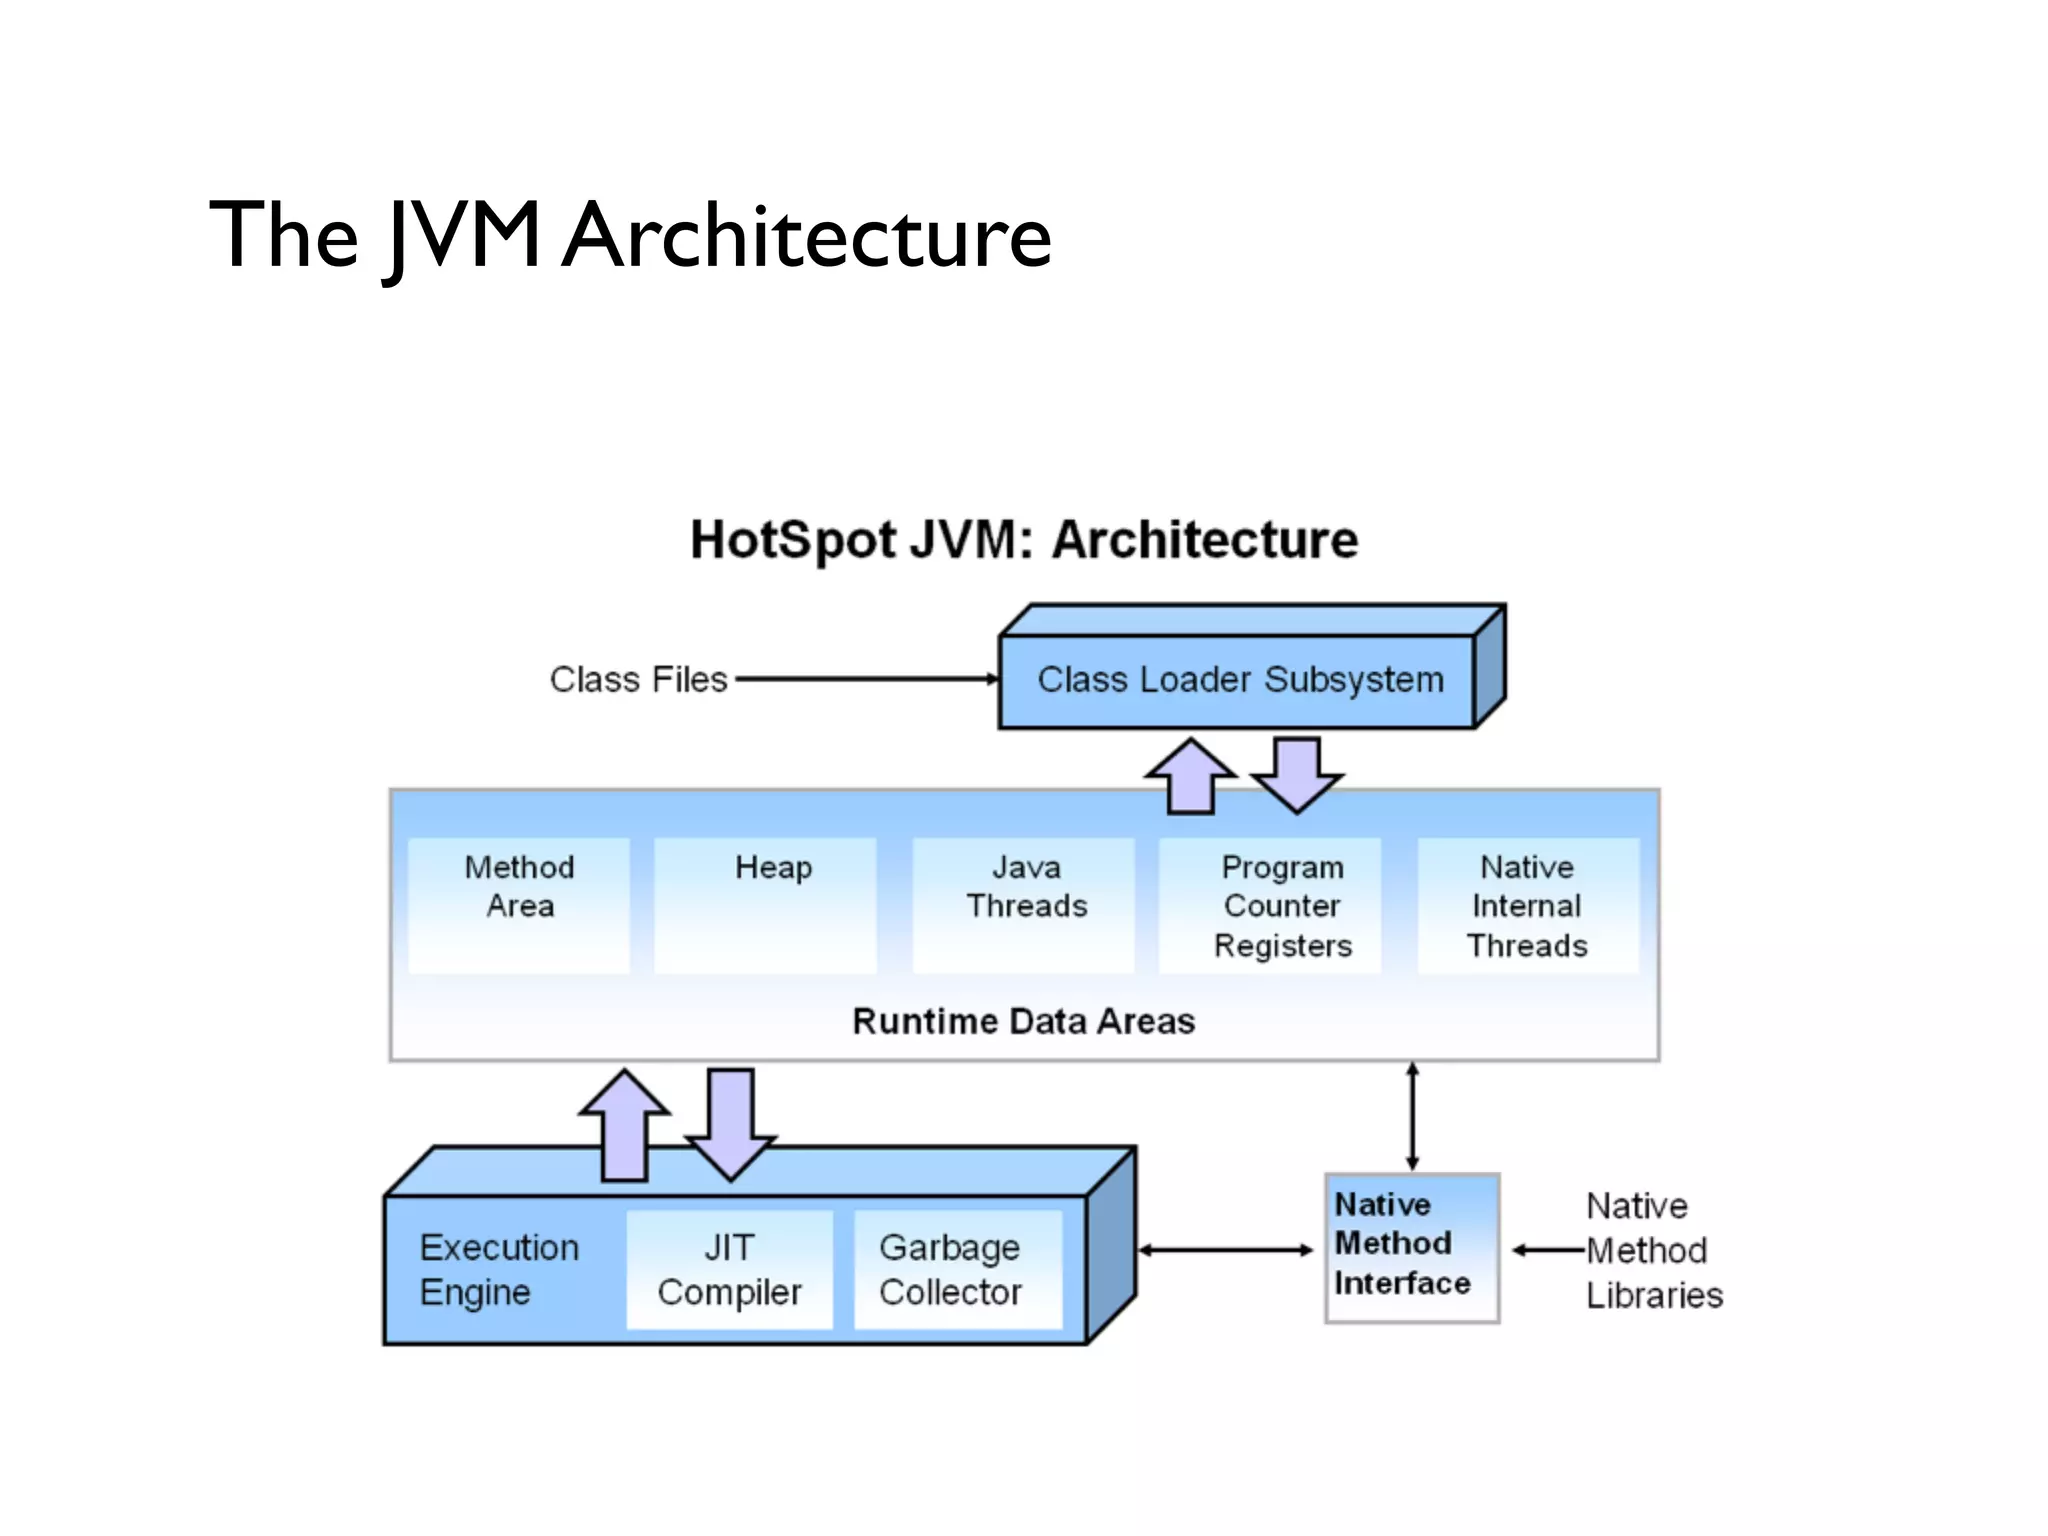
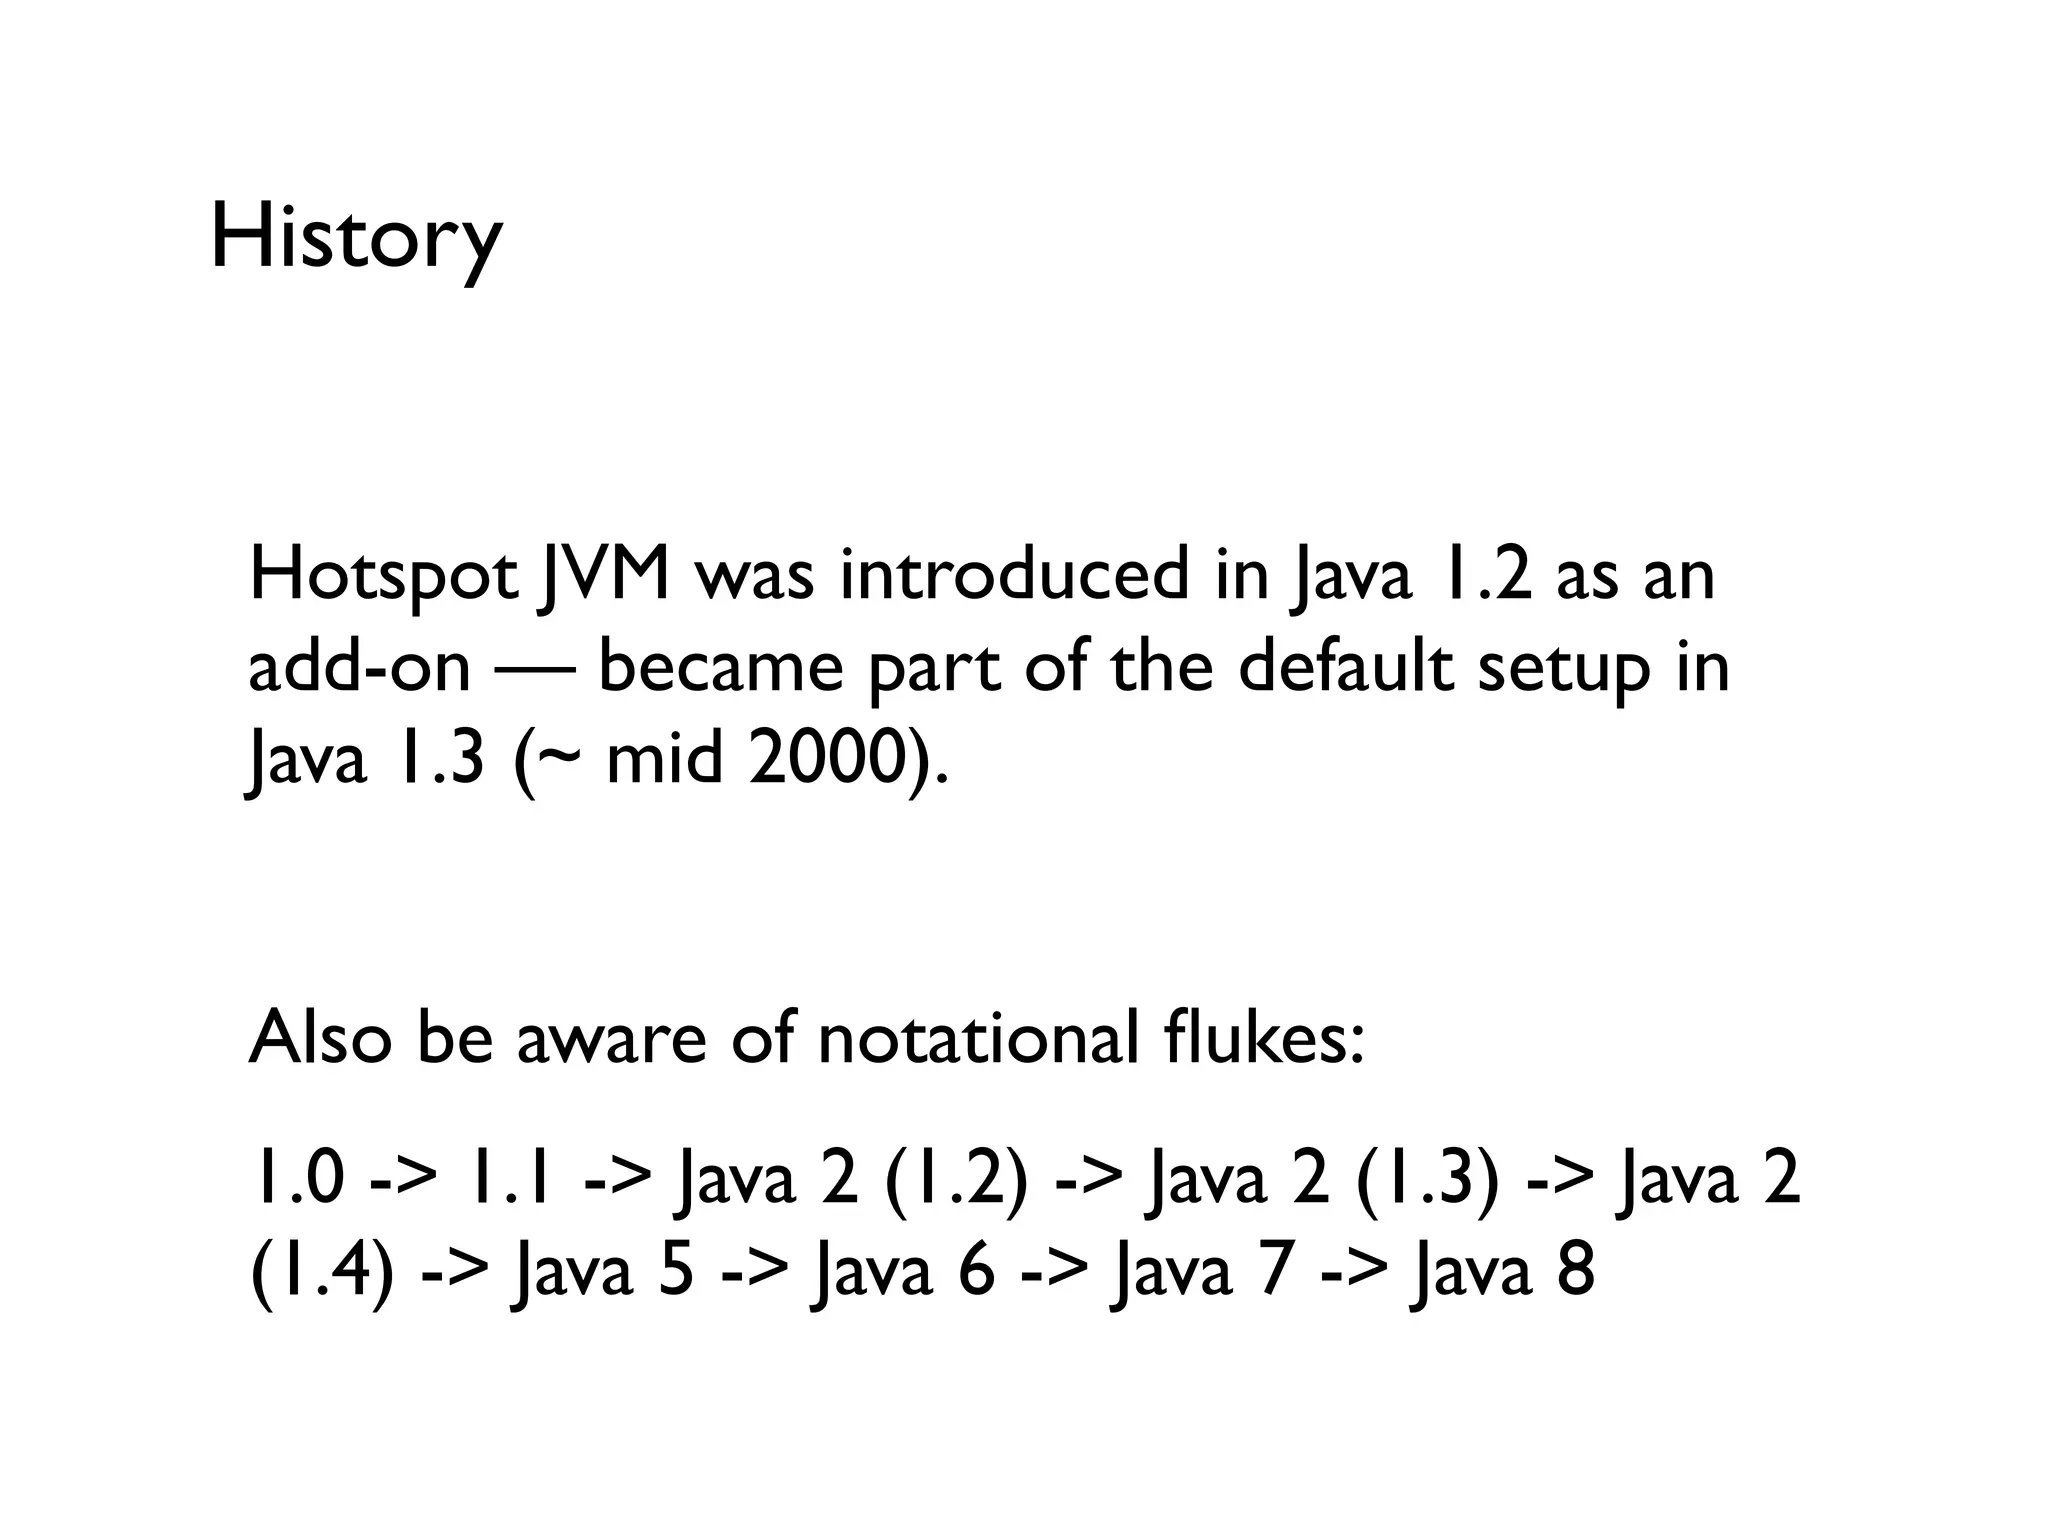
Explanation of JVM architecture and history of JVM development, evolving memory management techniques.
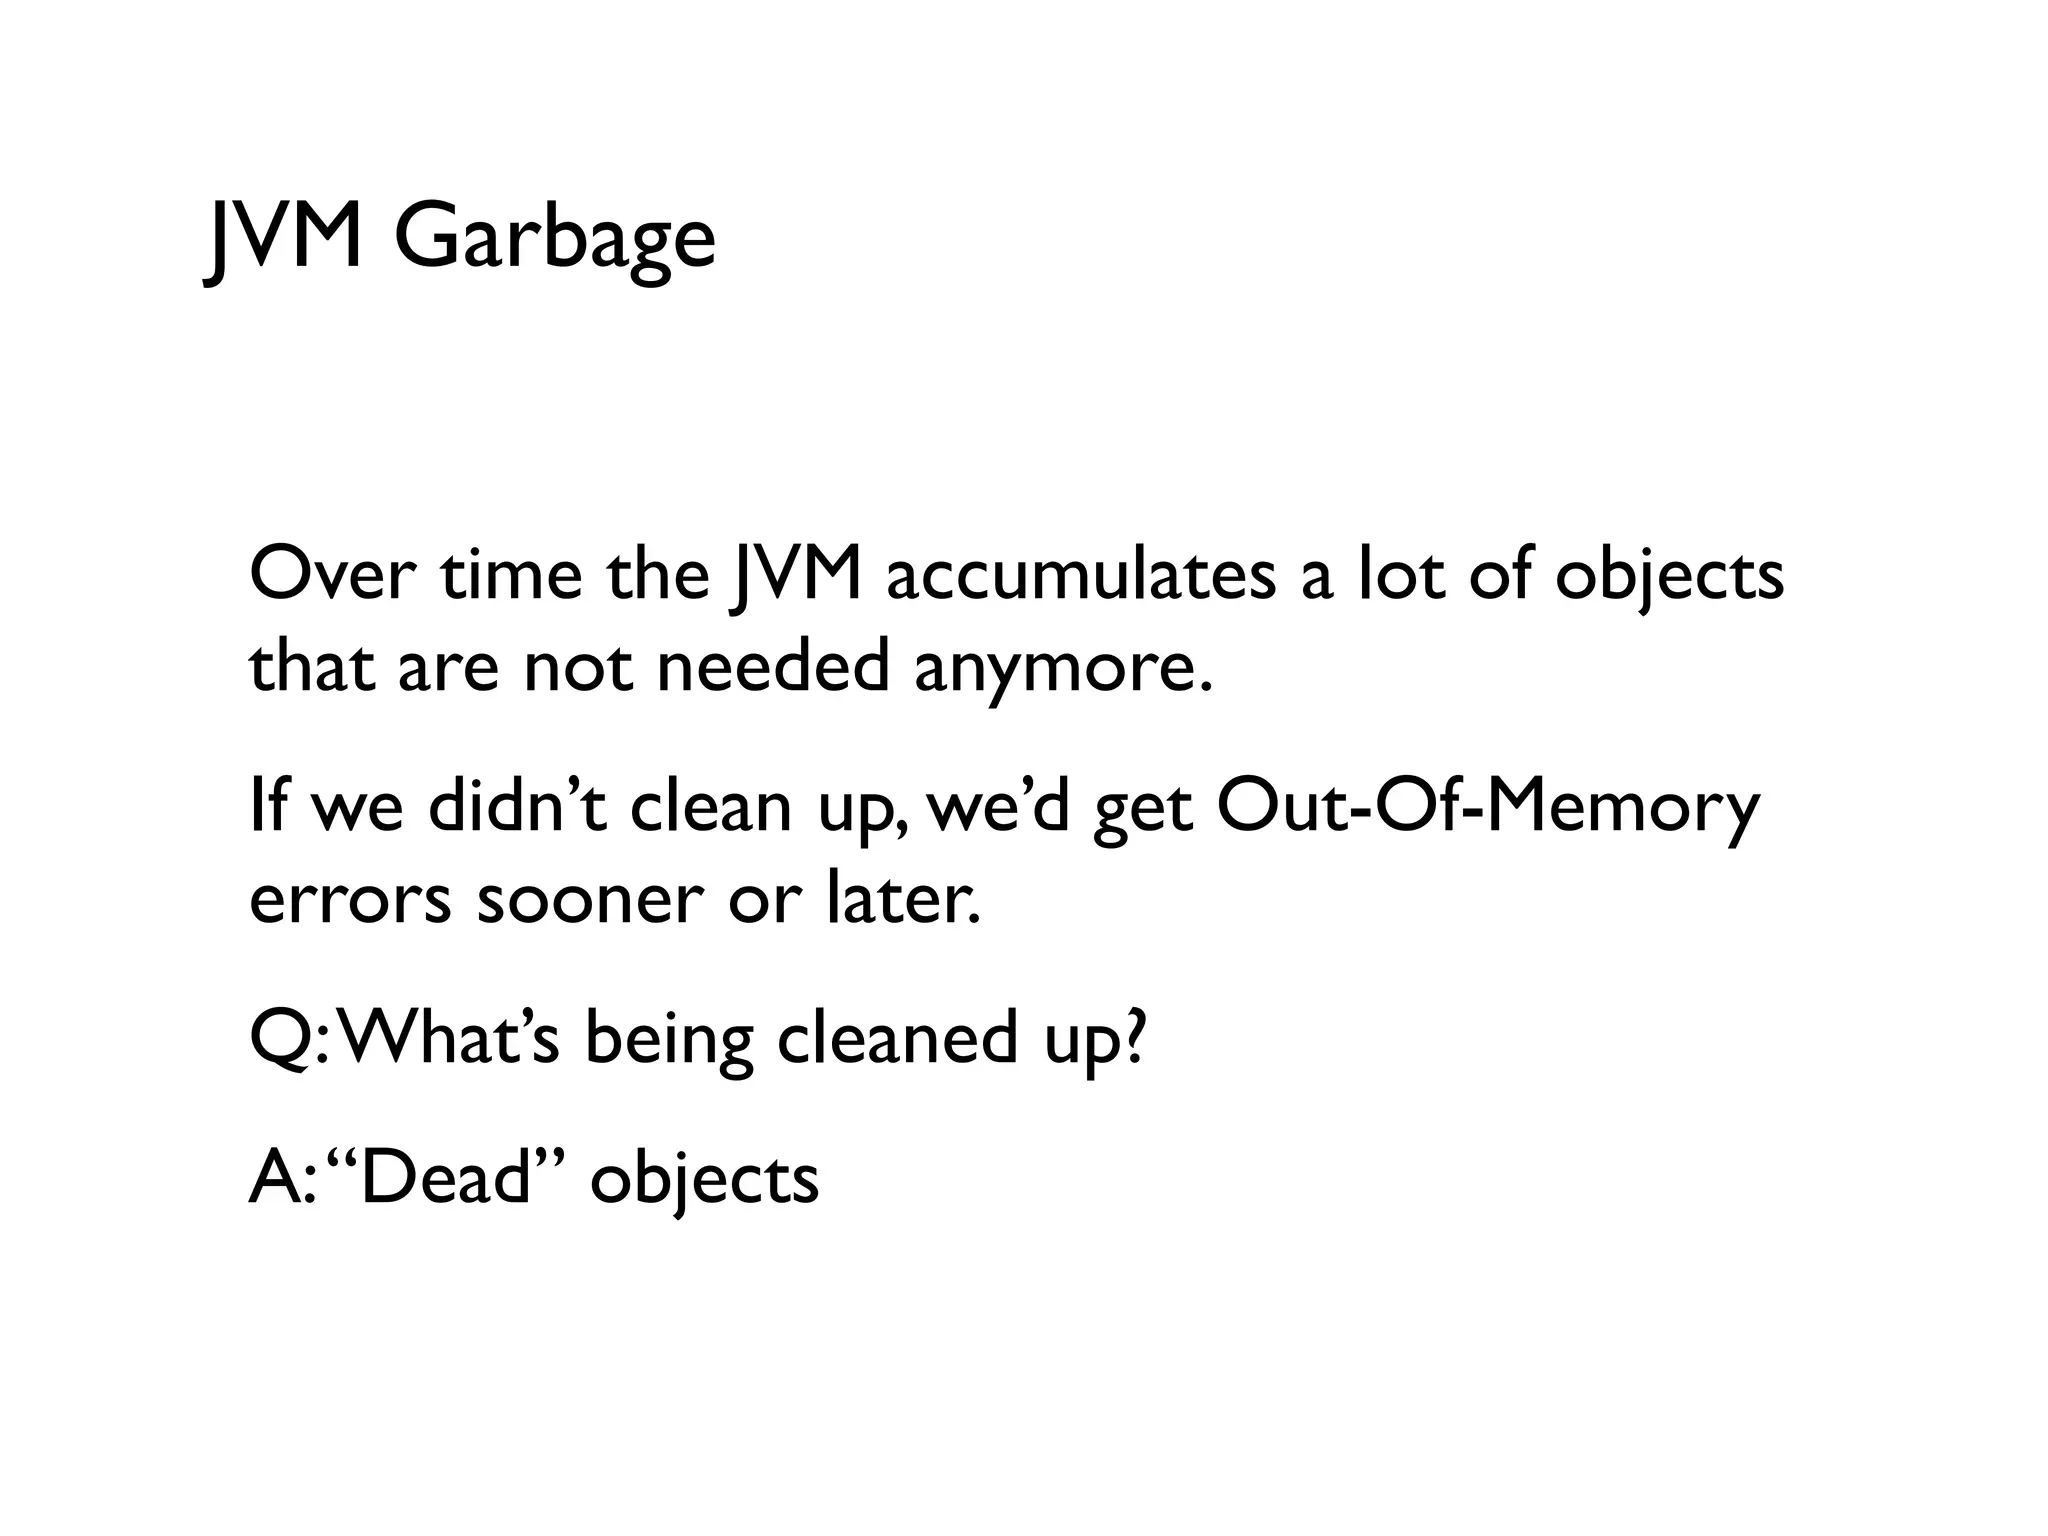
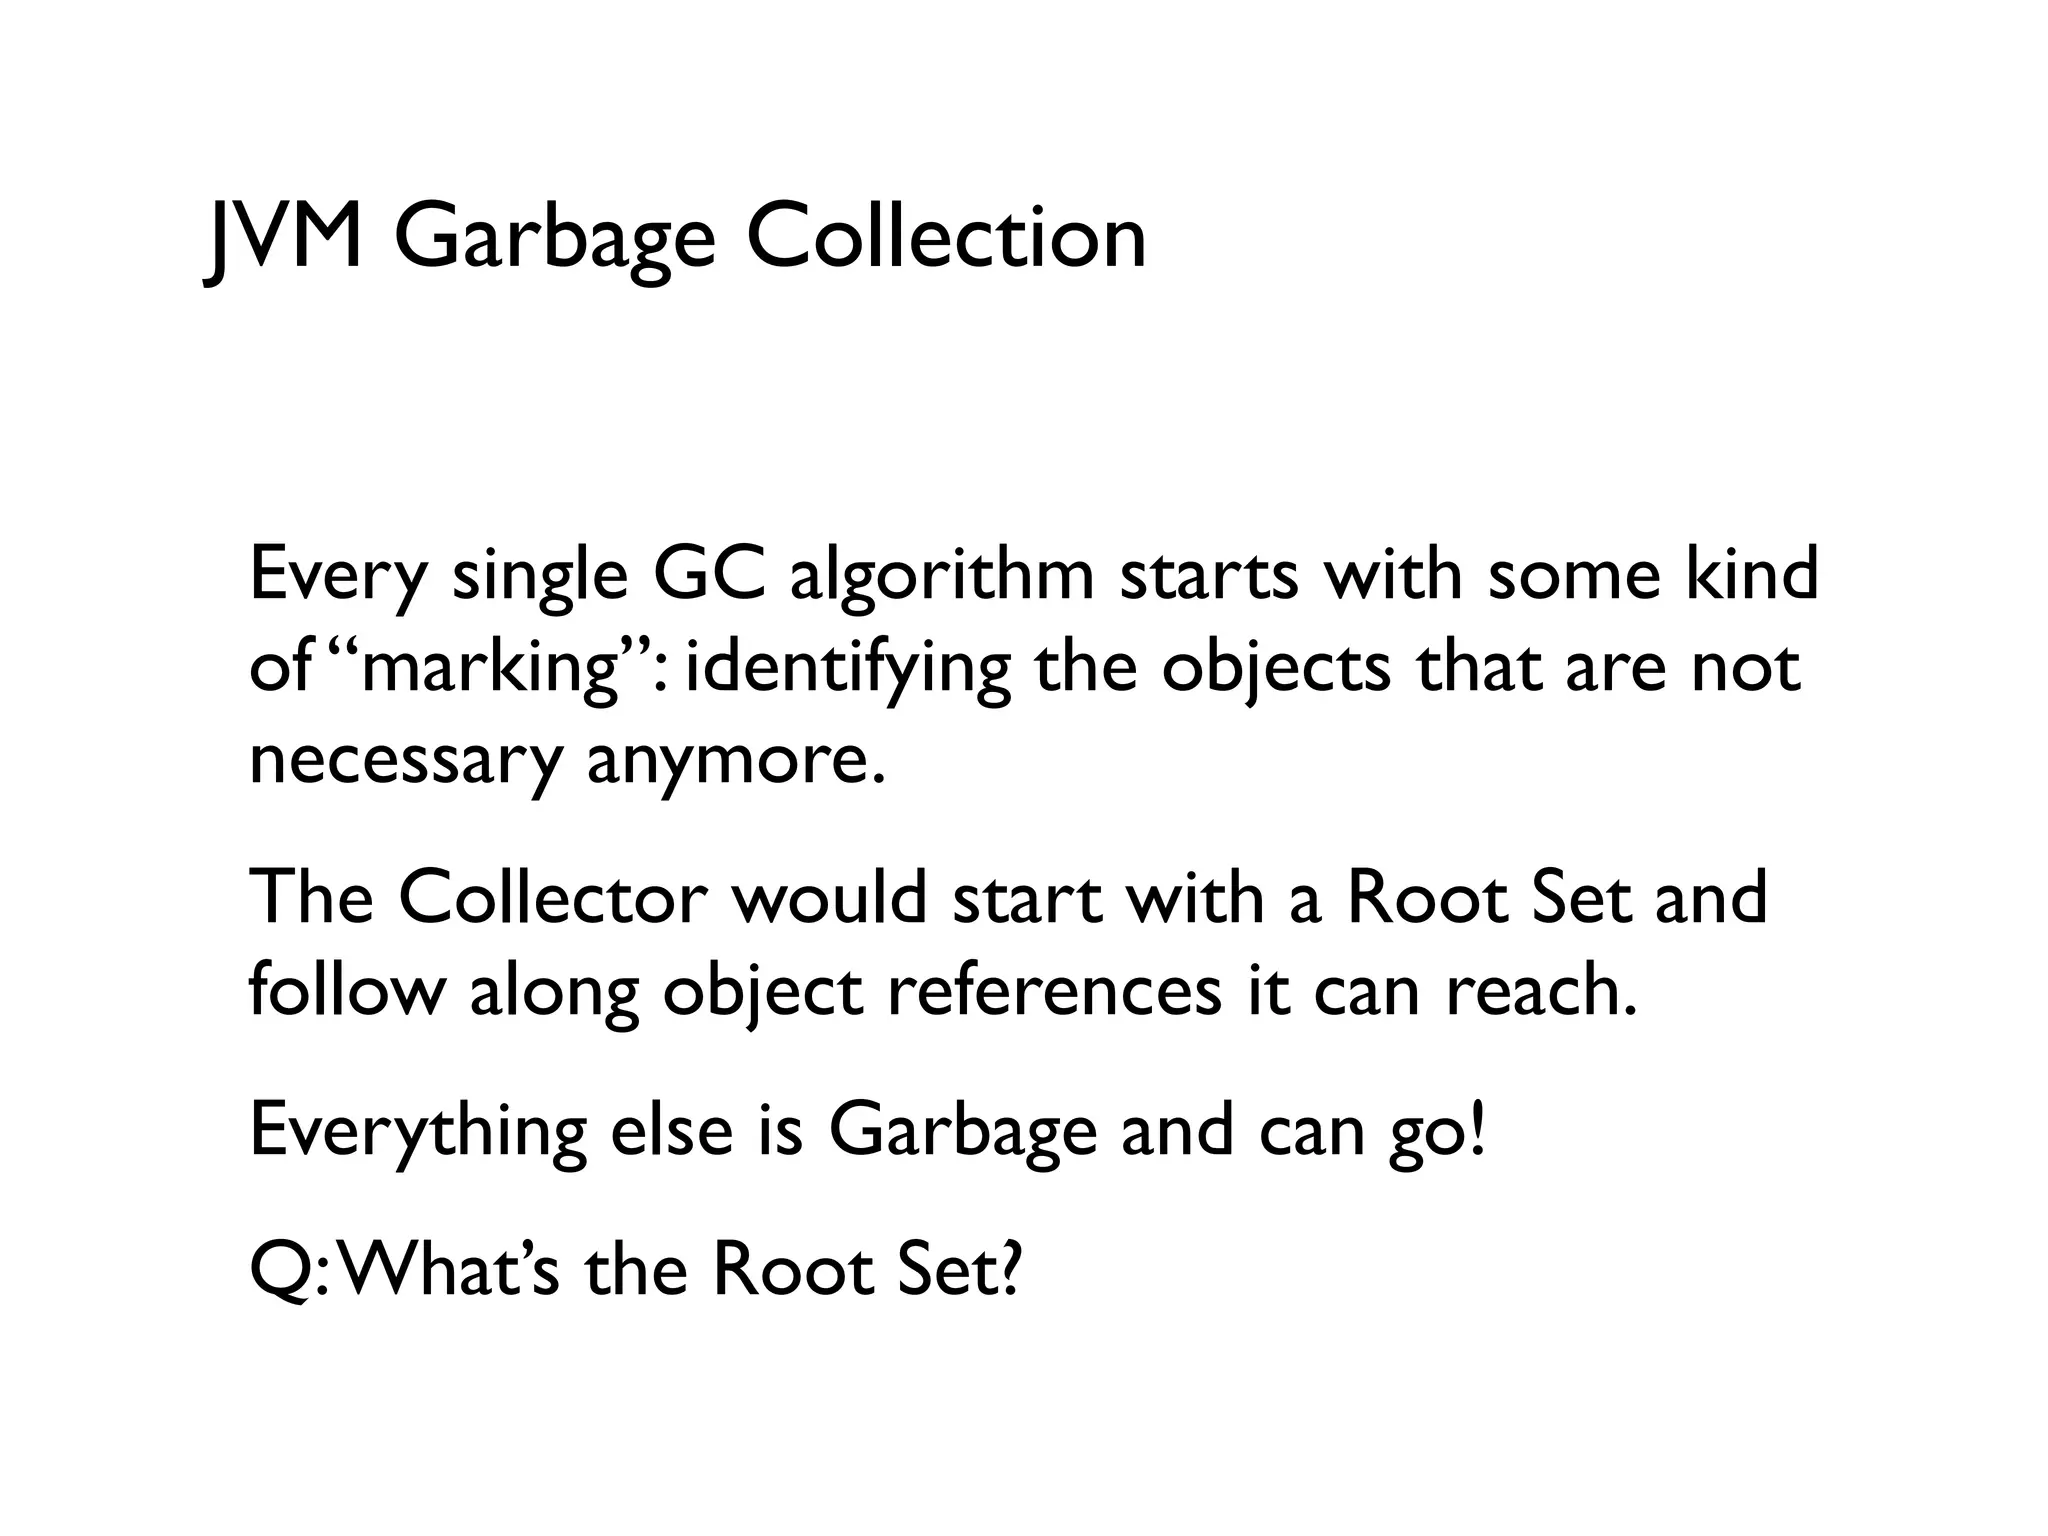
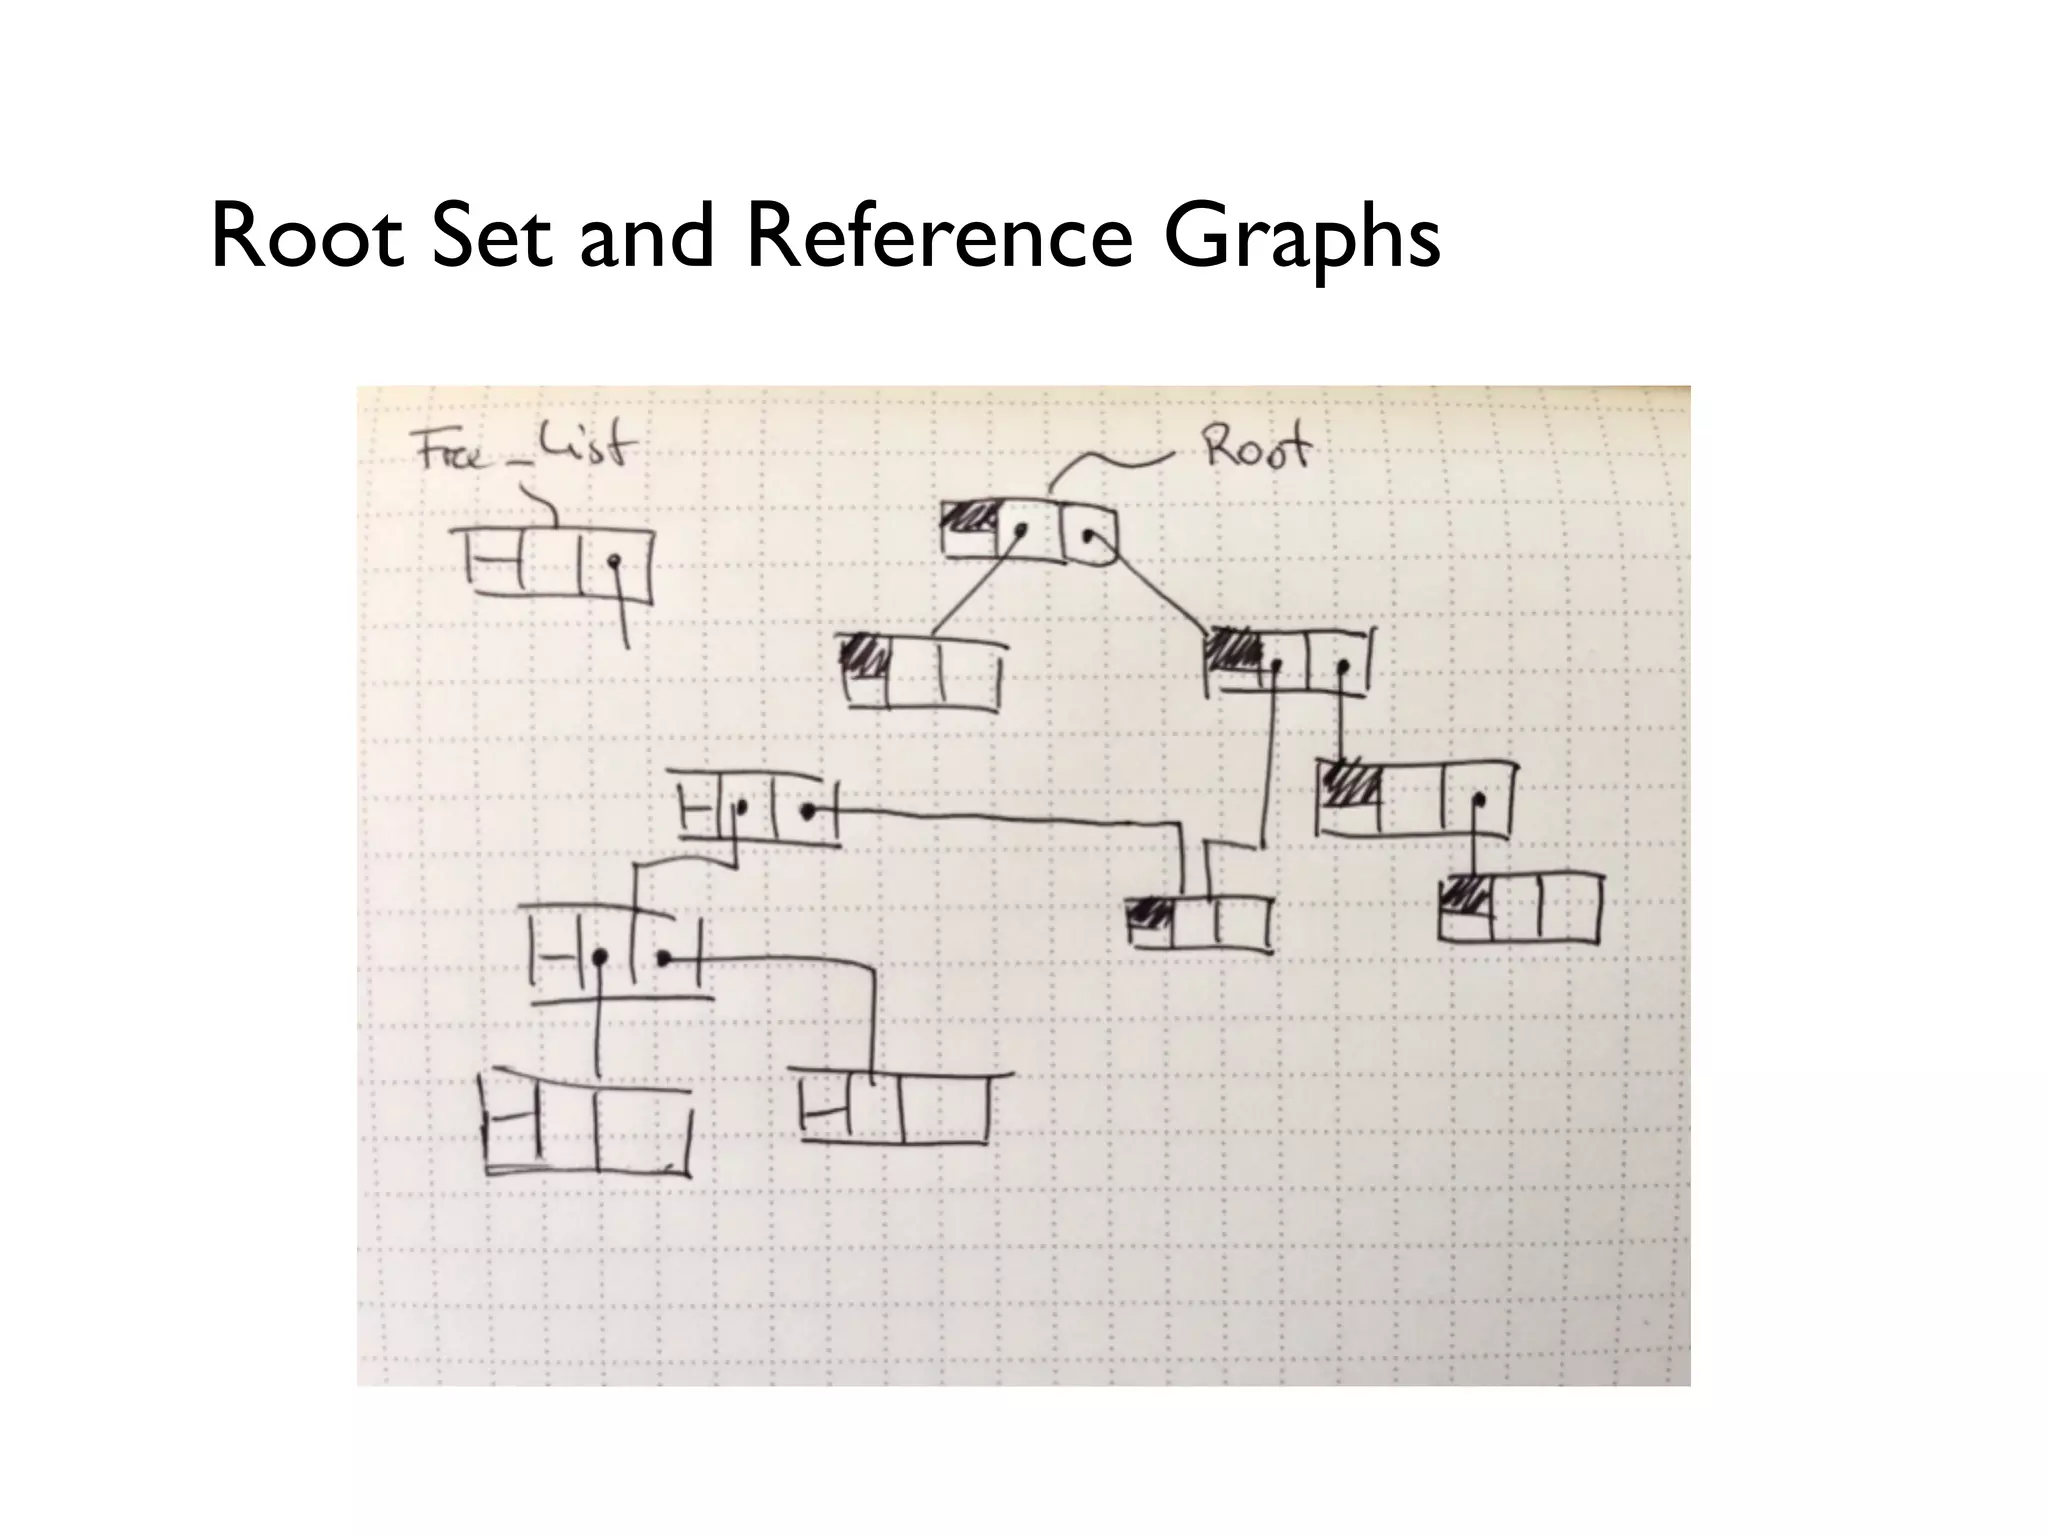
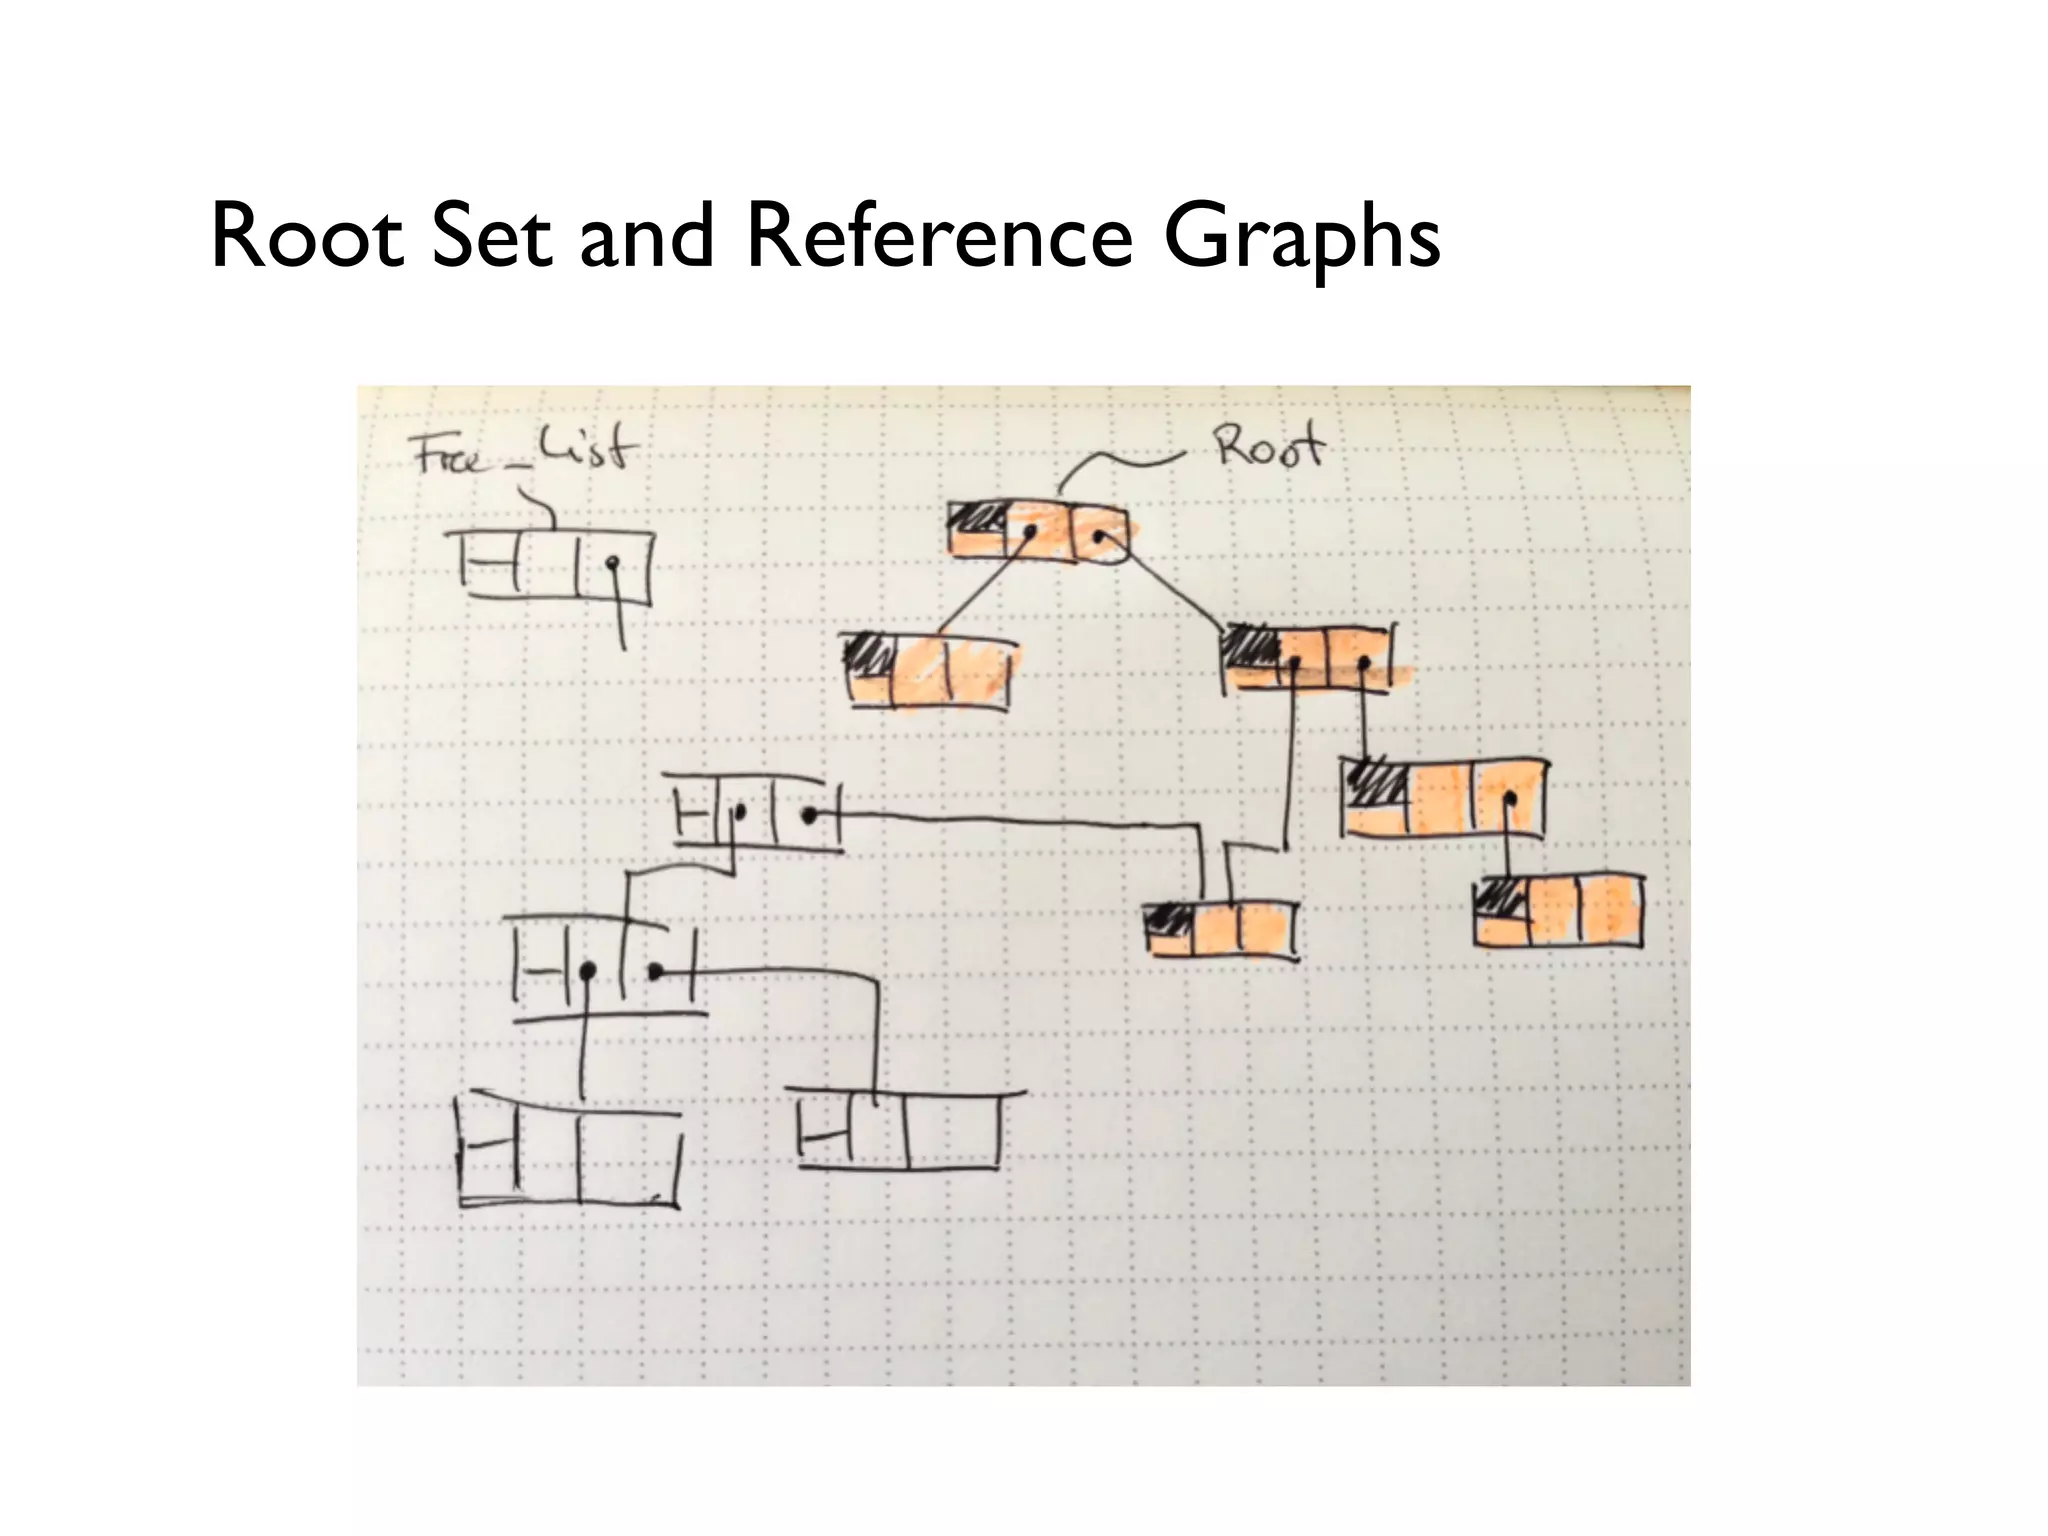
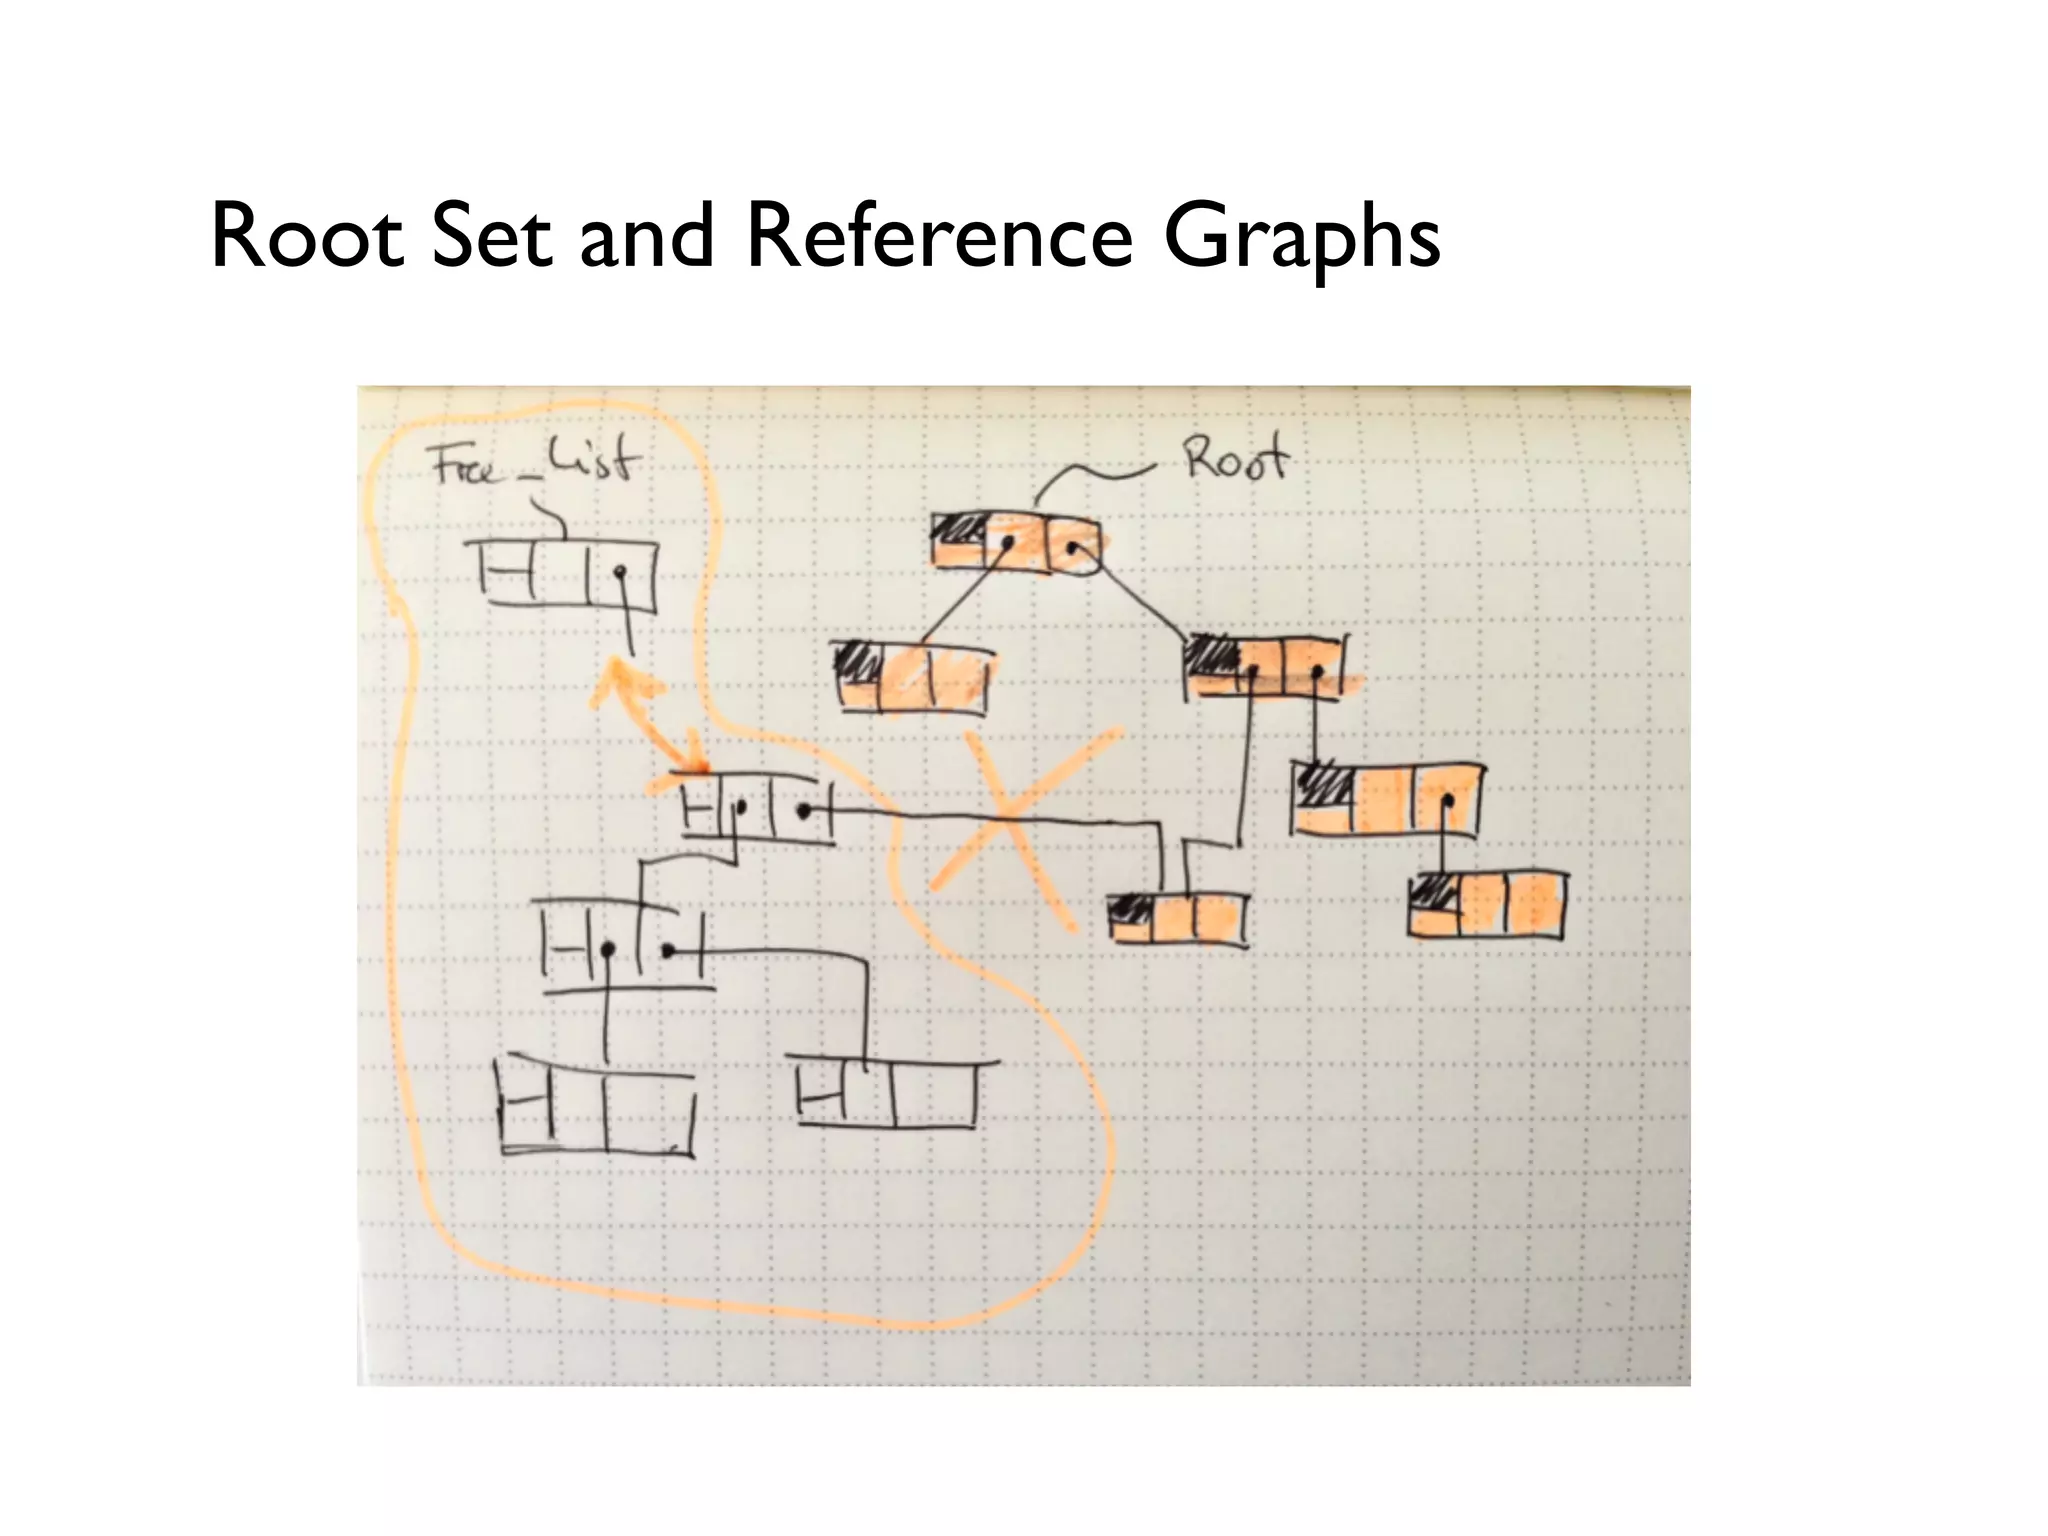
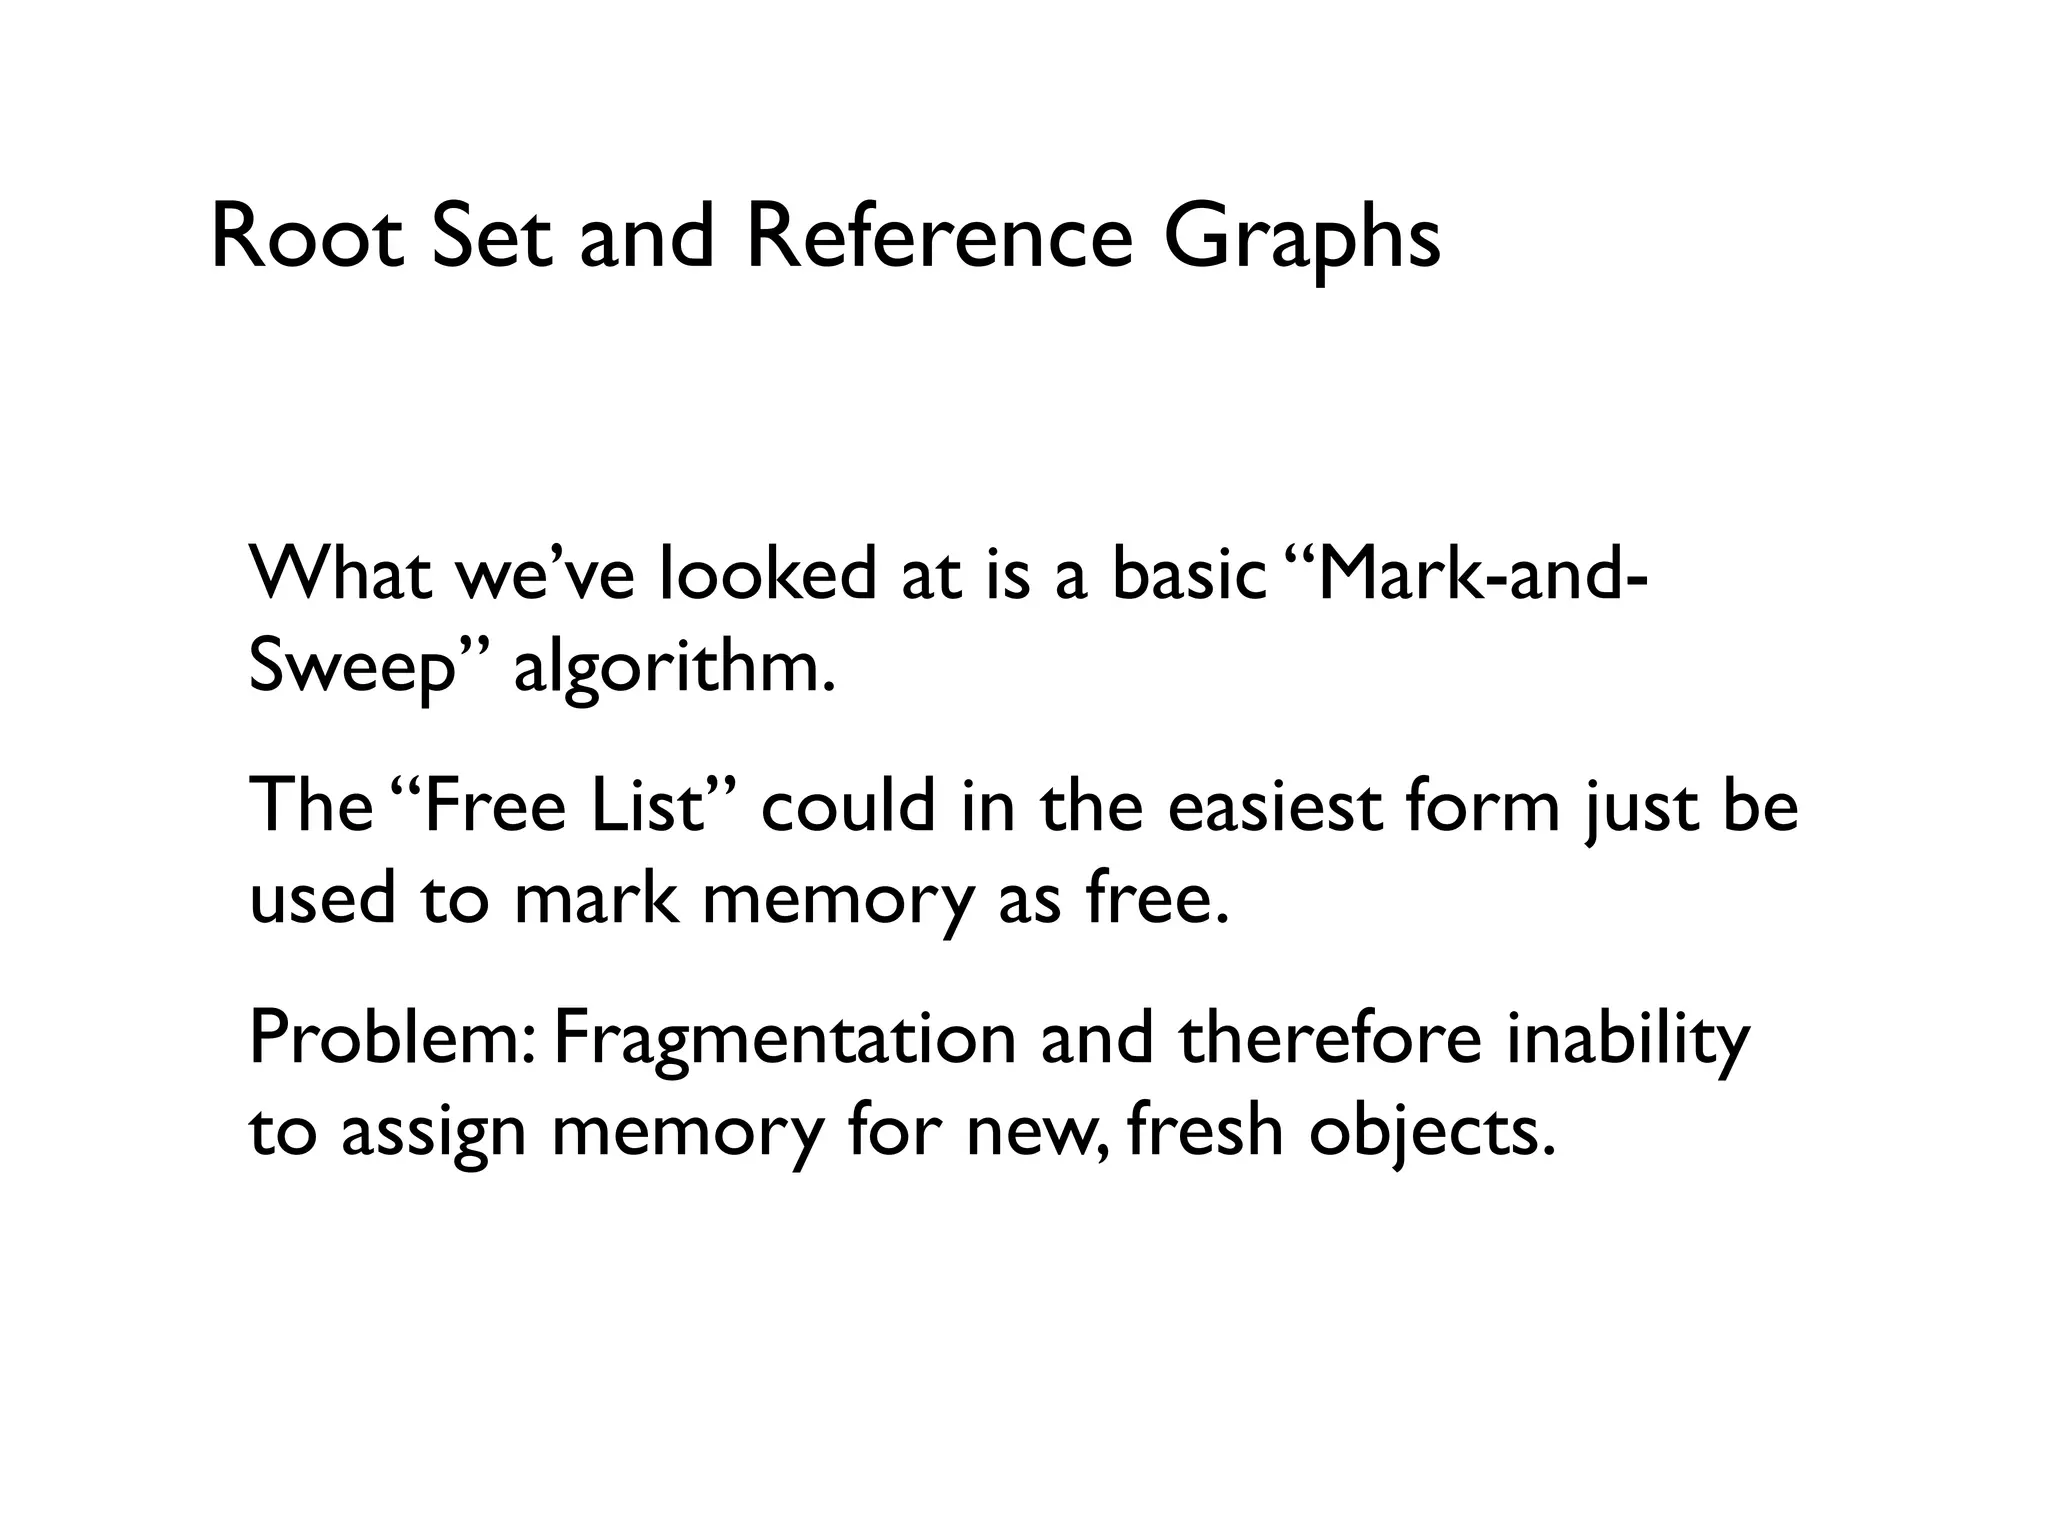
Discusses garbage collection concepts, the cleaning process of dead objects, and the mark-and-sweep algorithm.
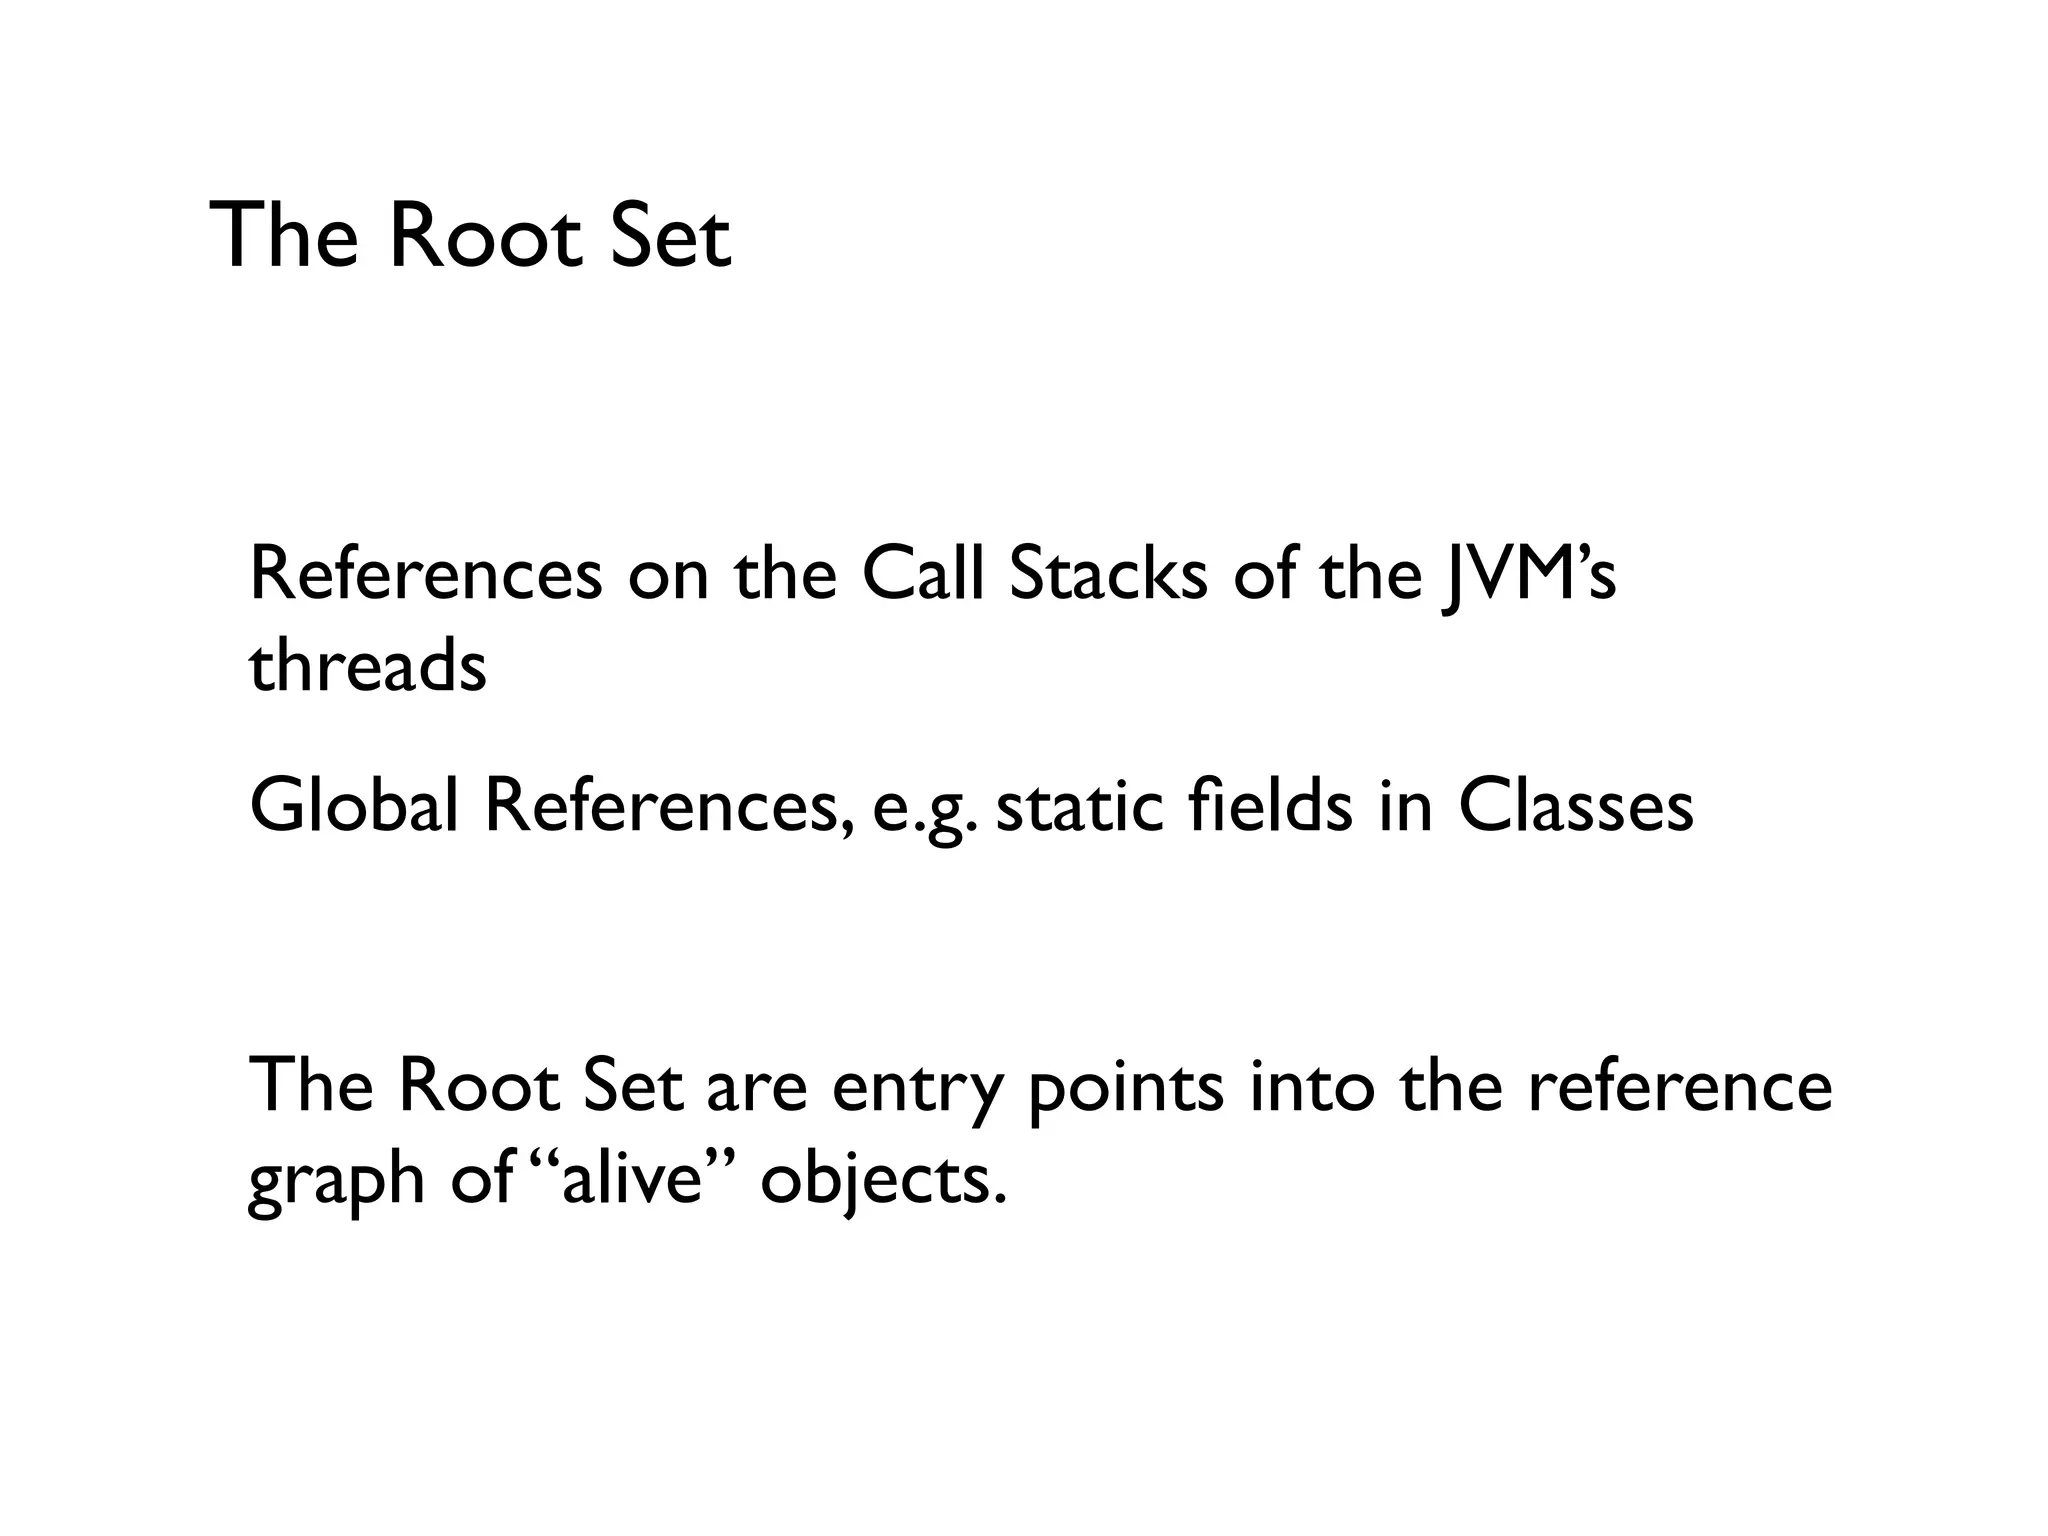
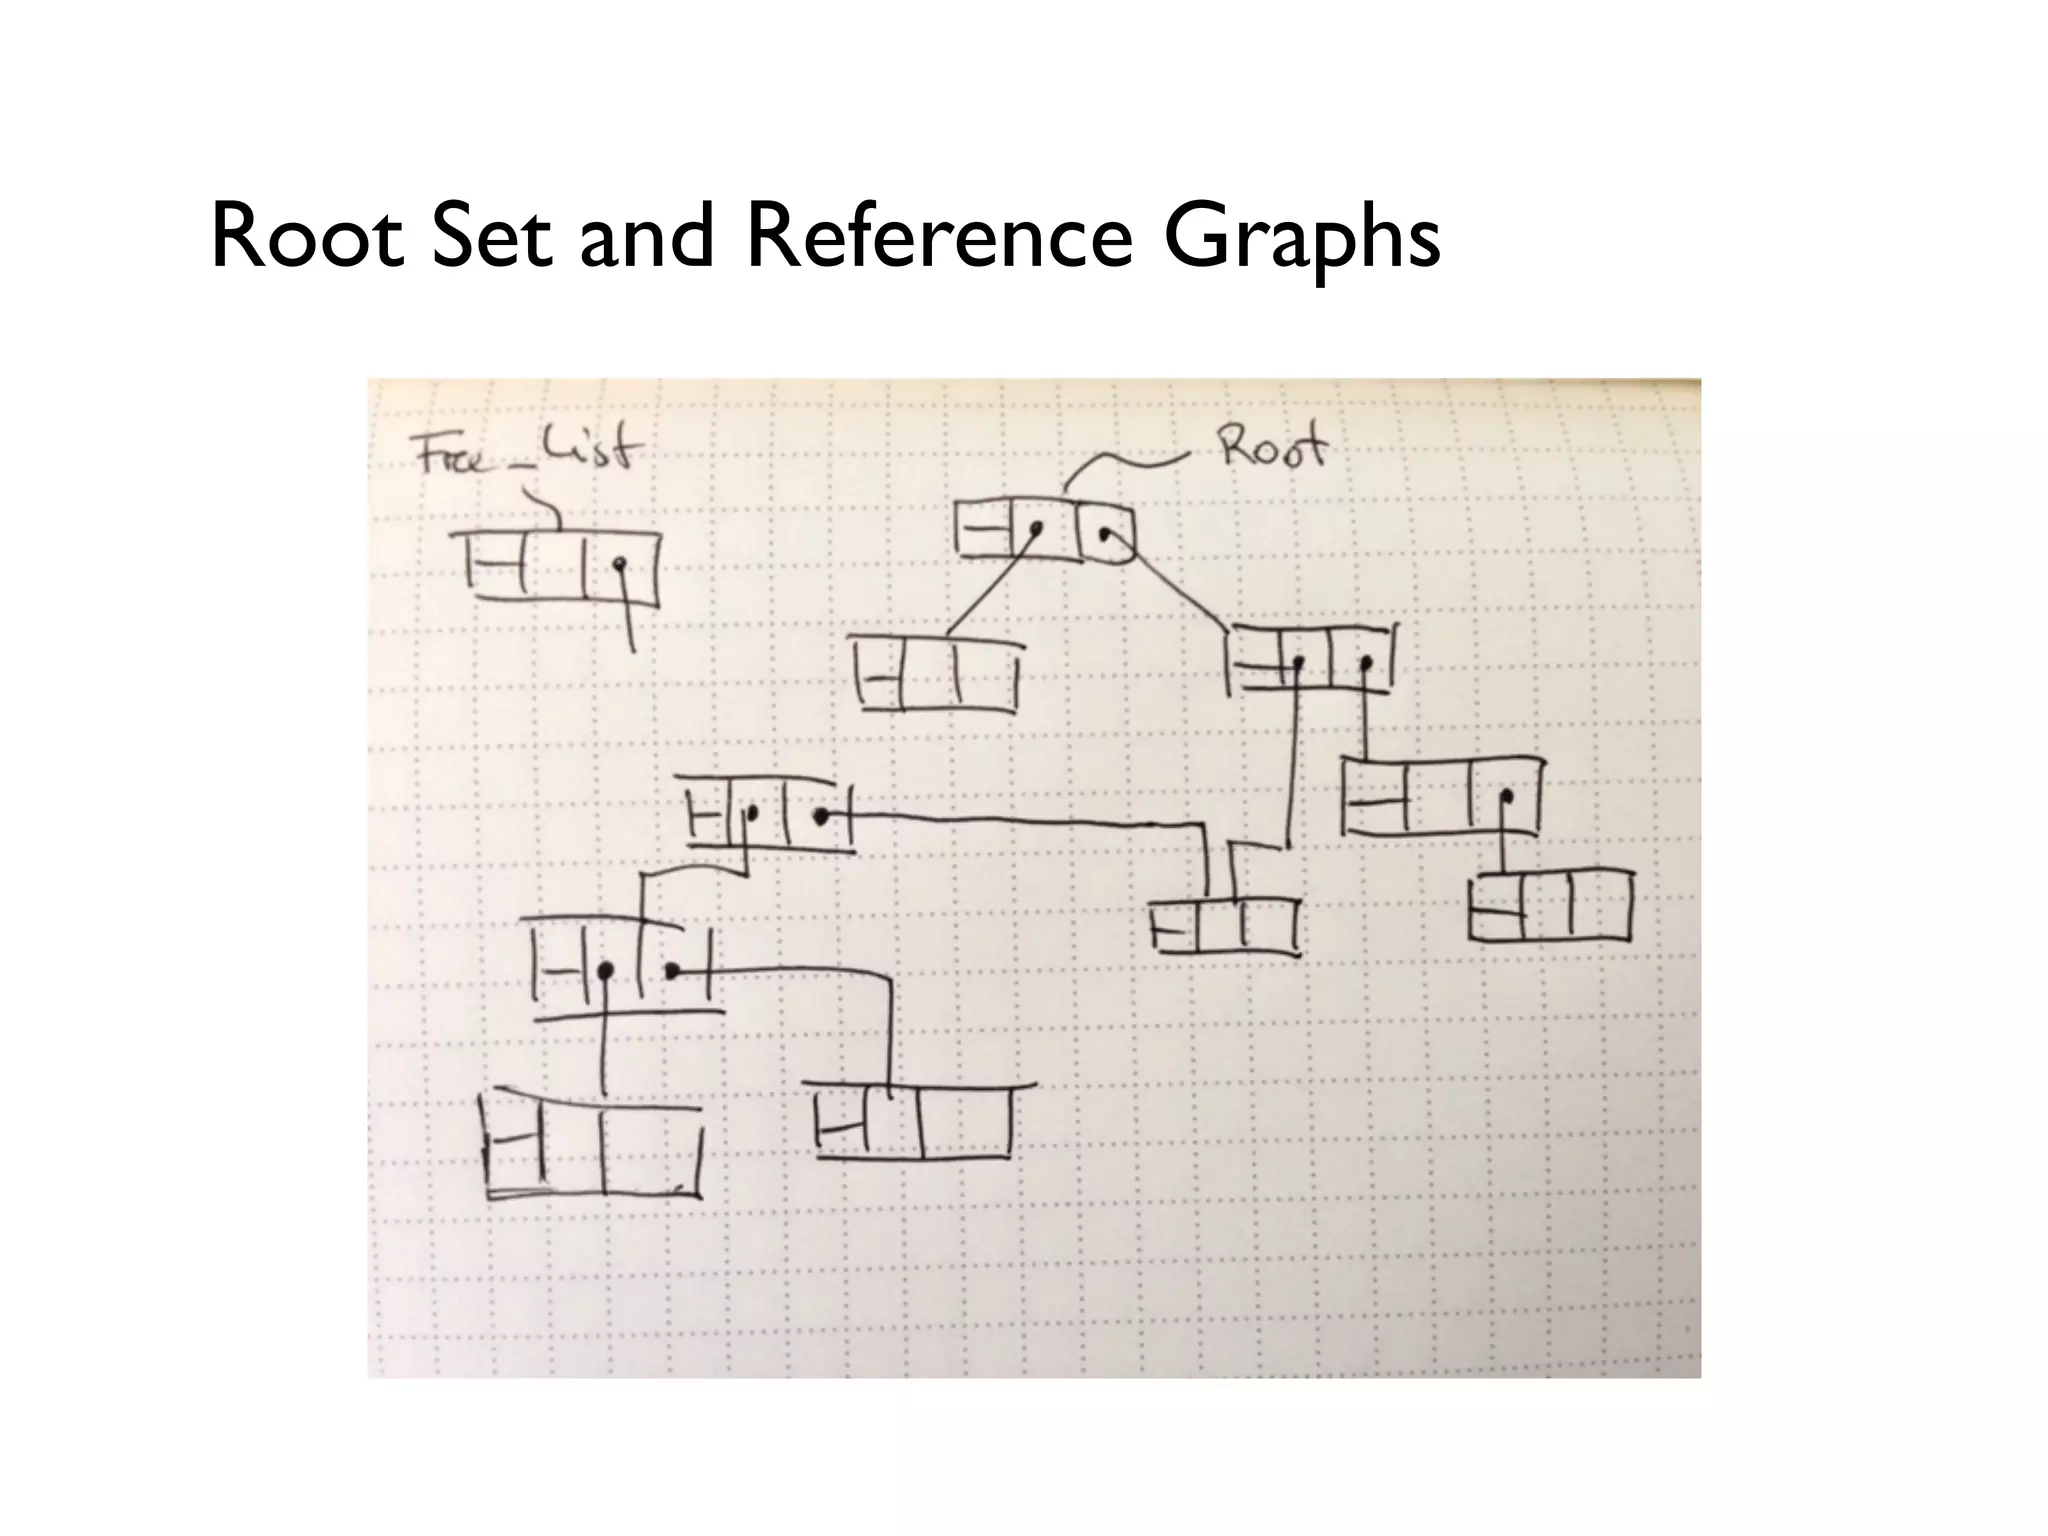
Explains the notion of root sets and their role in identifying live objects versus garbage.
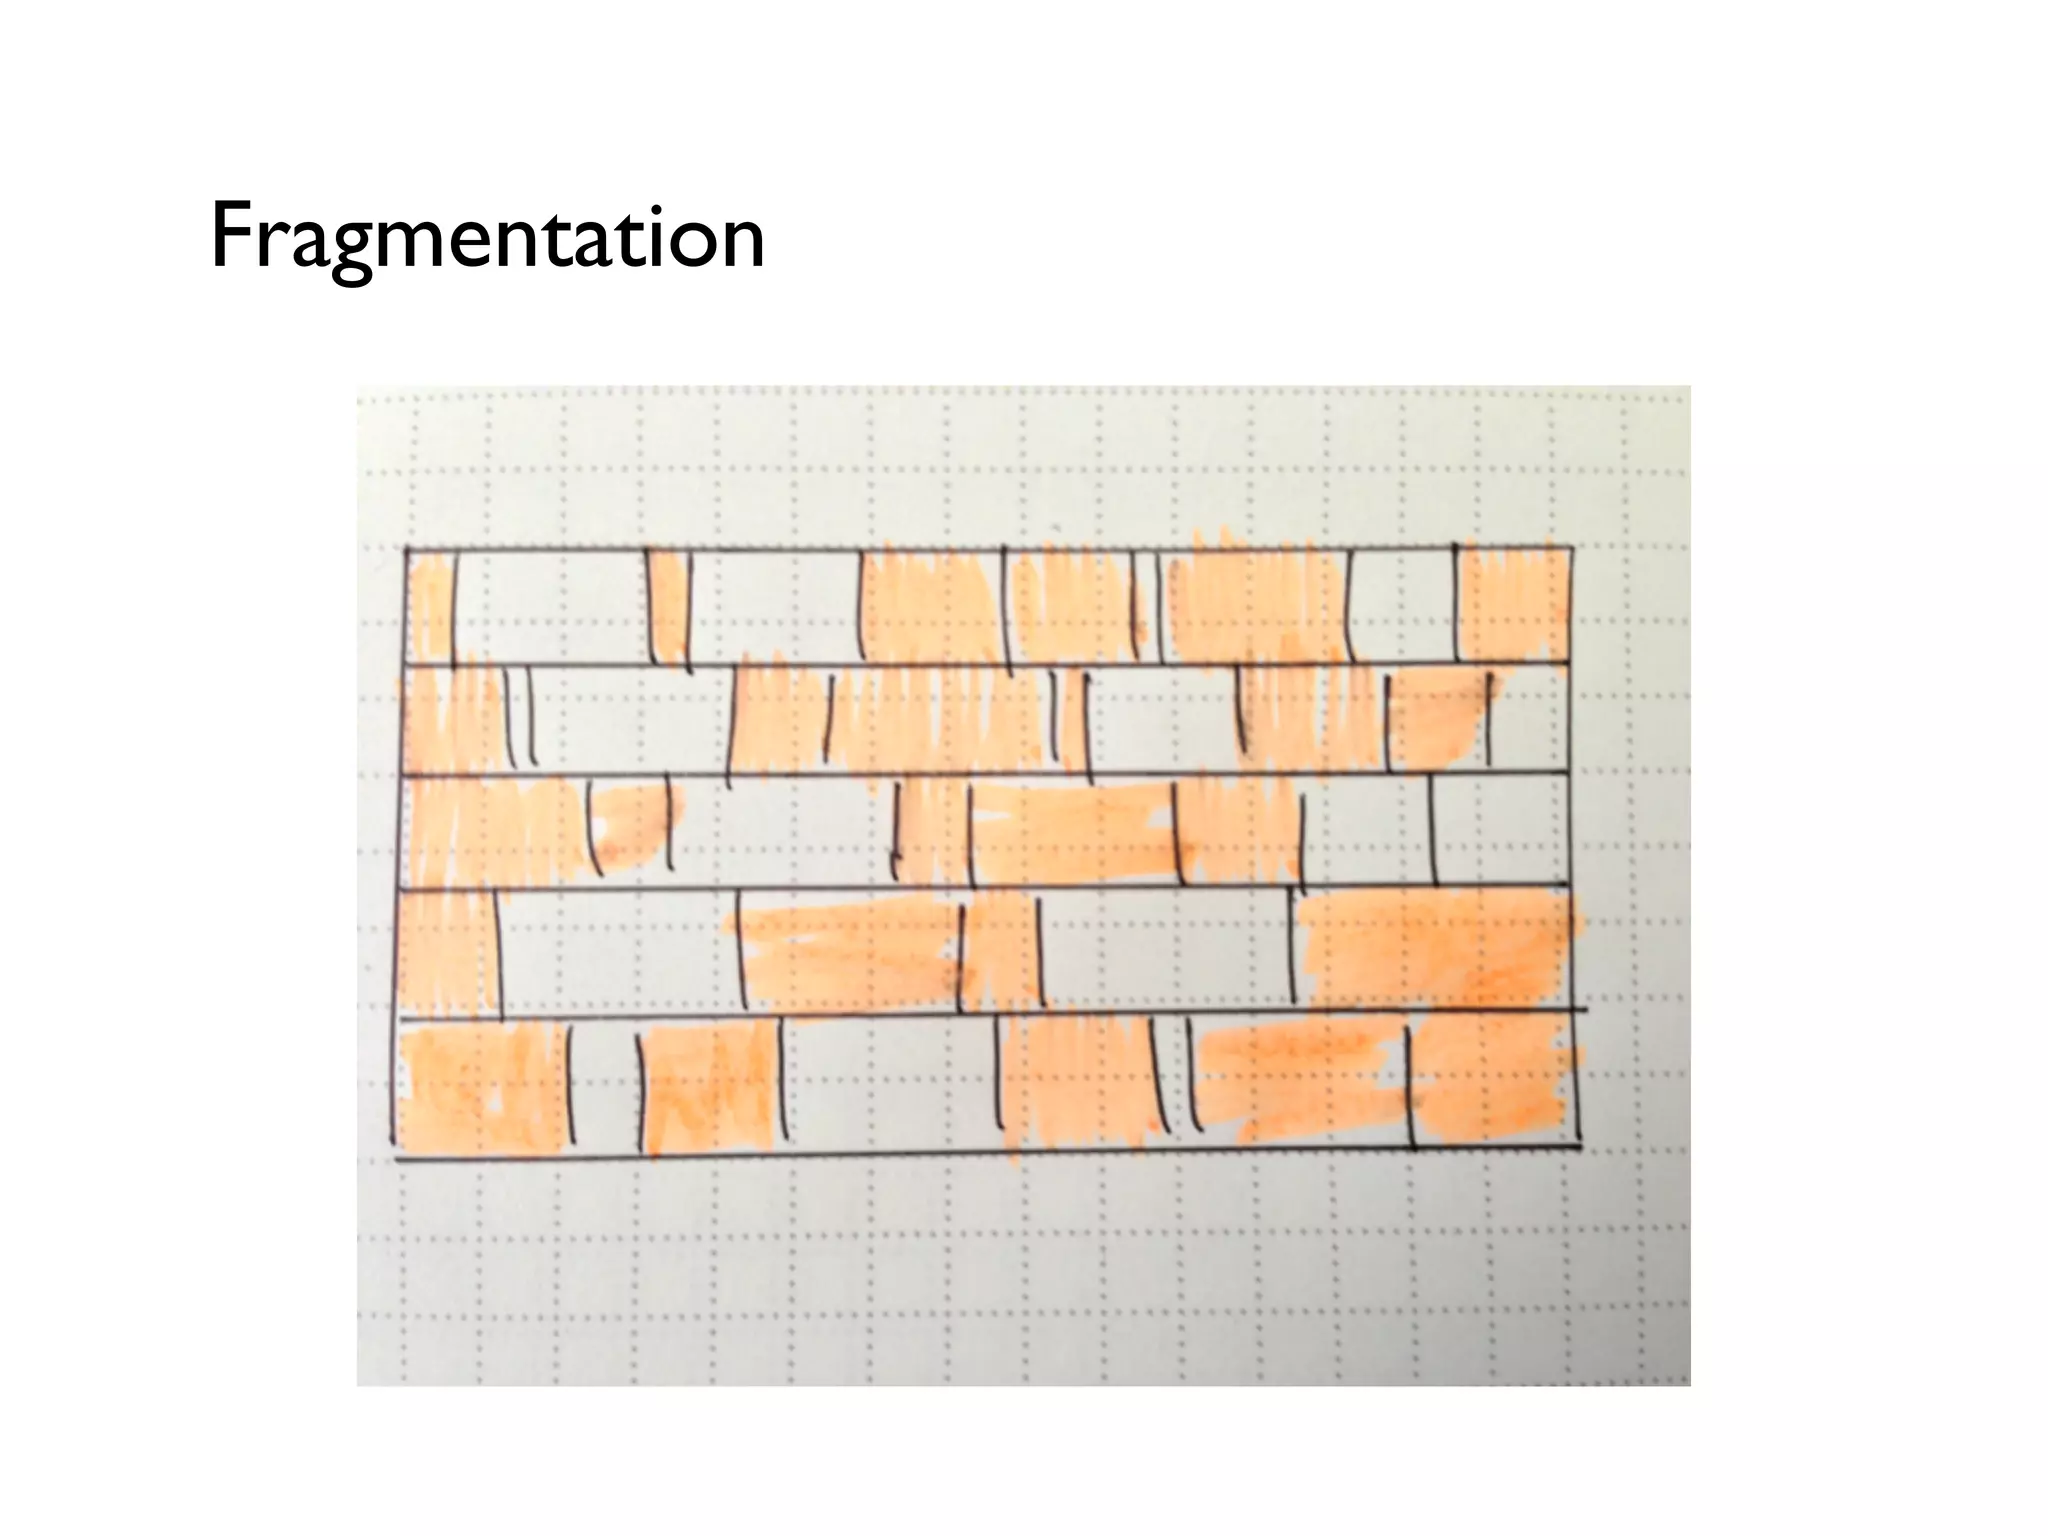
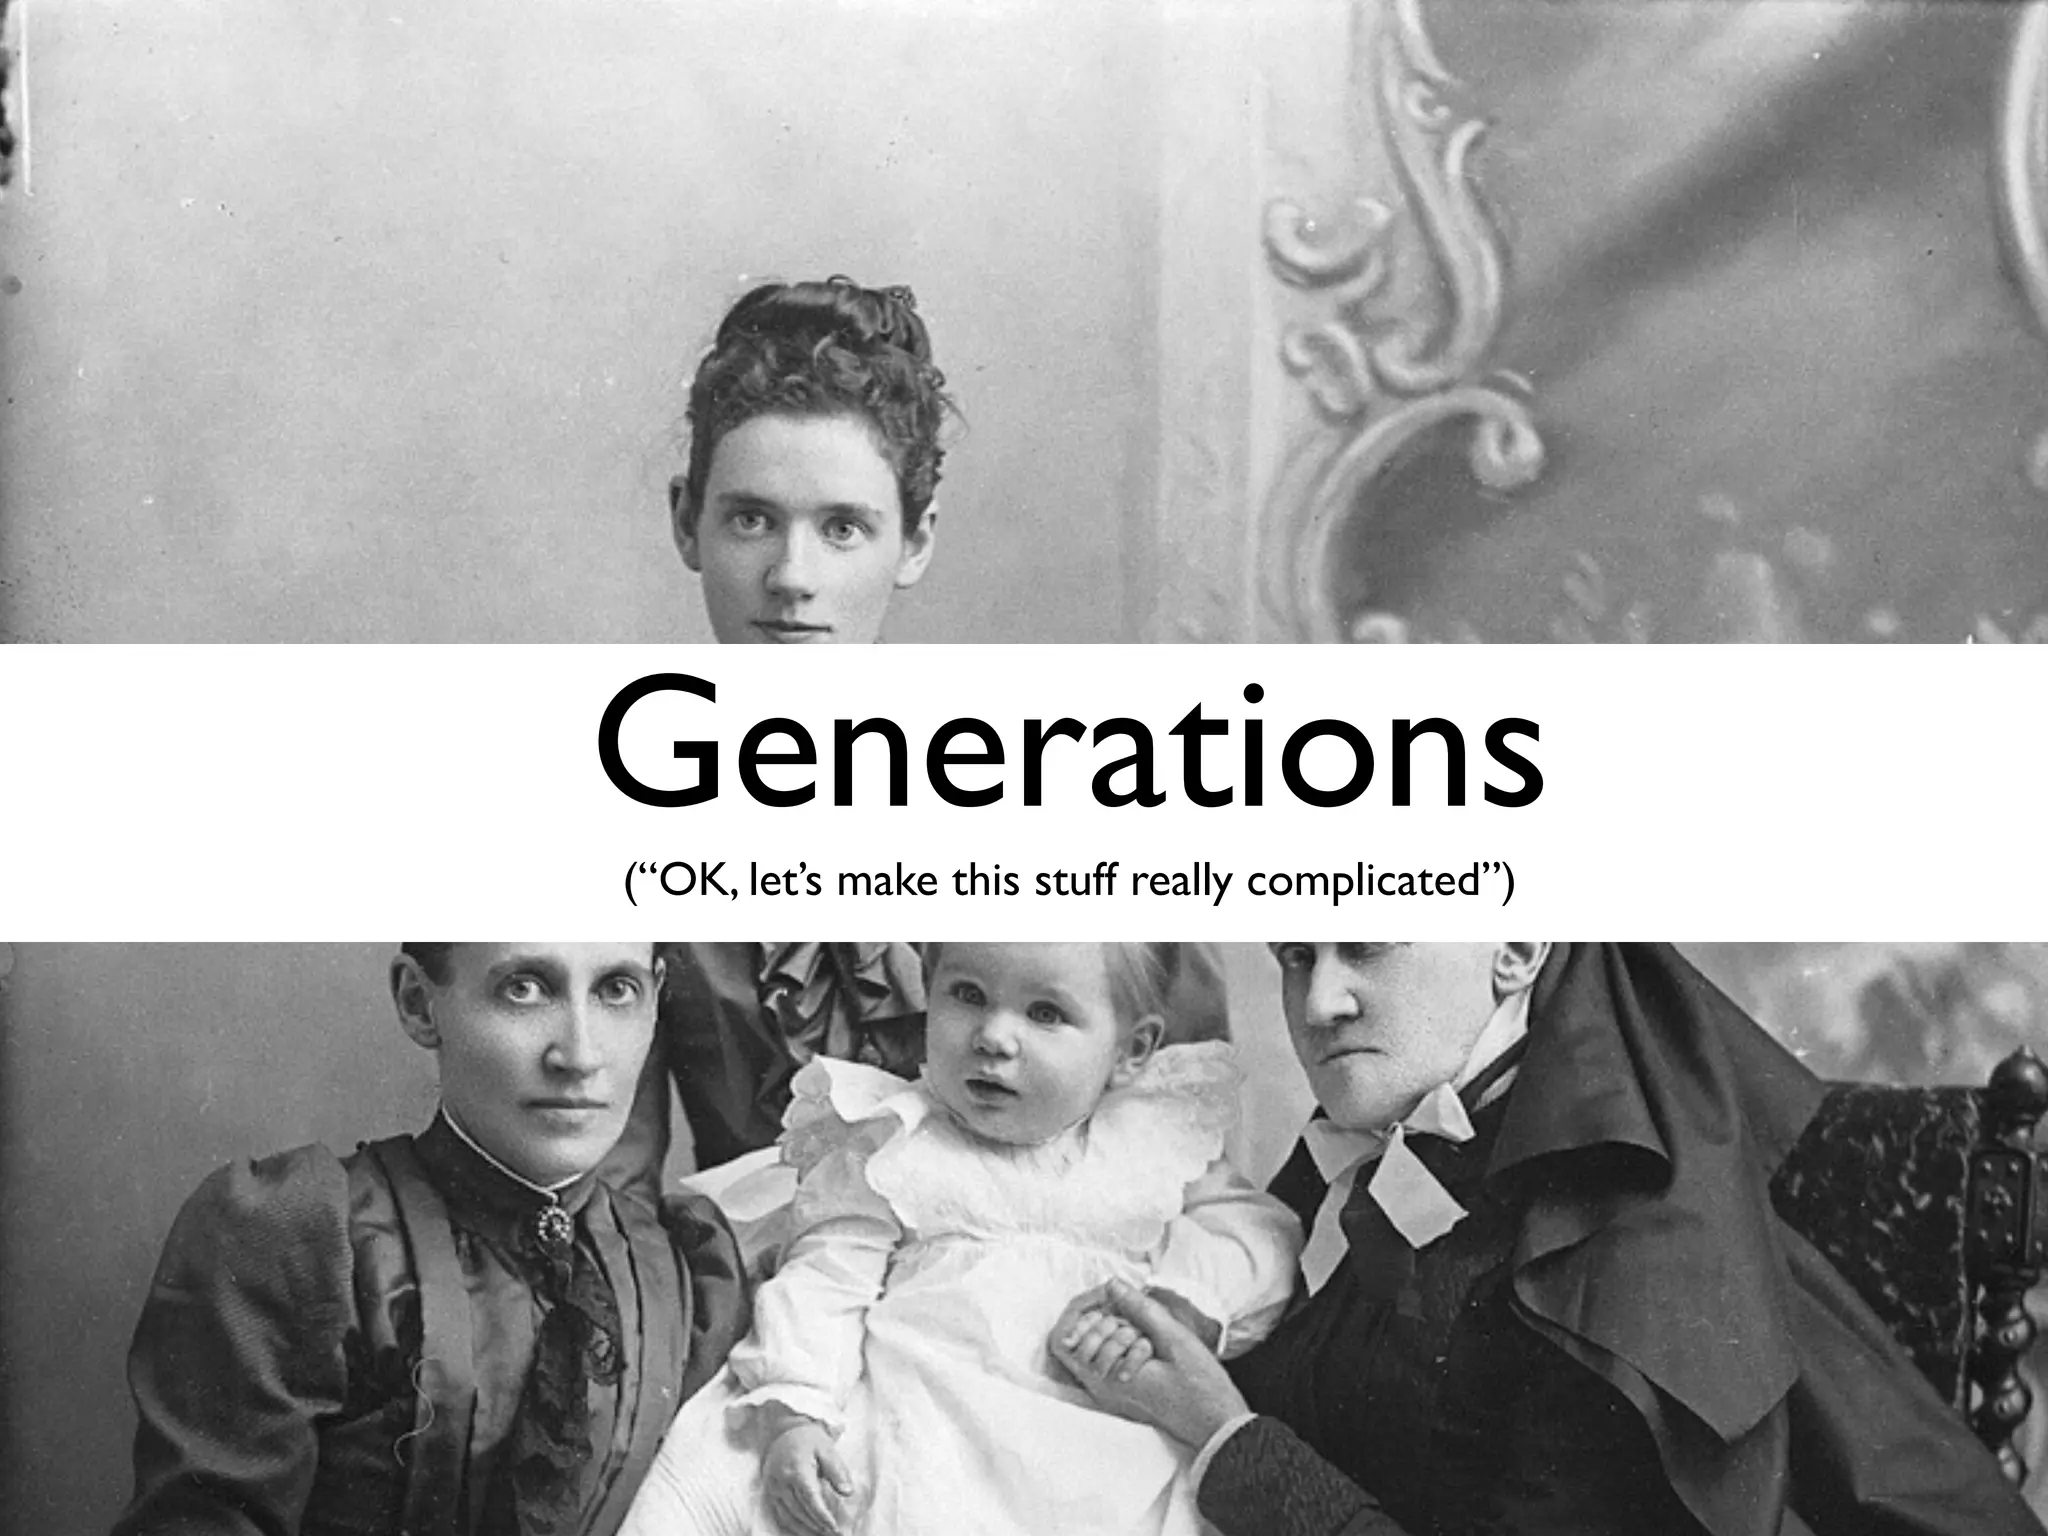
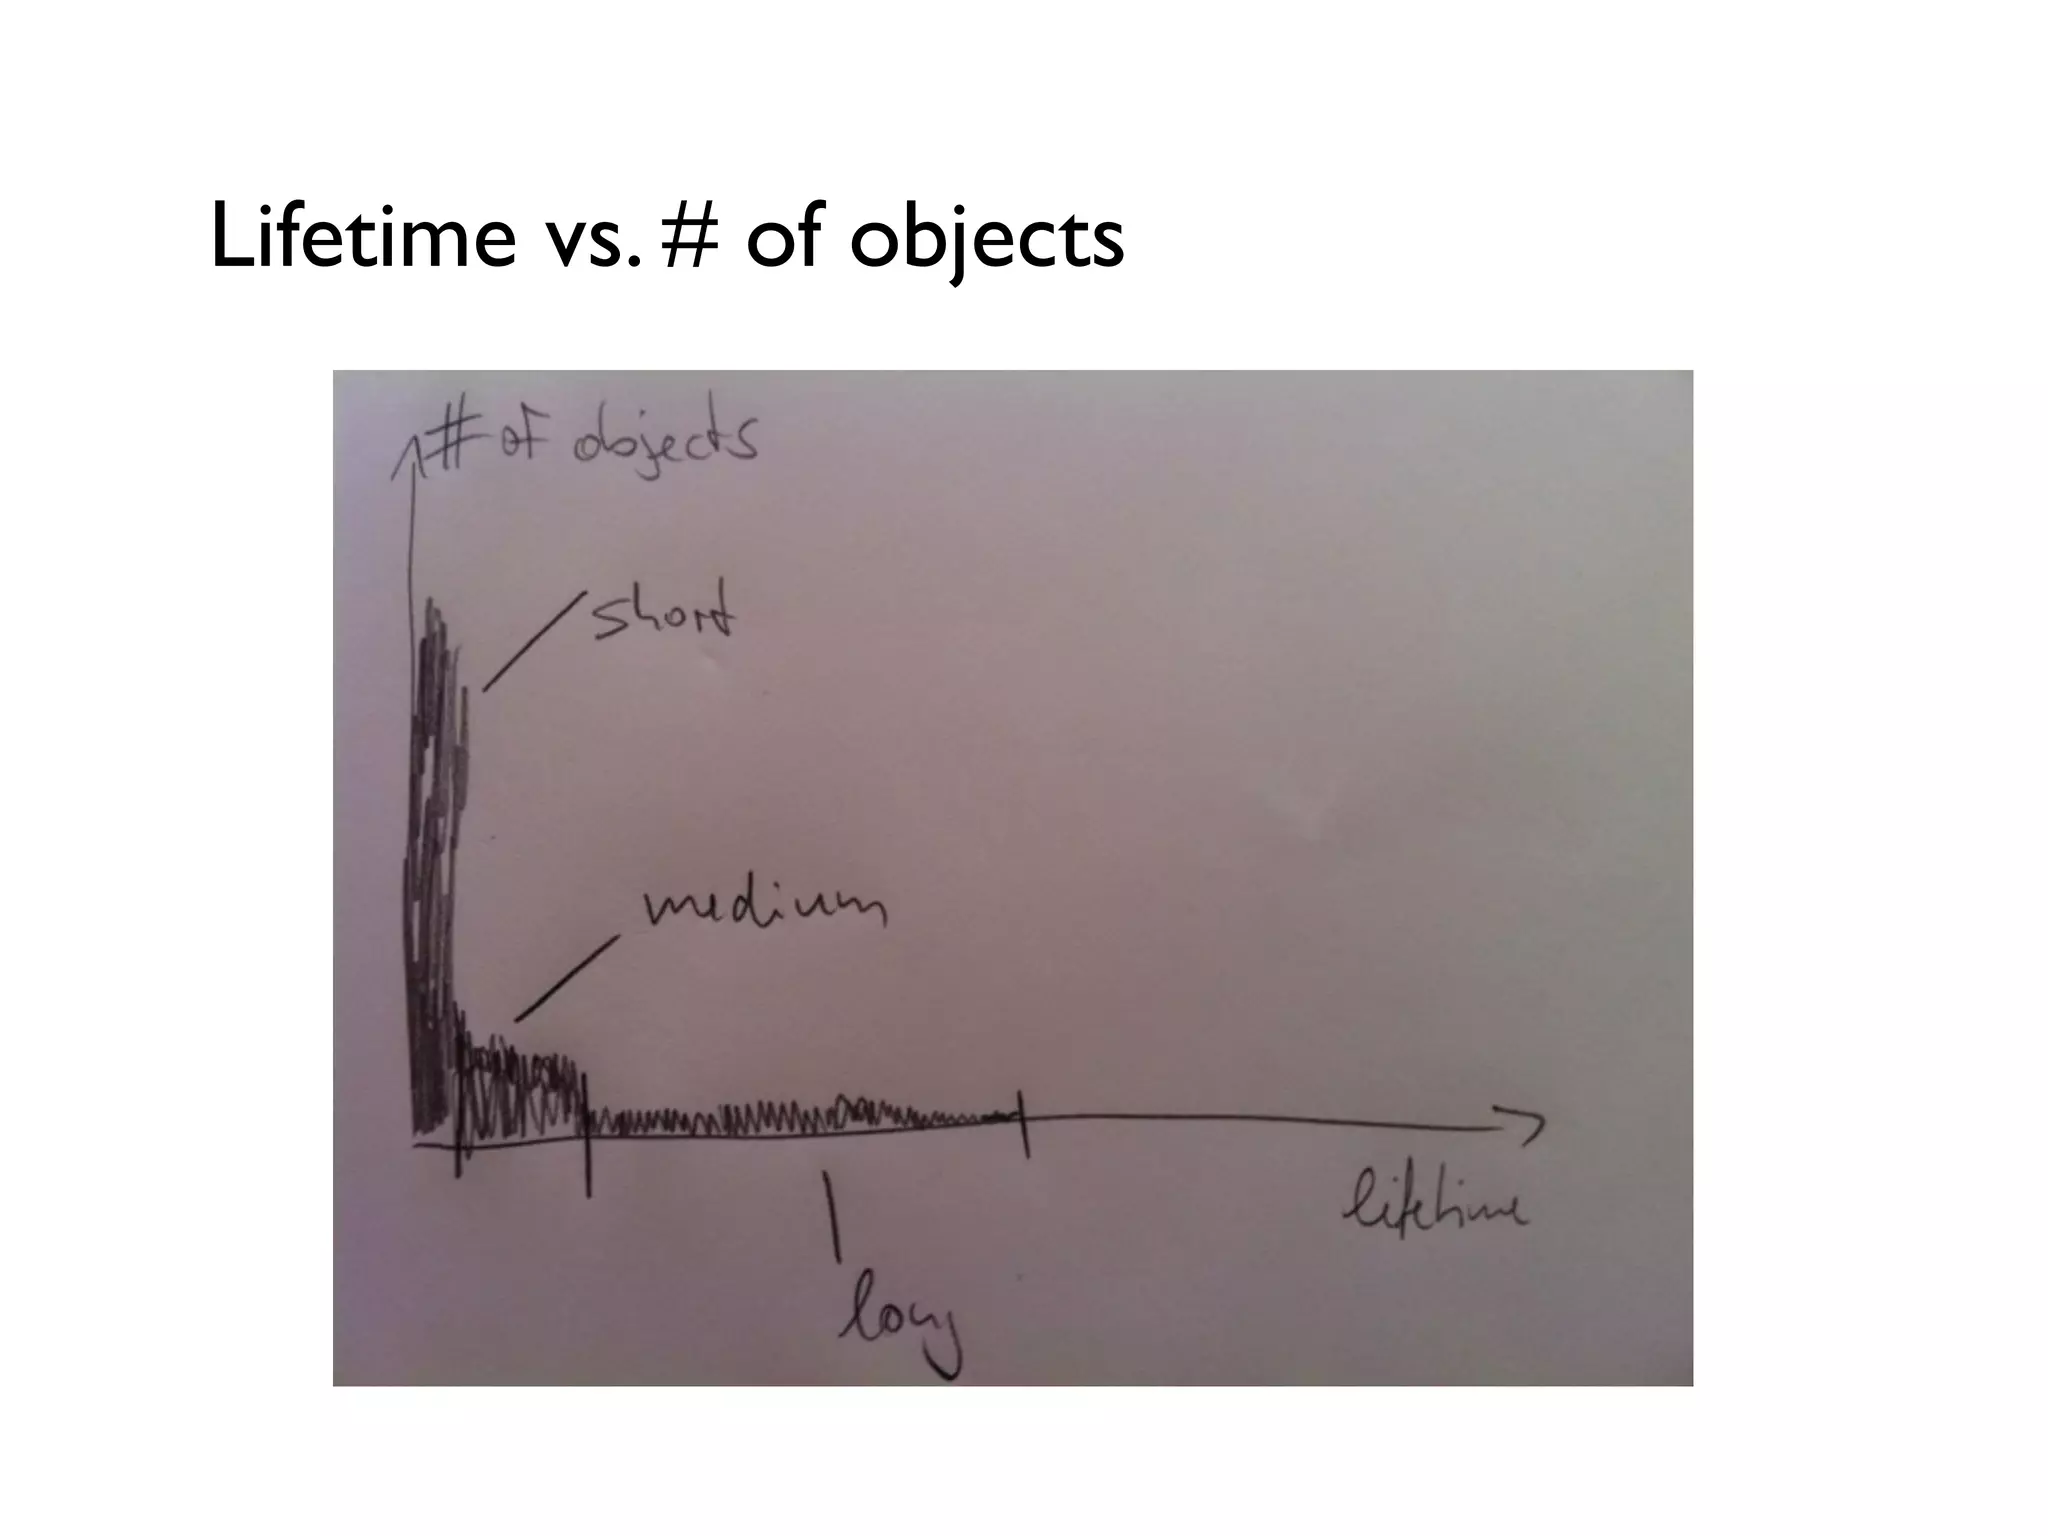
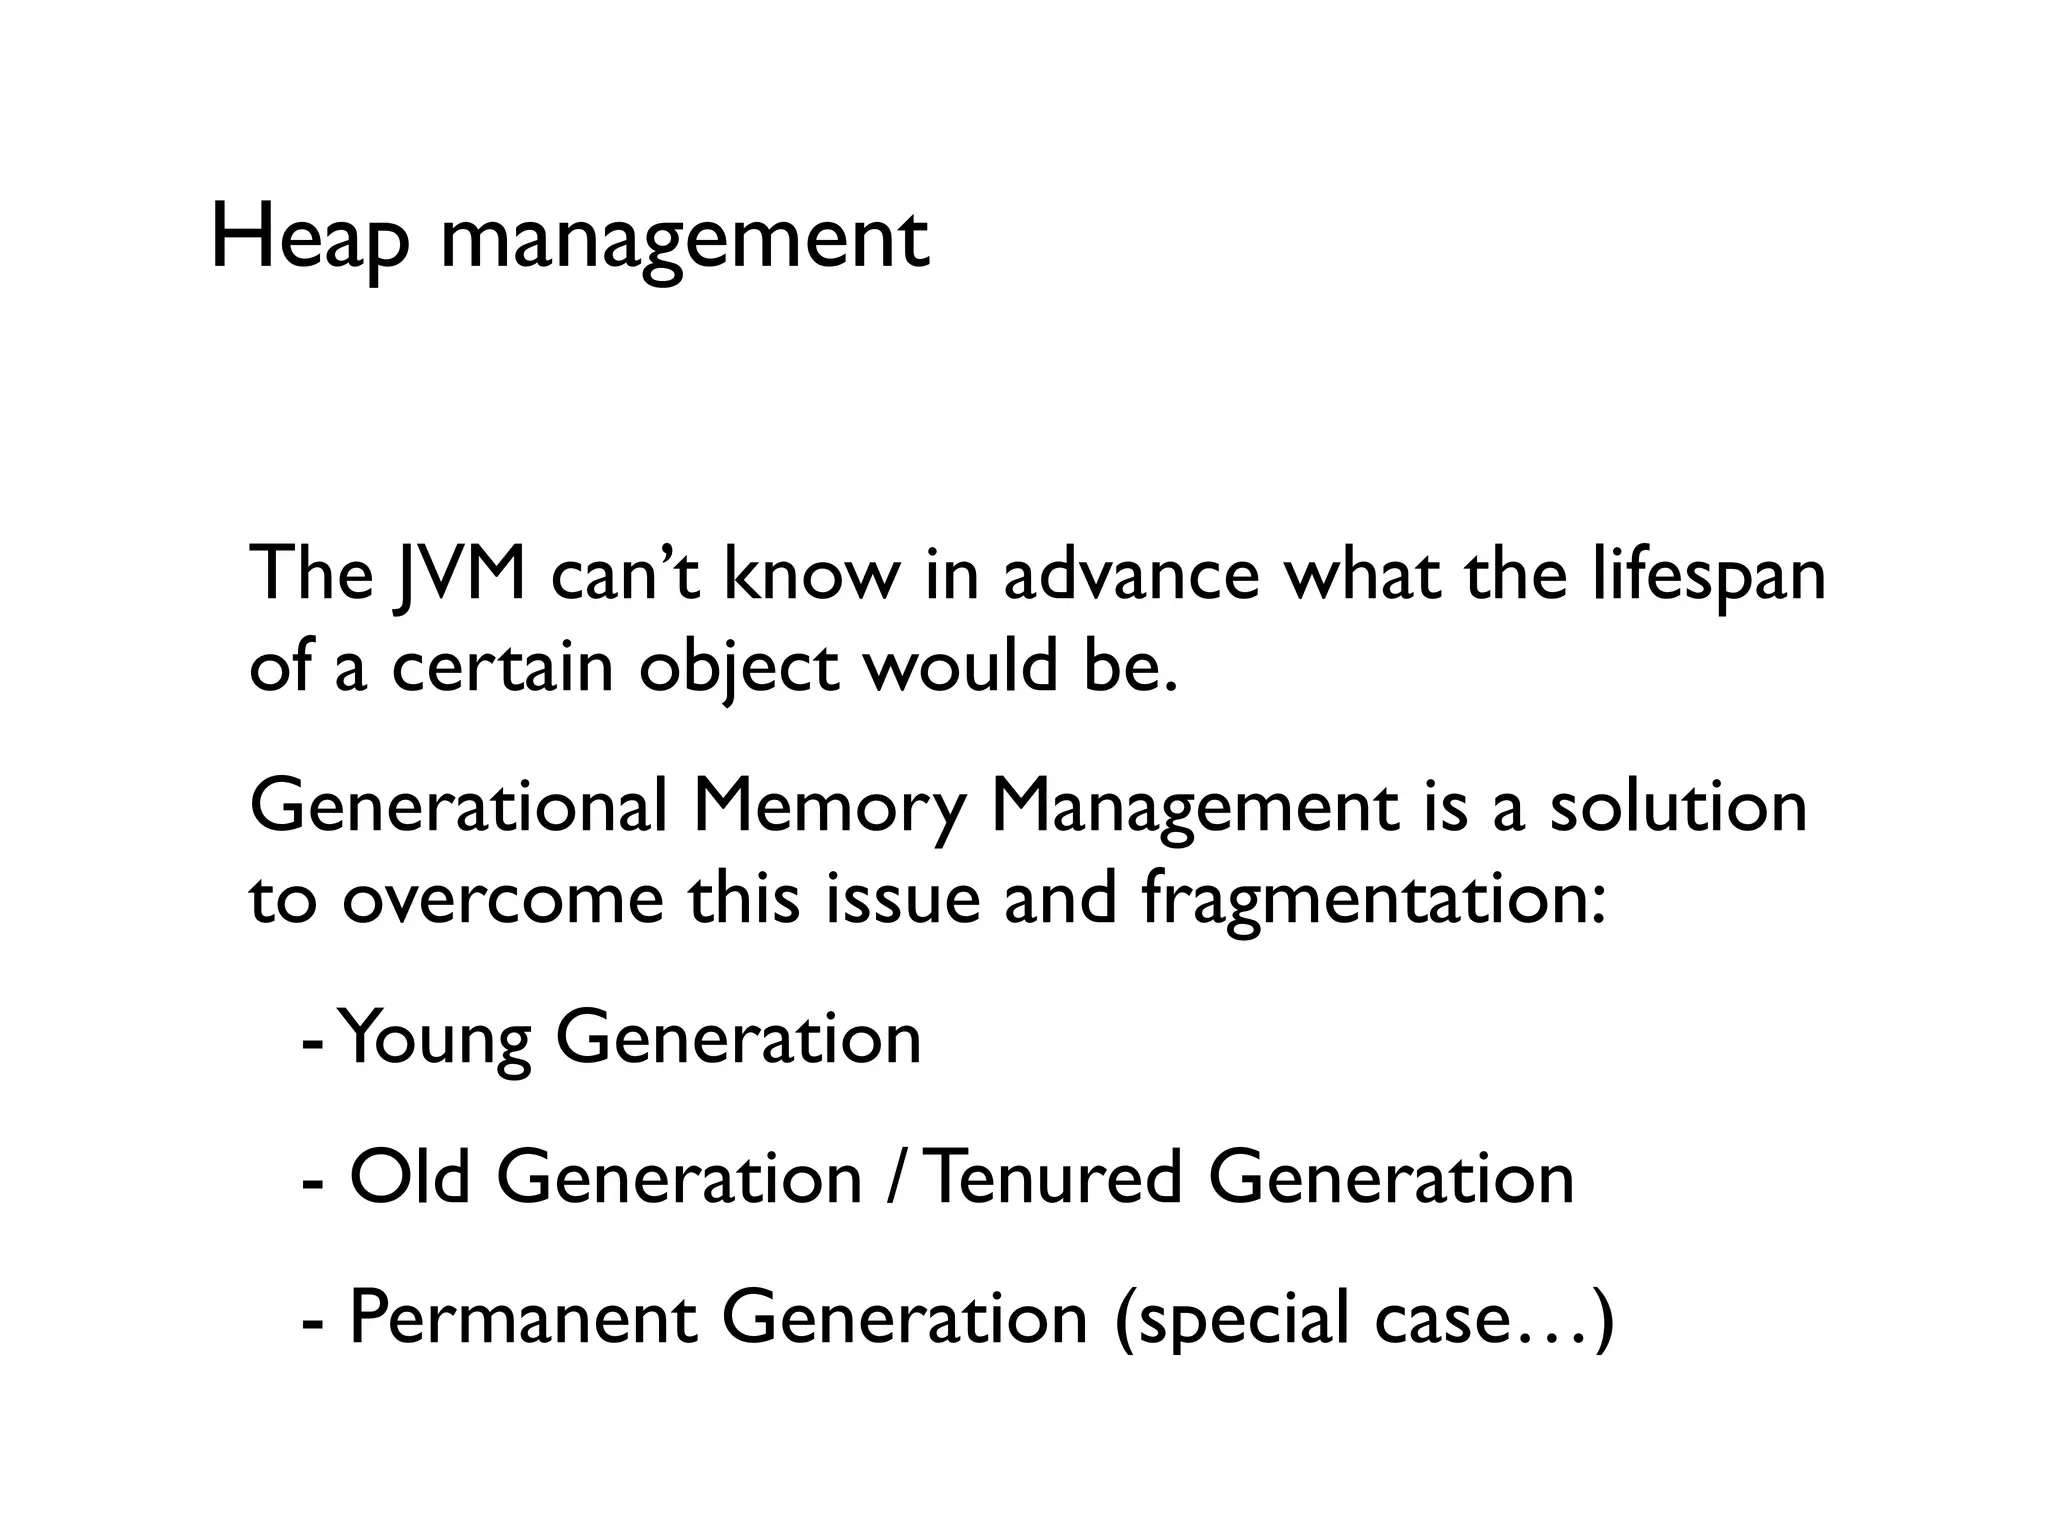
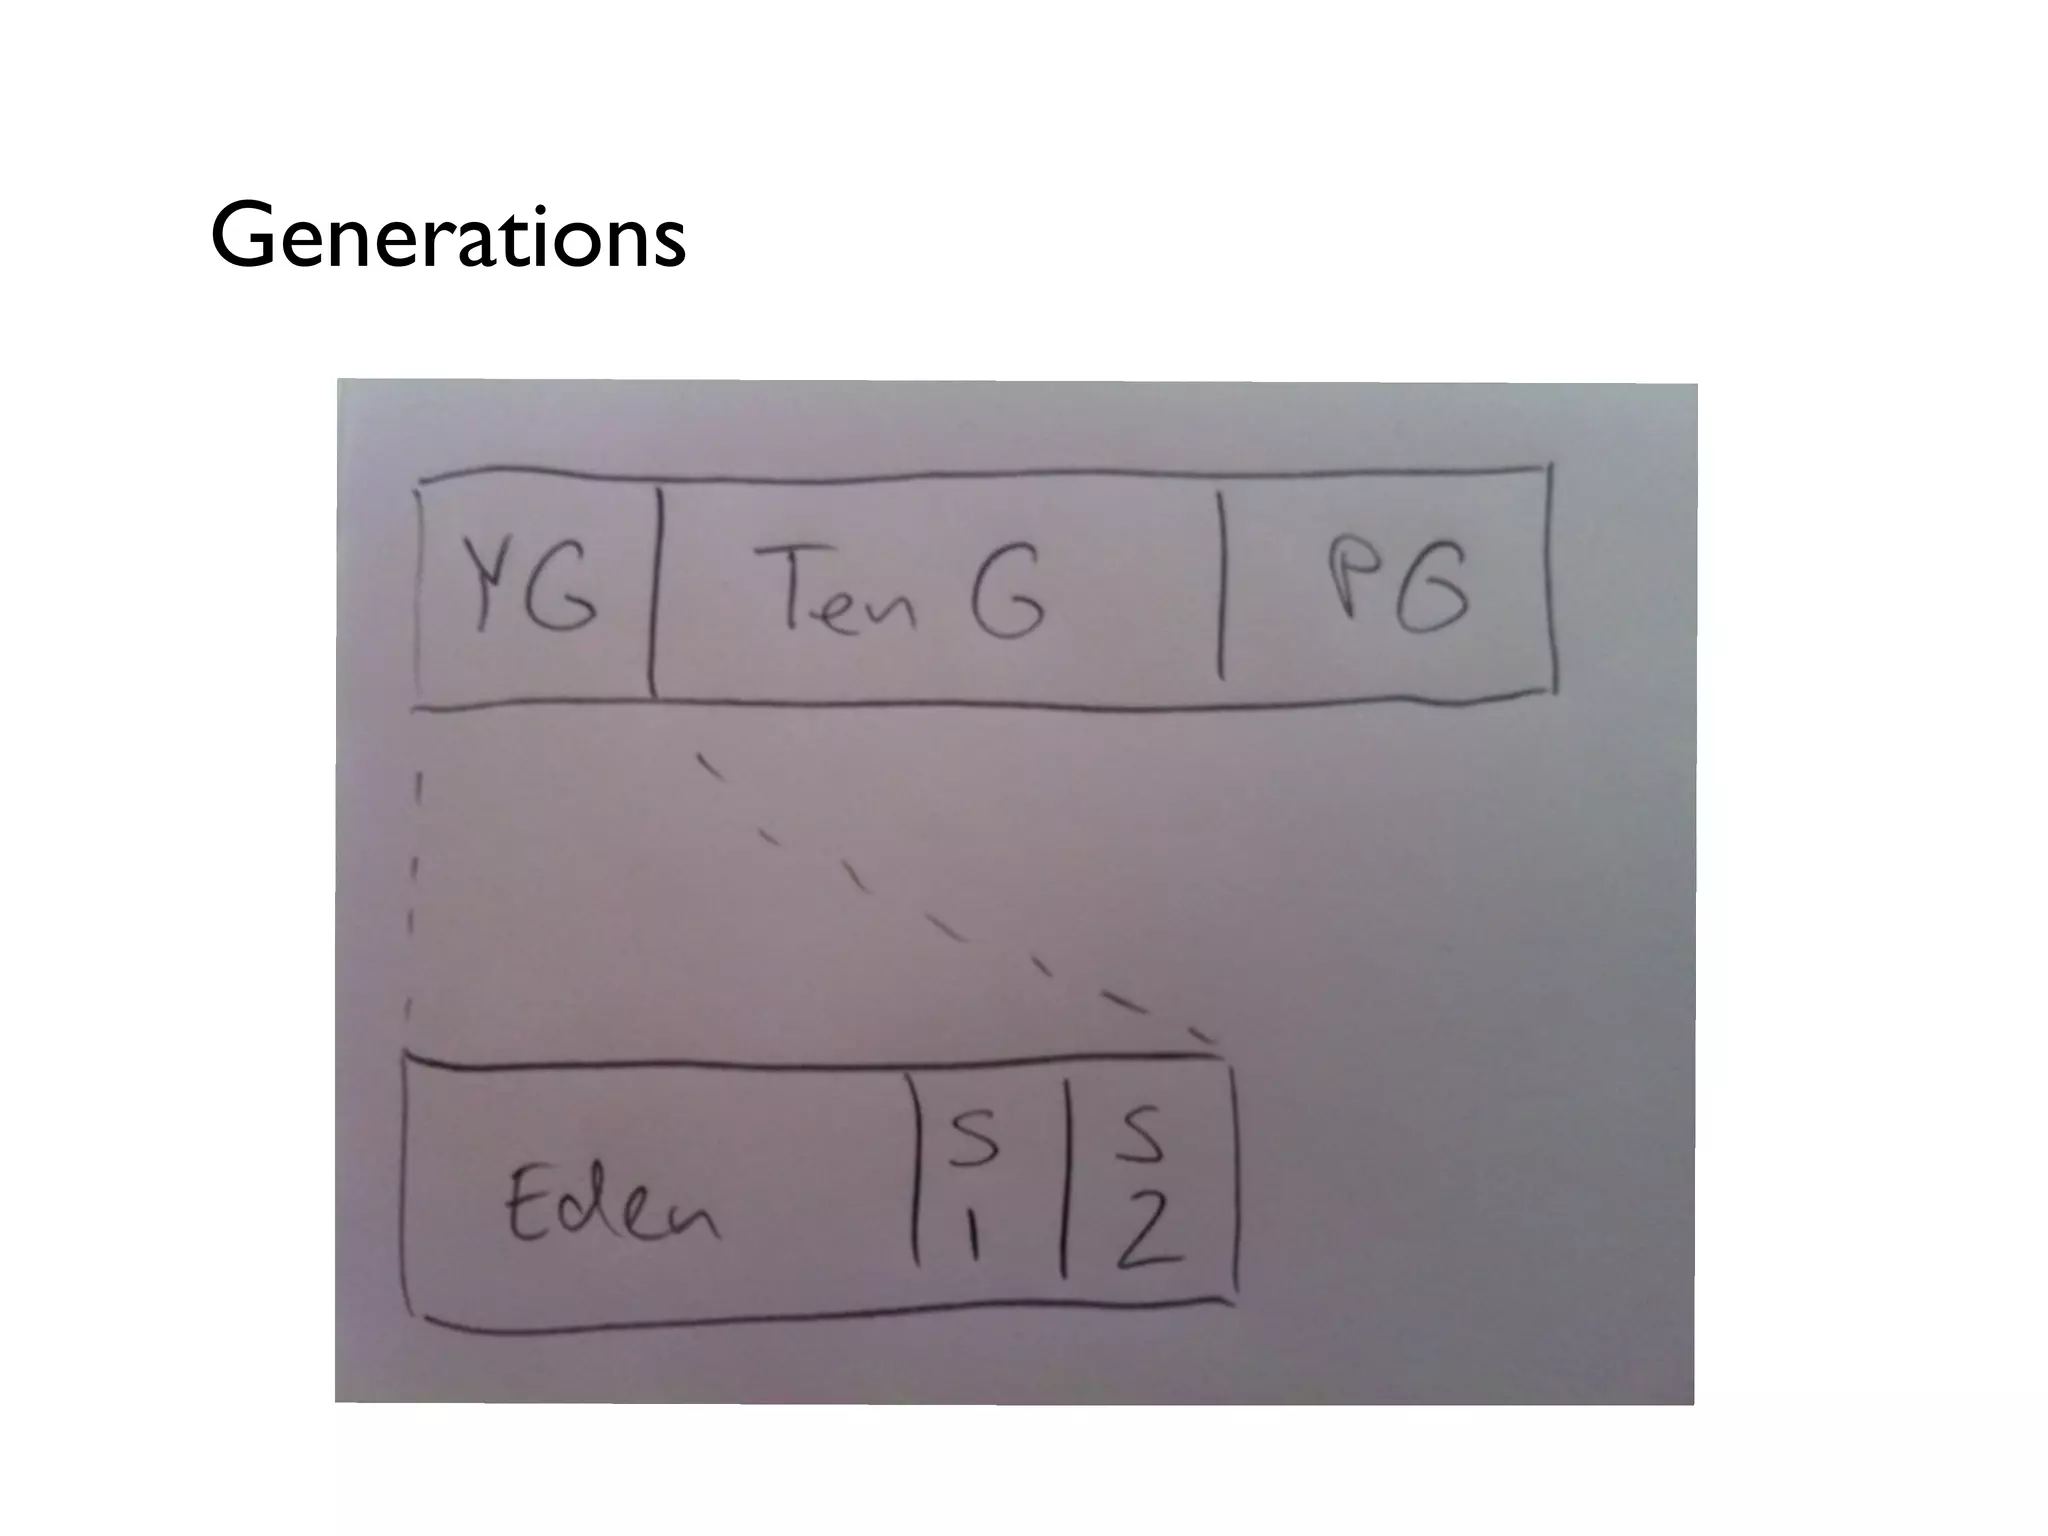
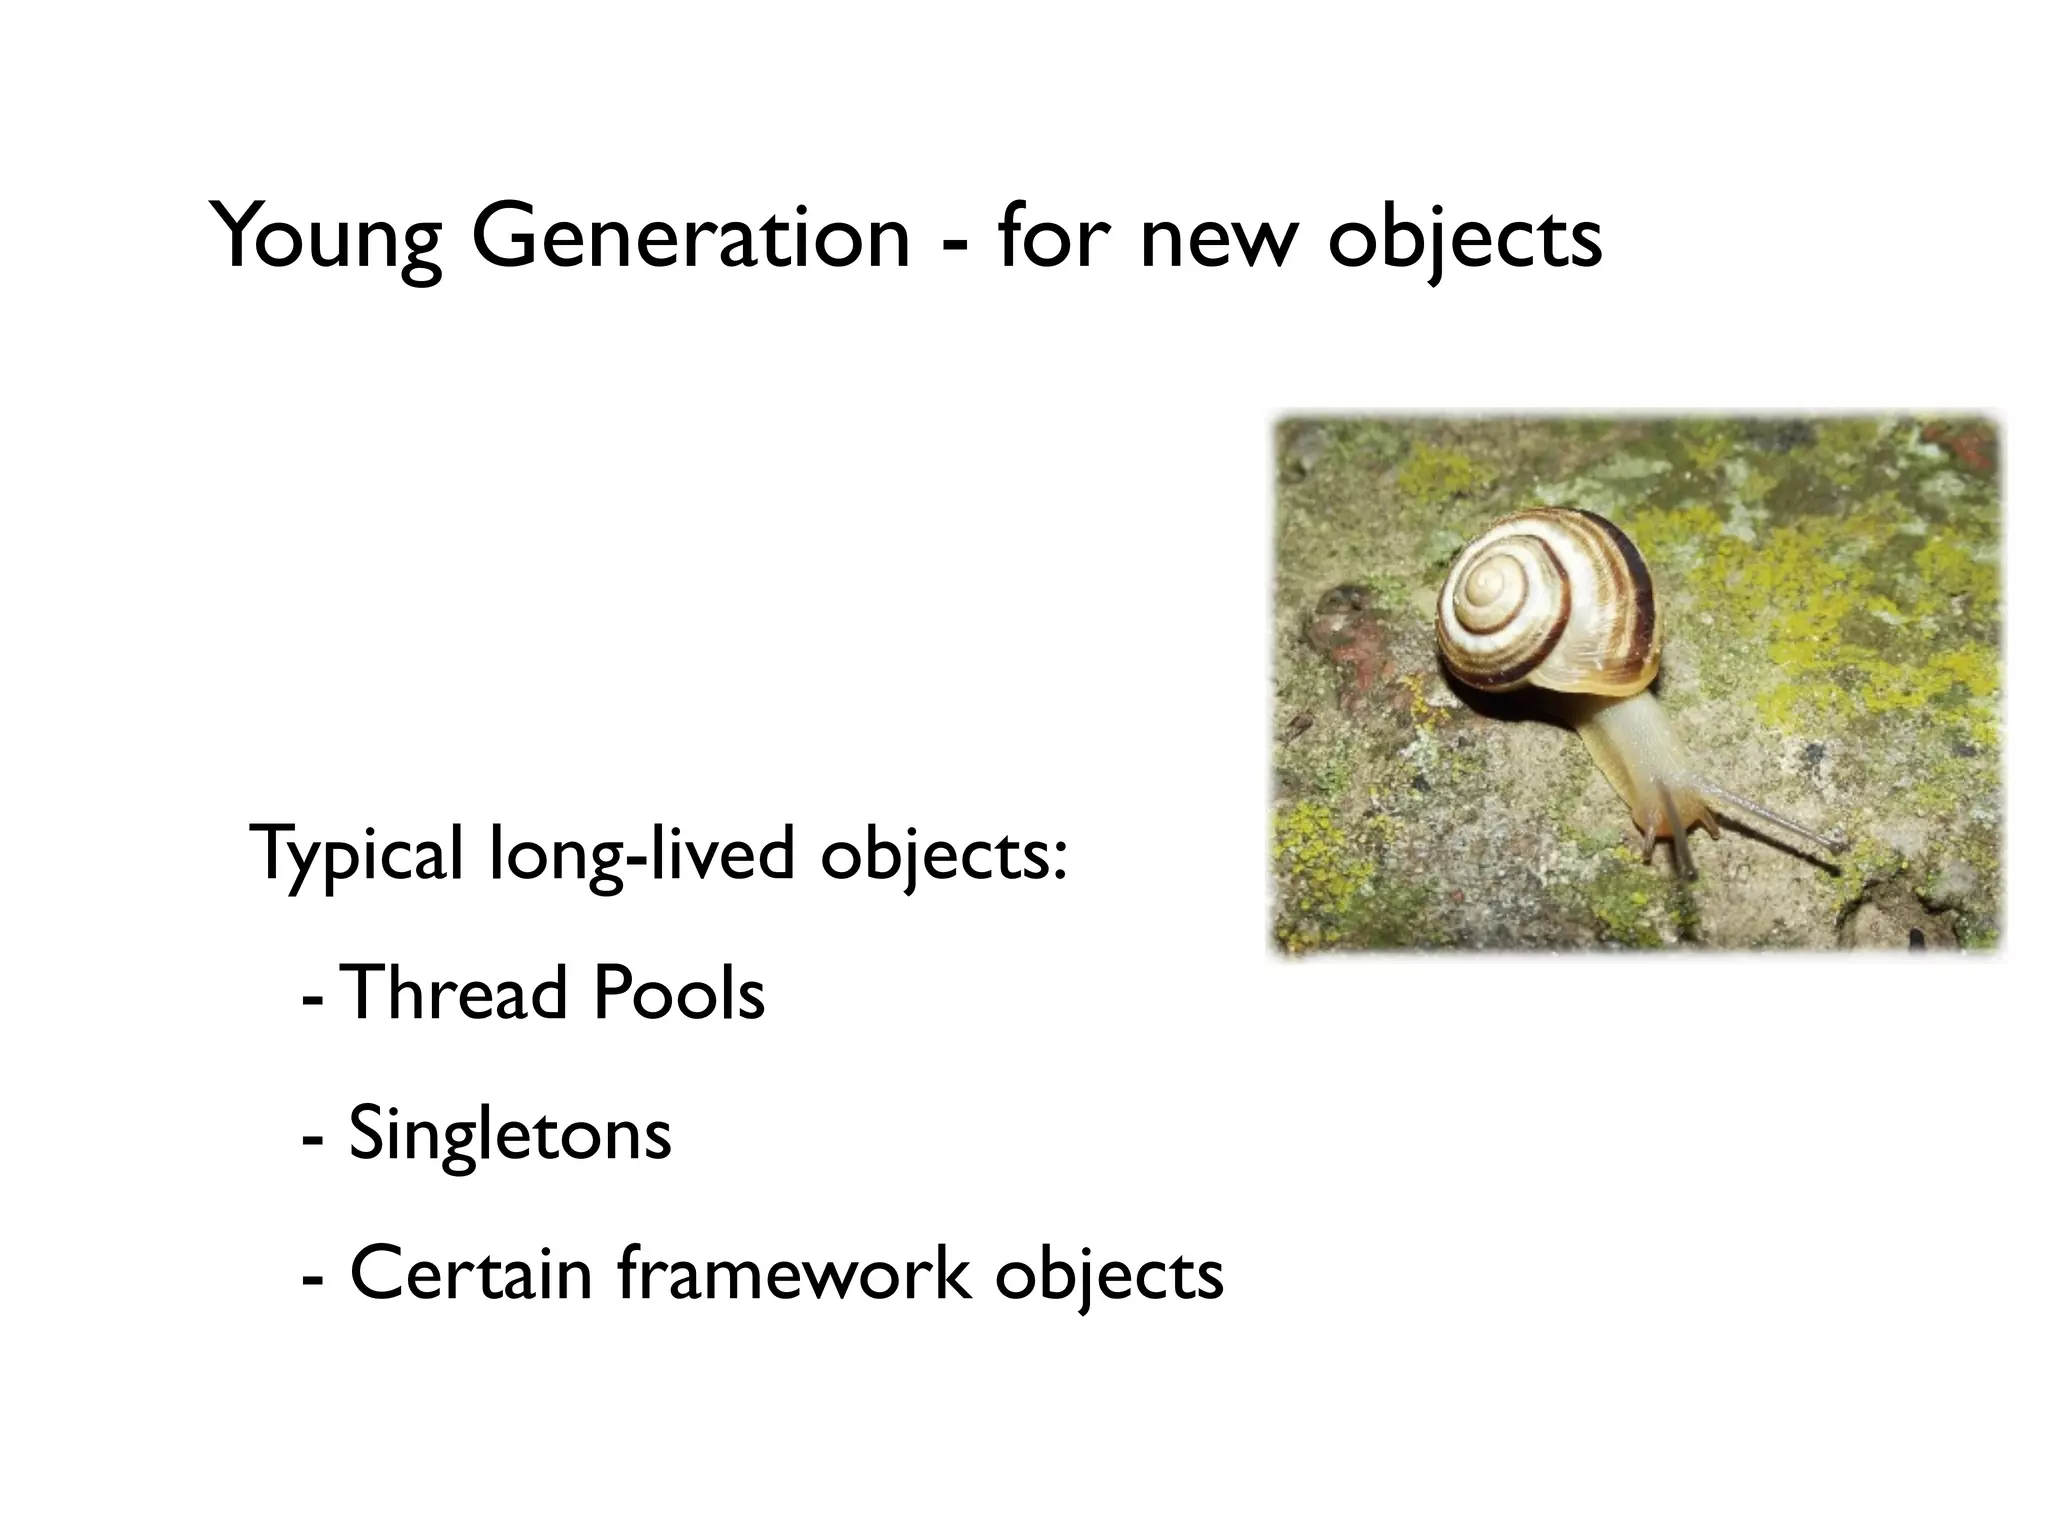
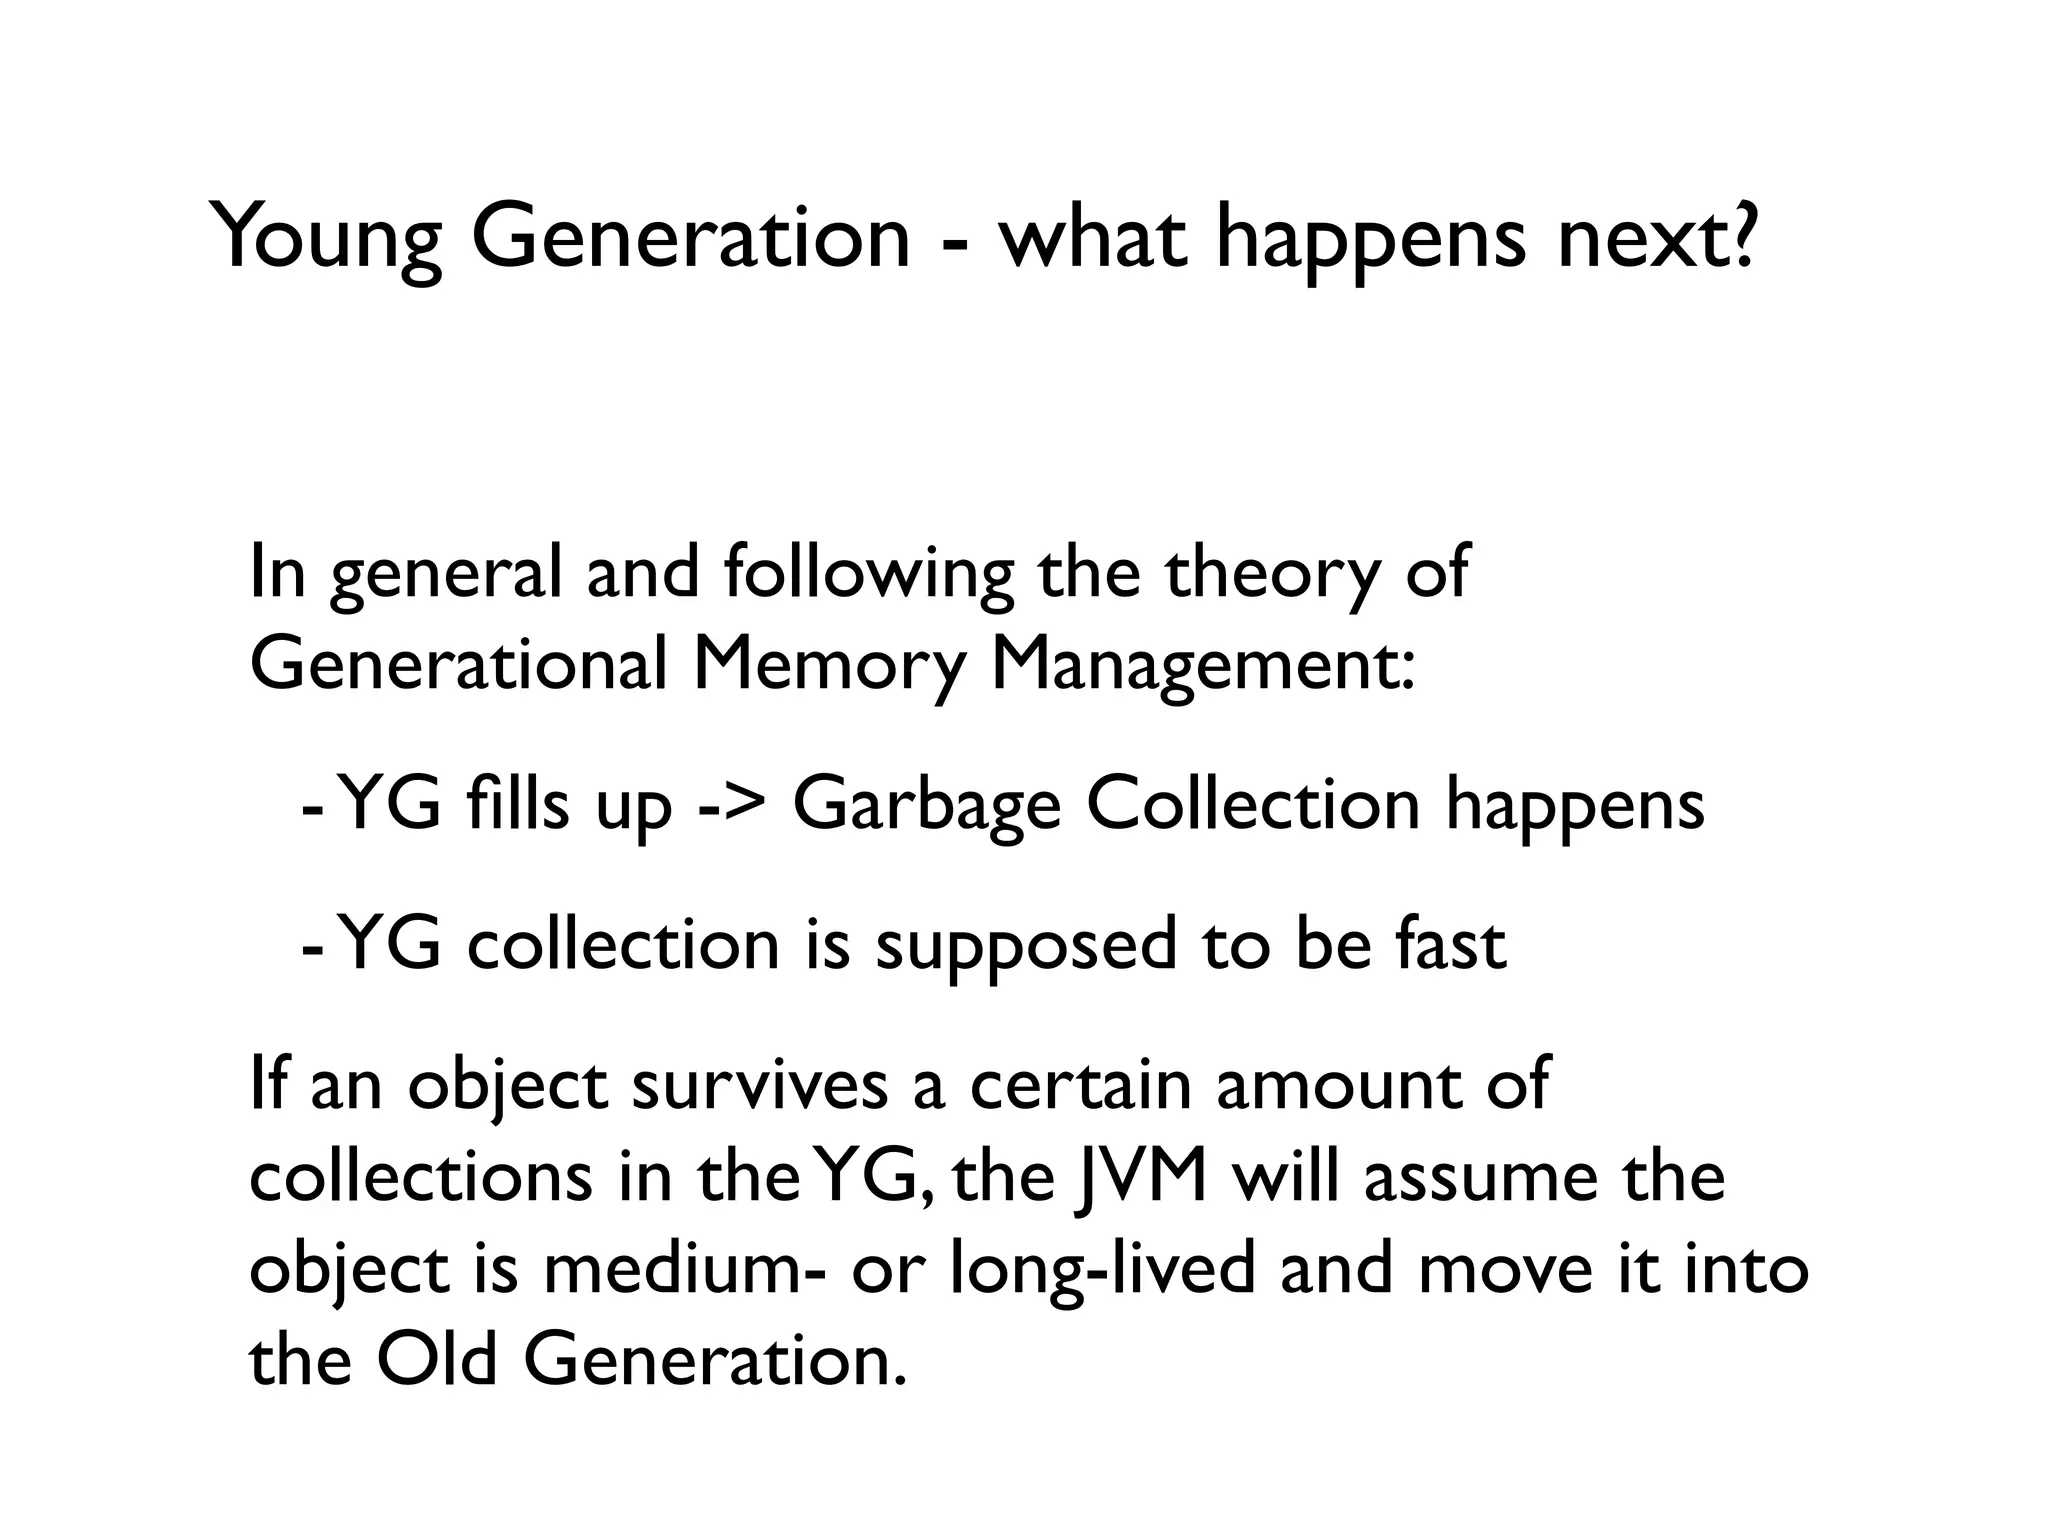
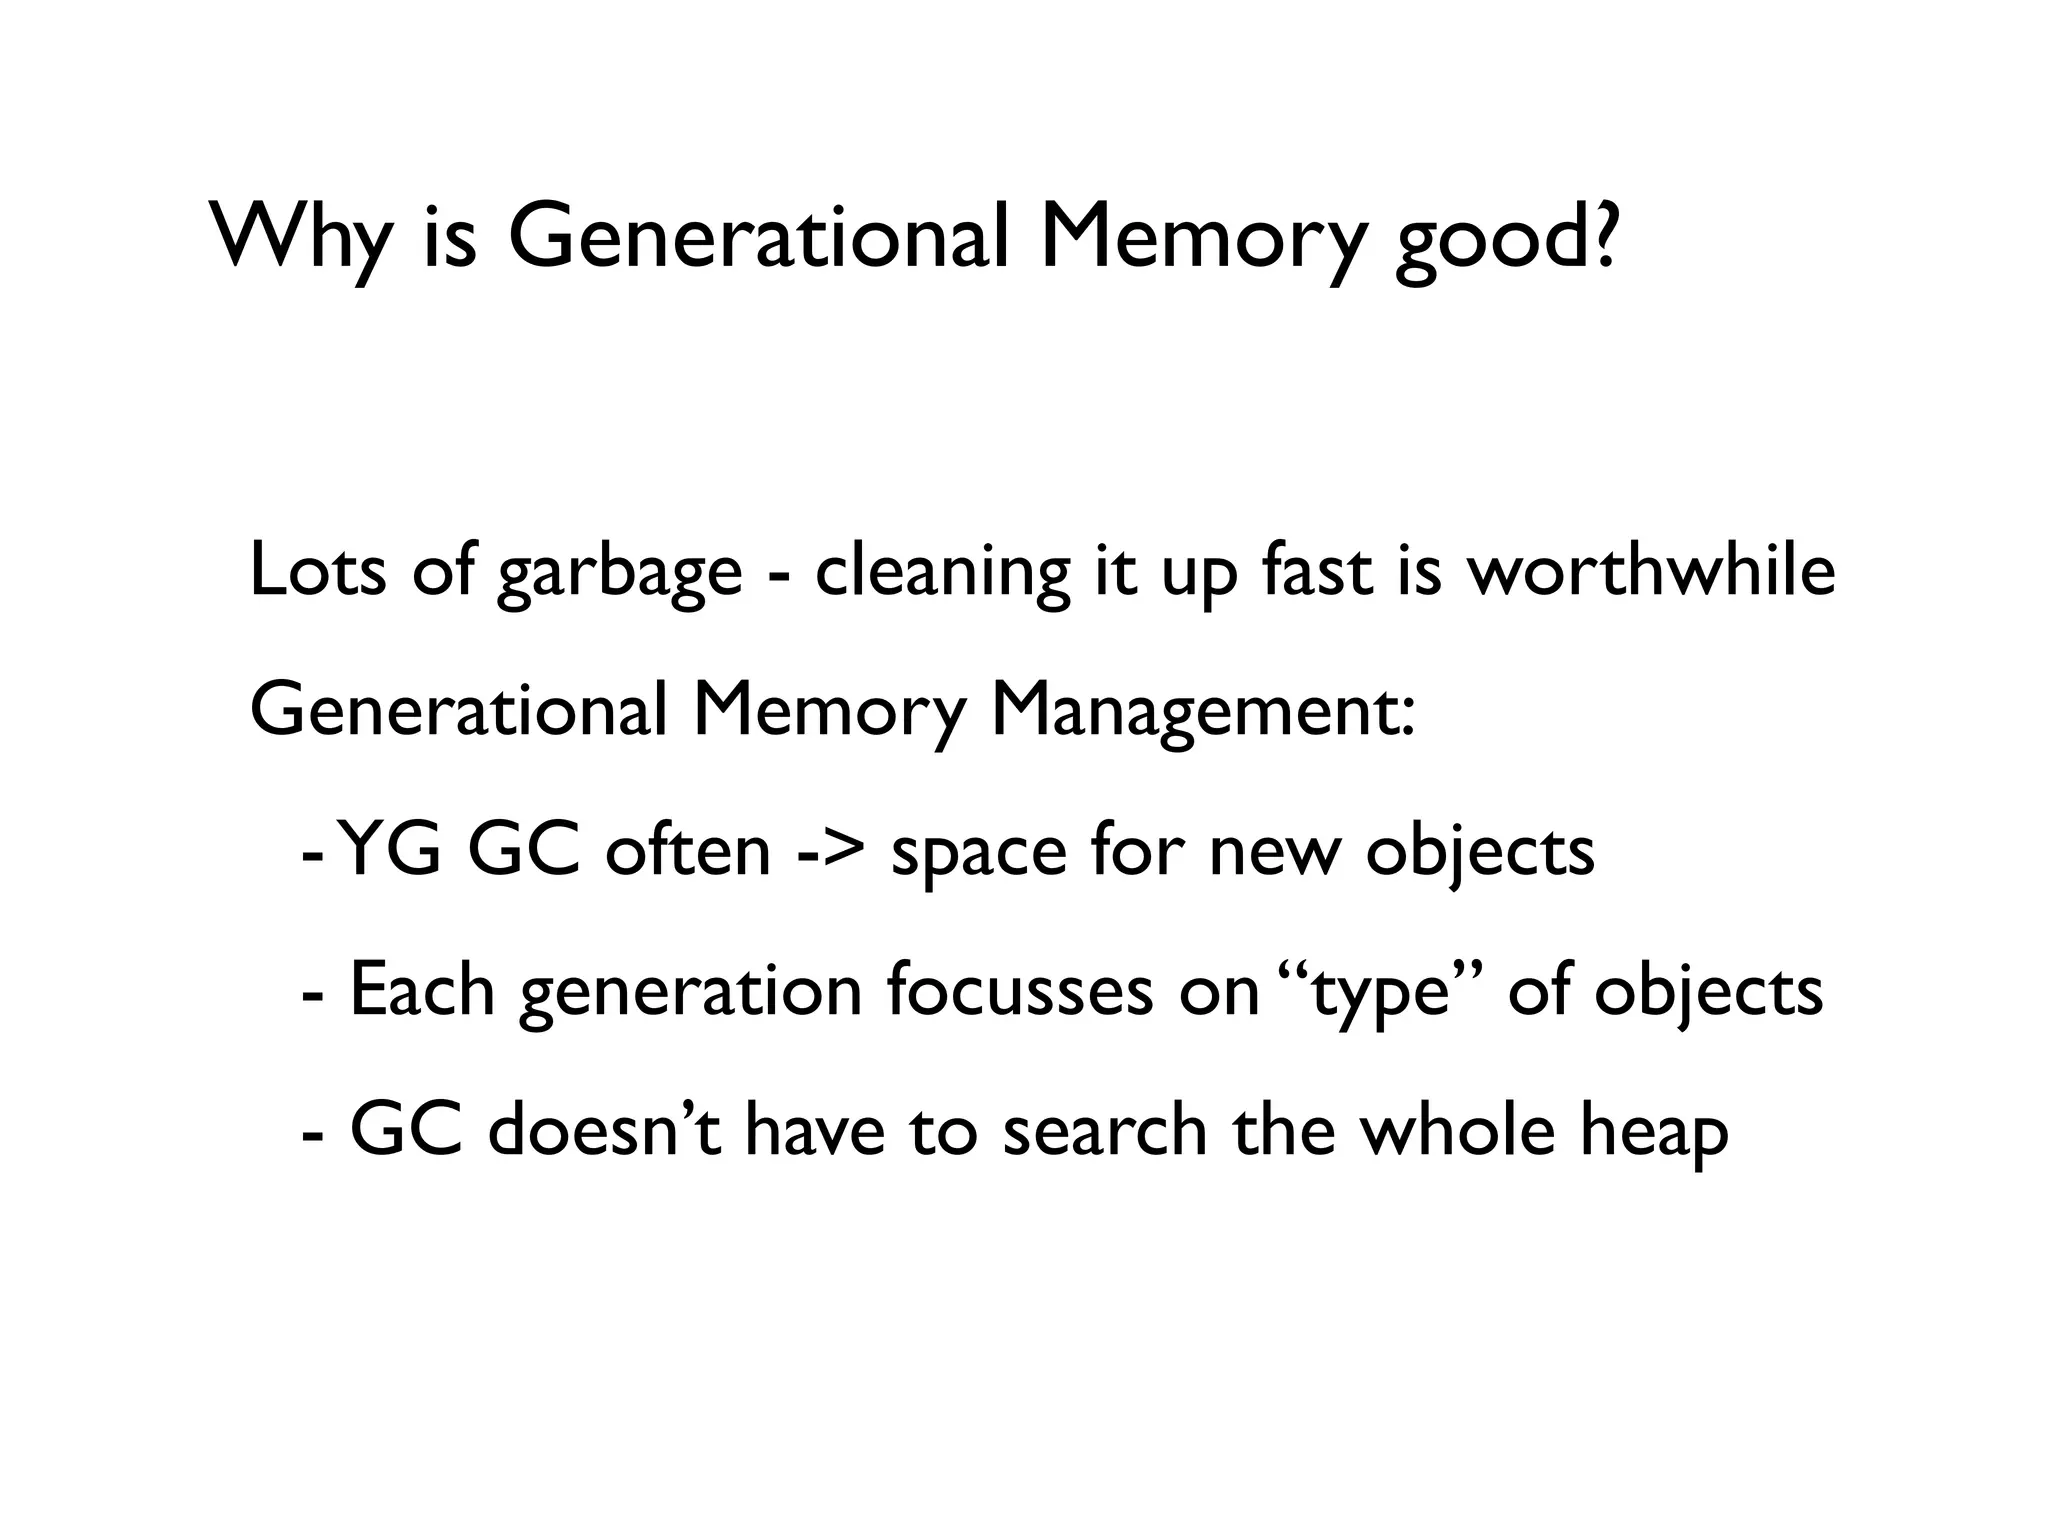
Introduction to generational memory management, why it matters, and the categorization of objects within the JVM.
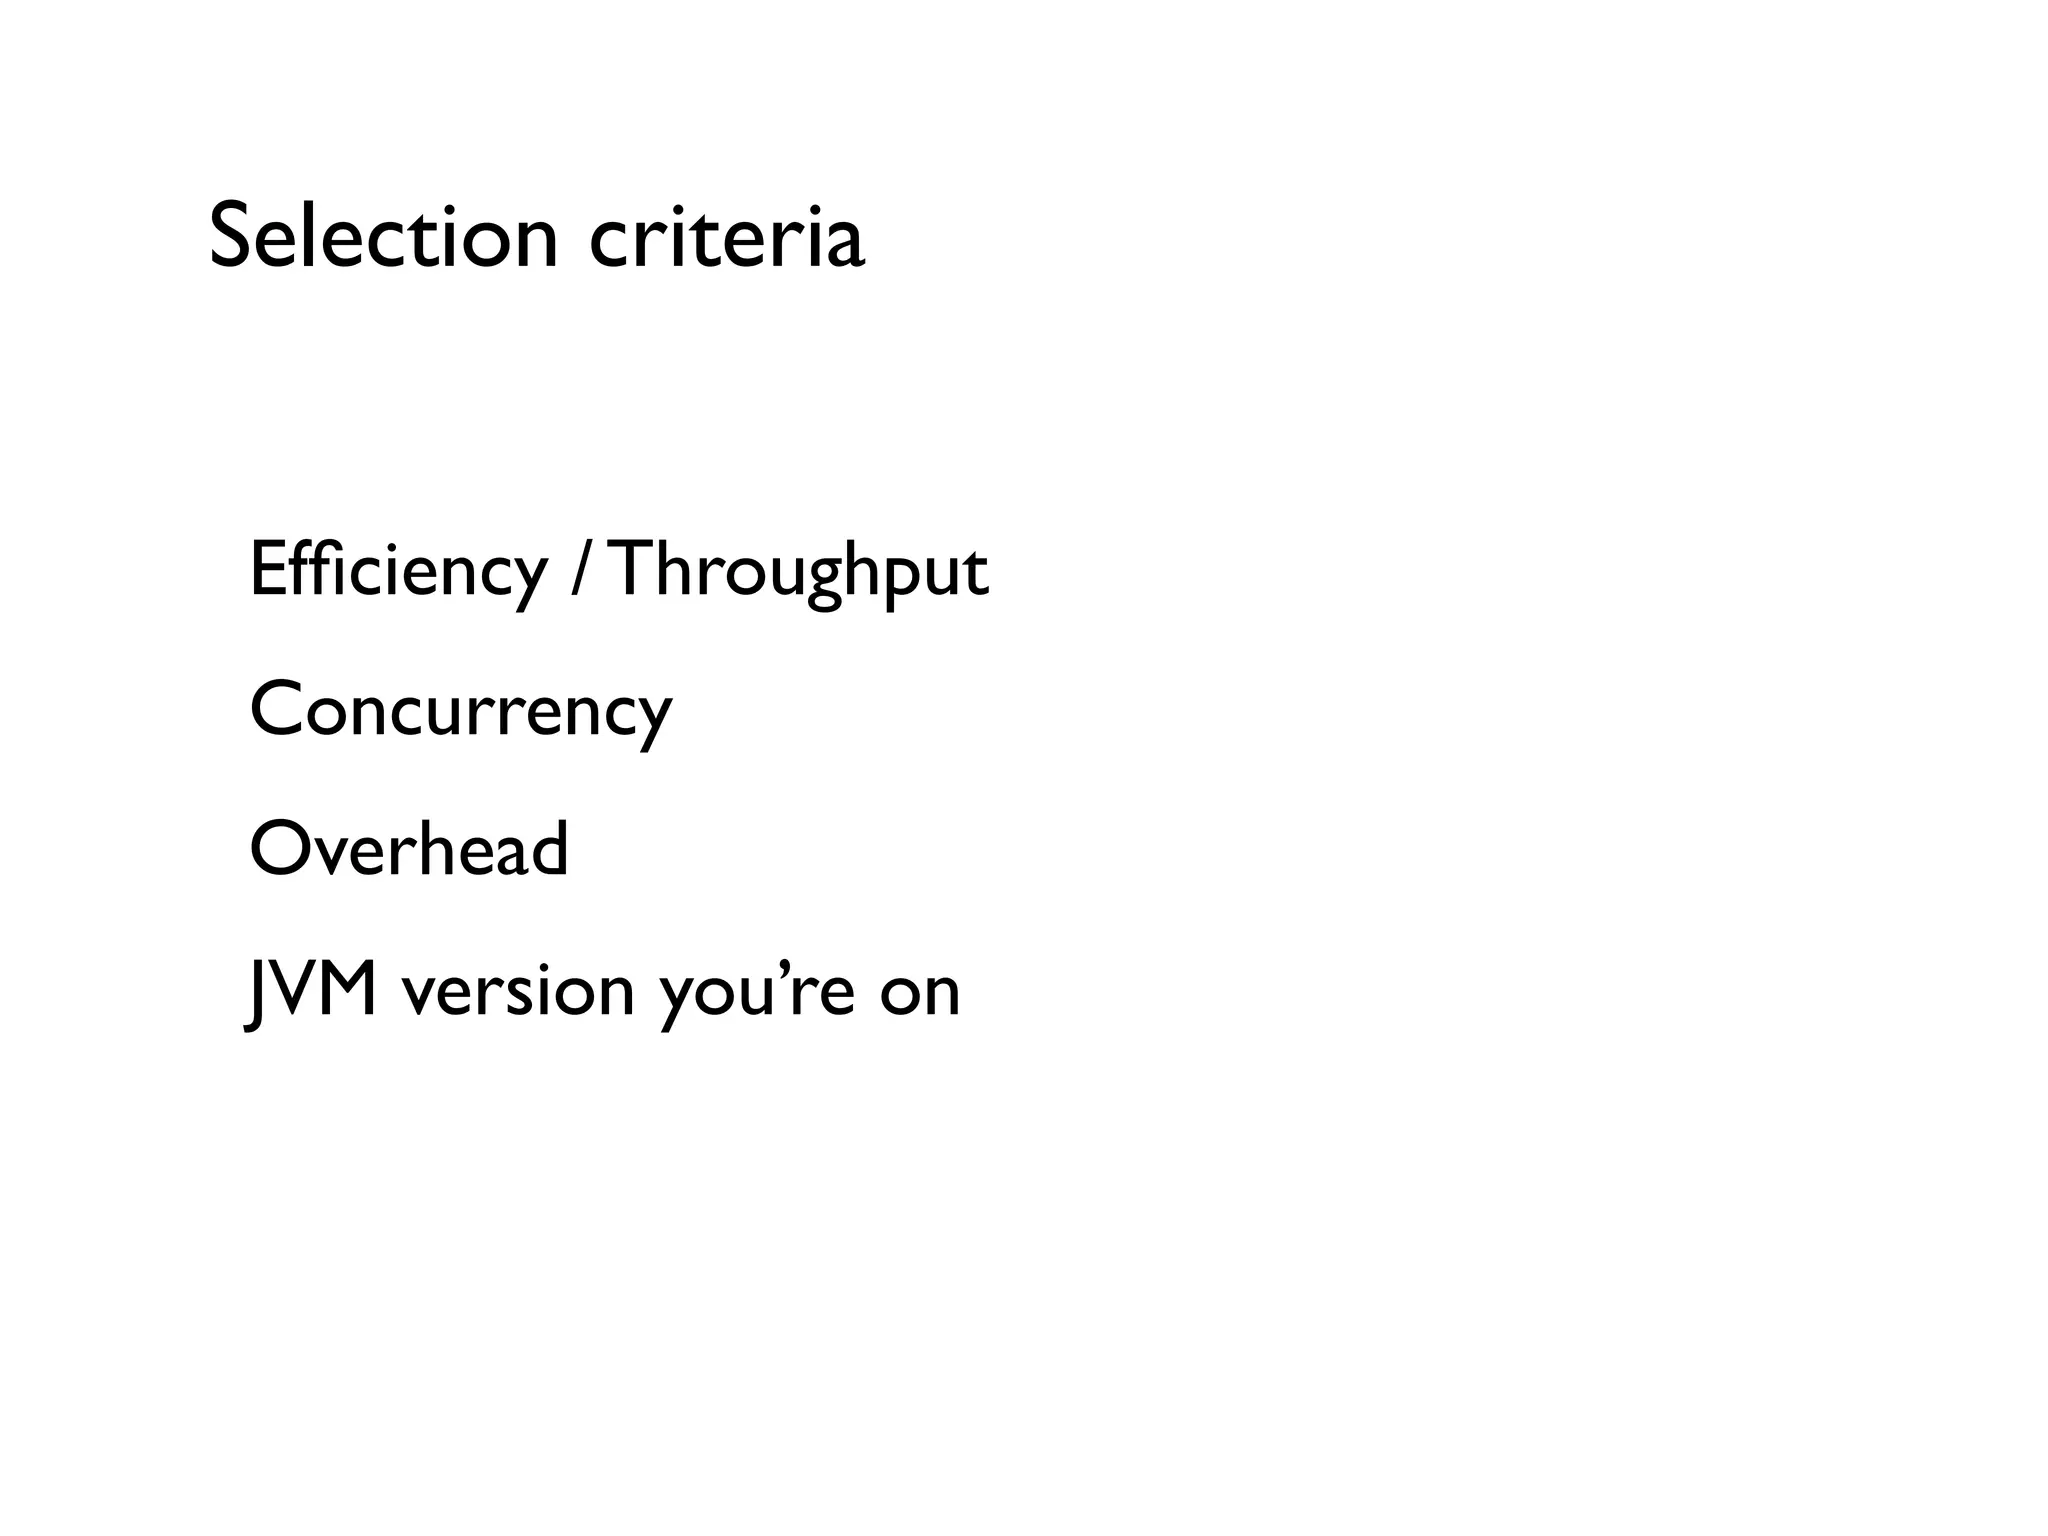
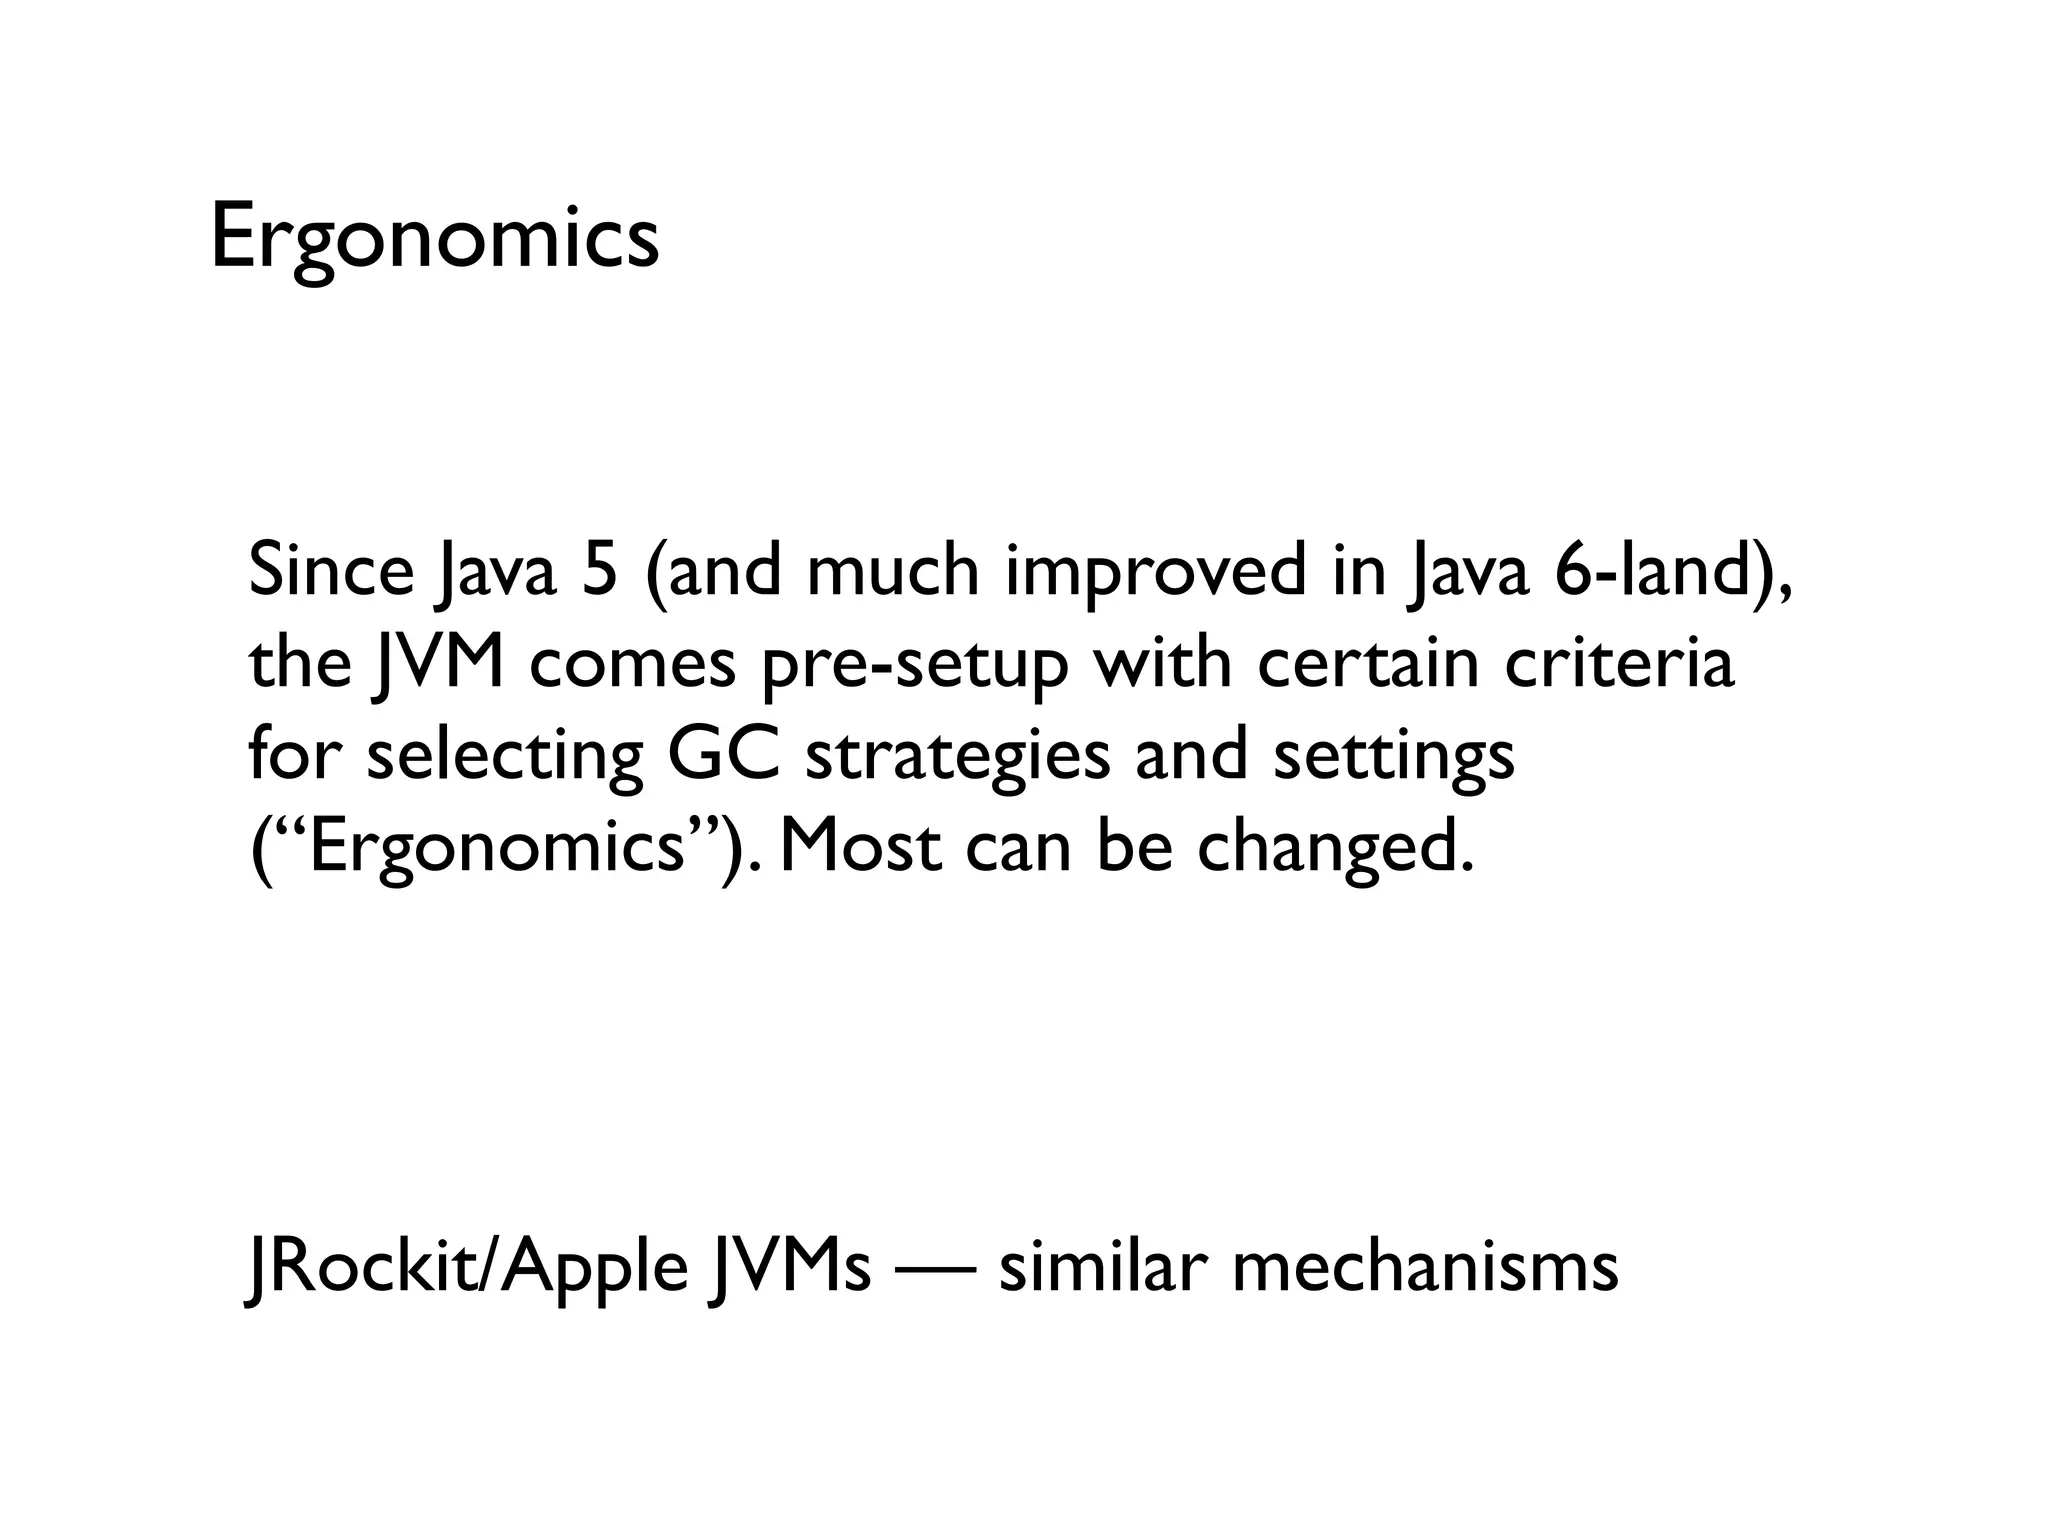
Overview of various GC strategies for different situations and how JVM ergonomics handle collections.
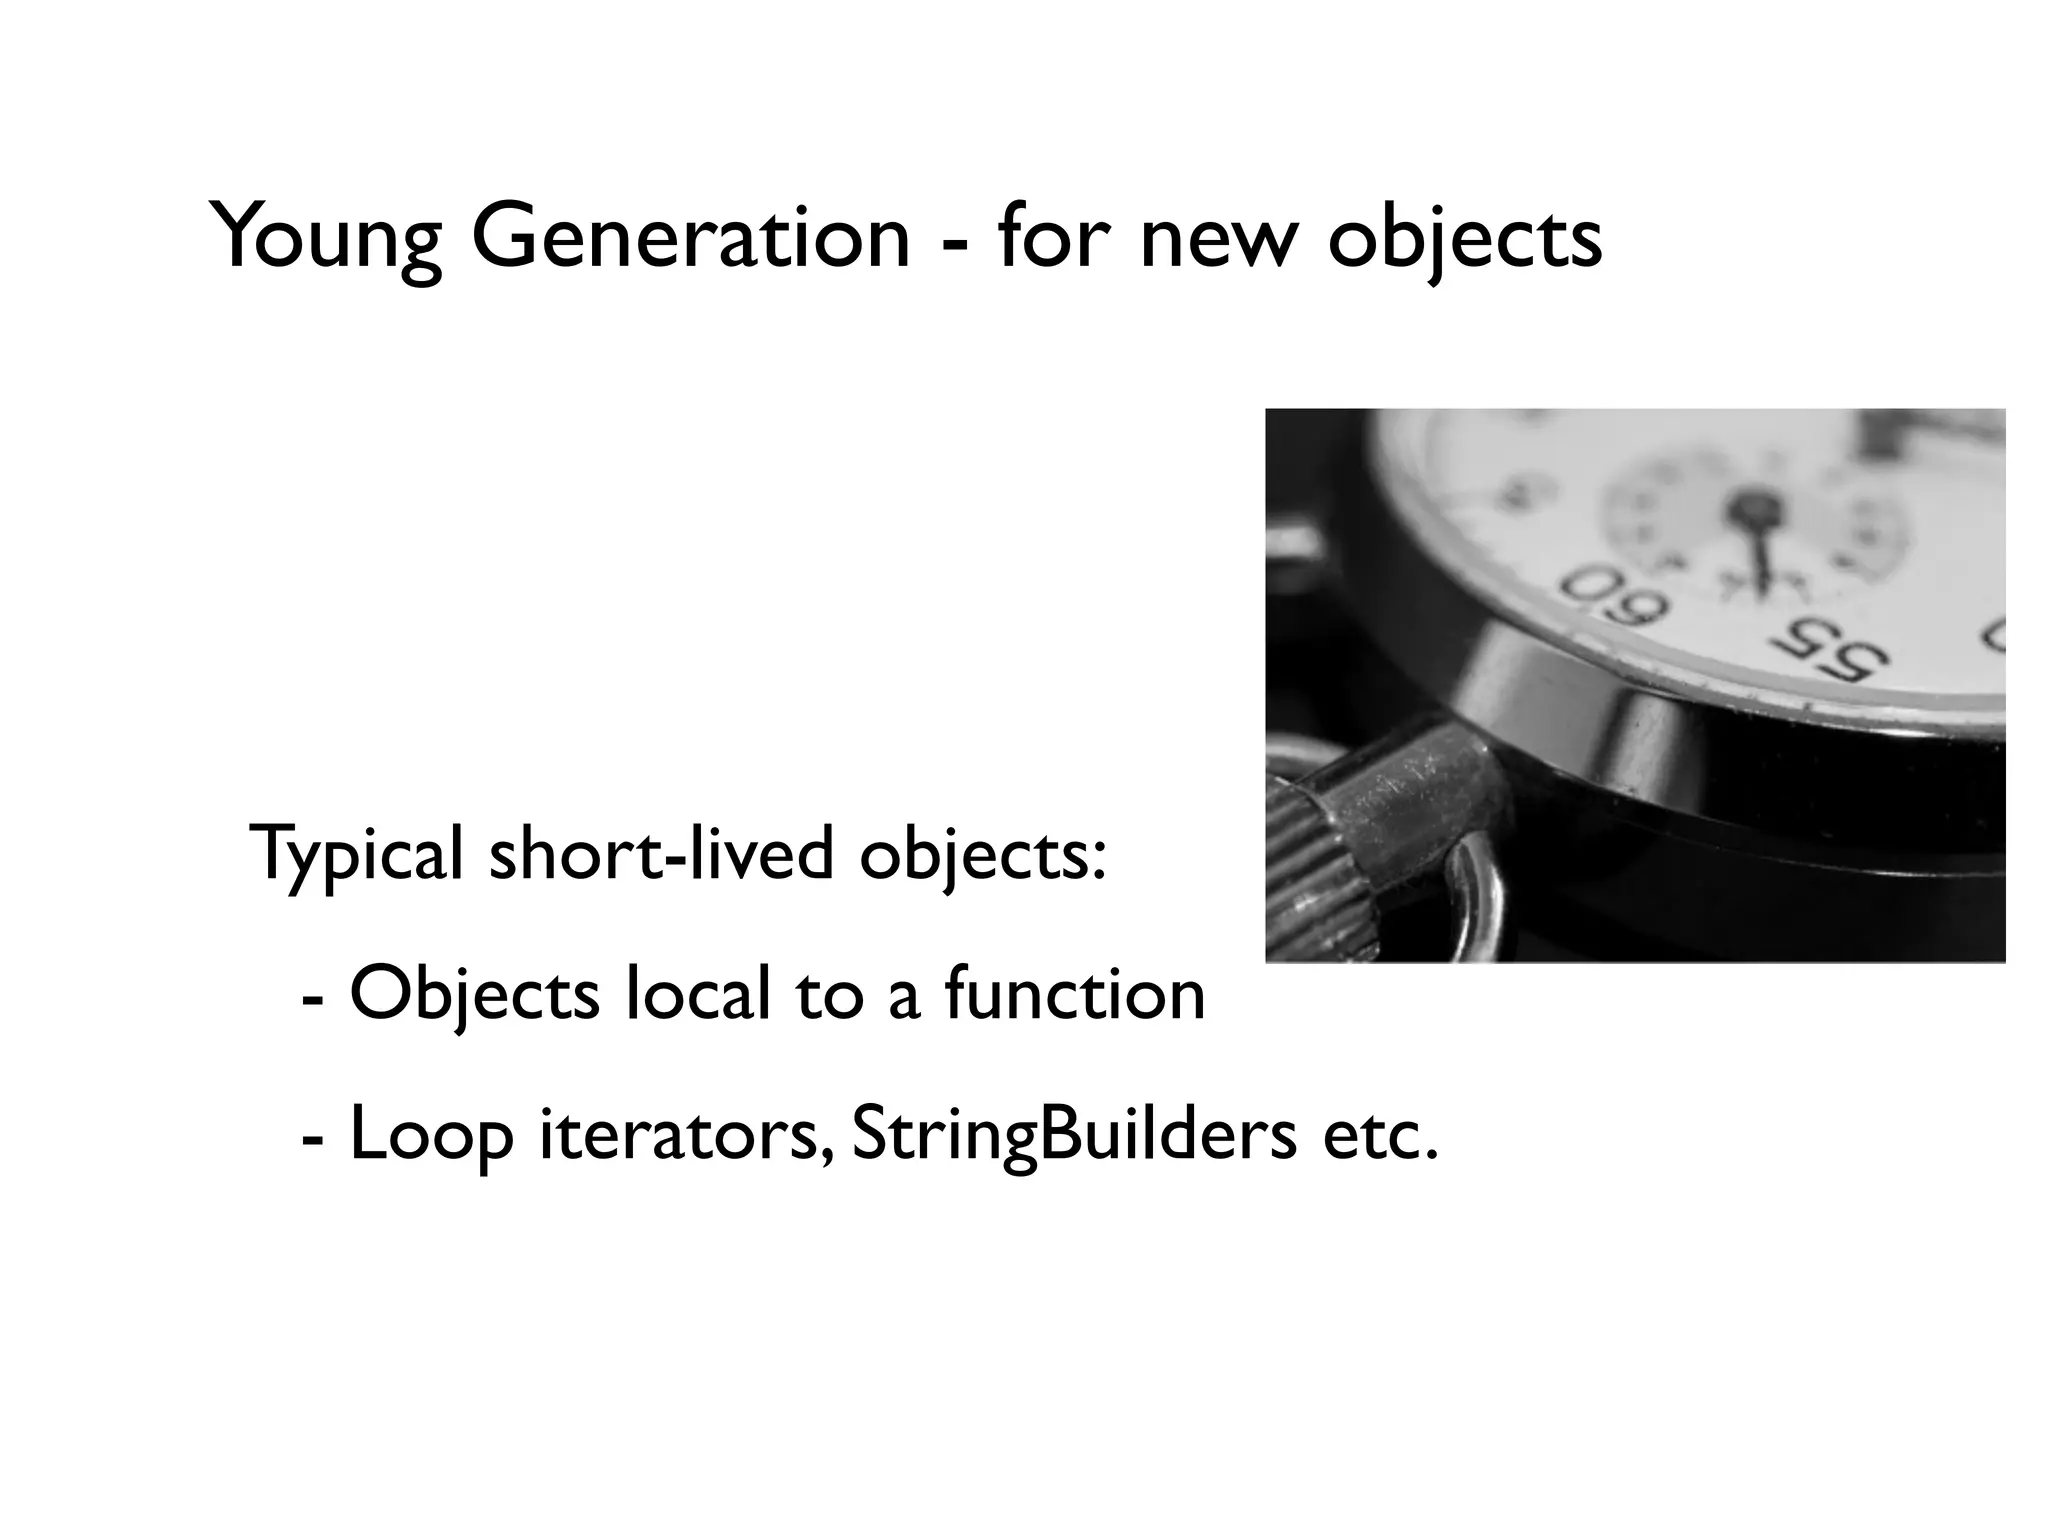
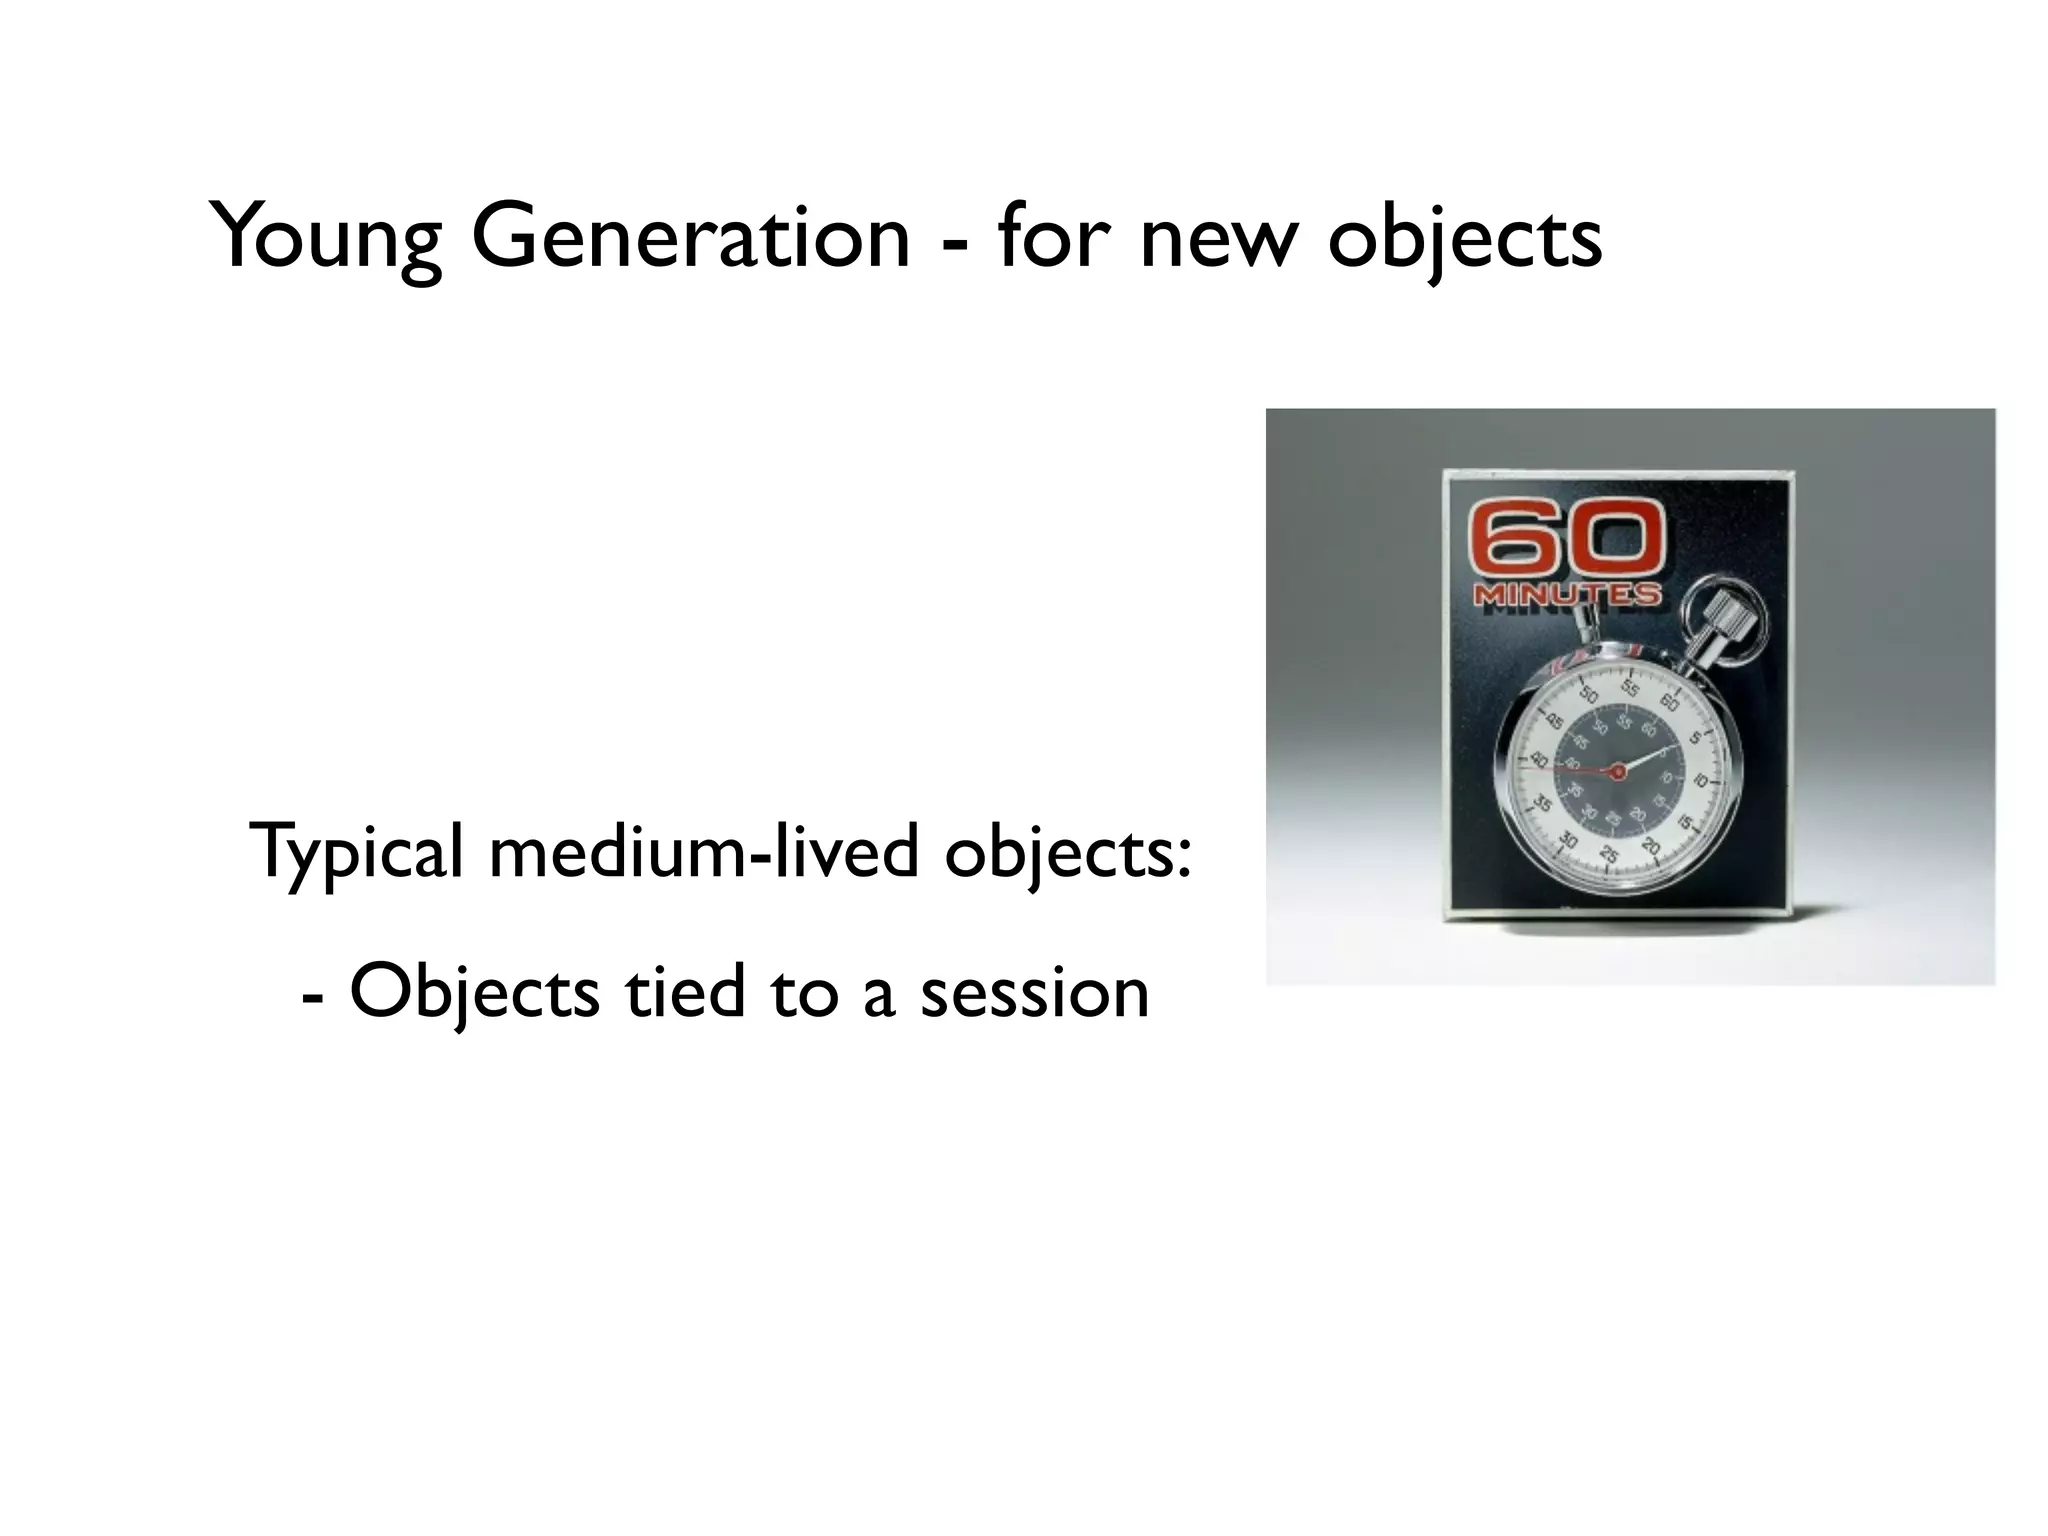
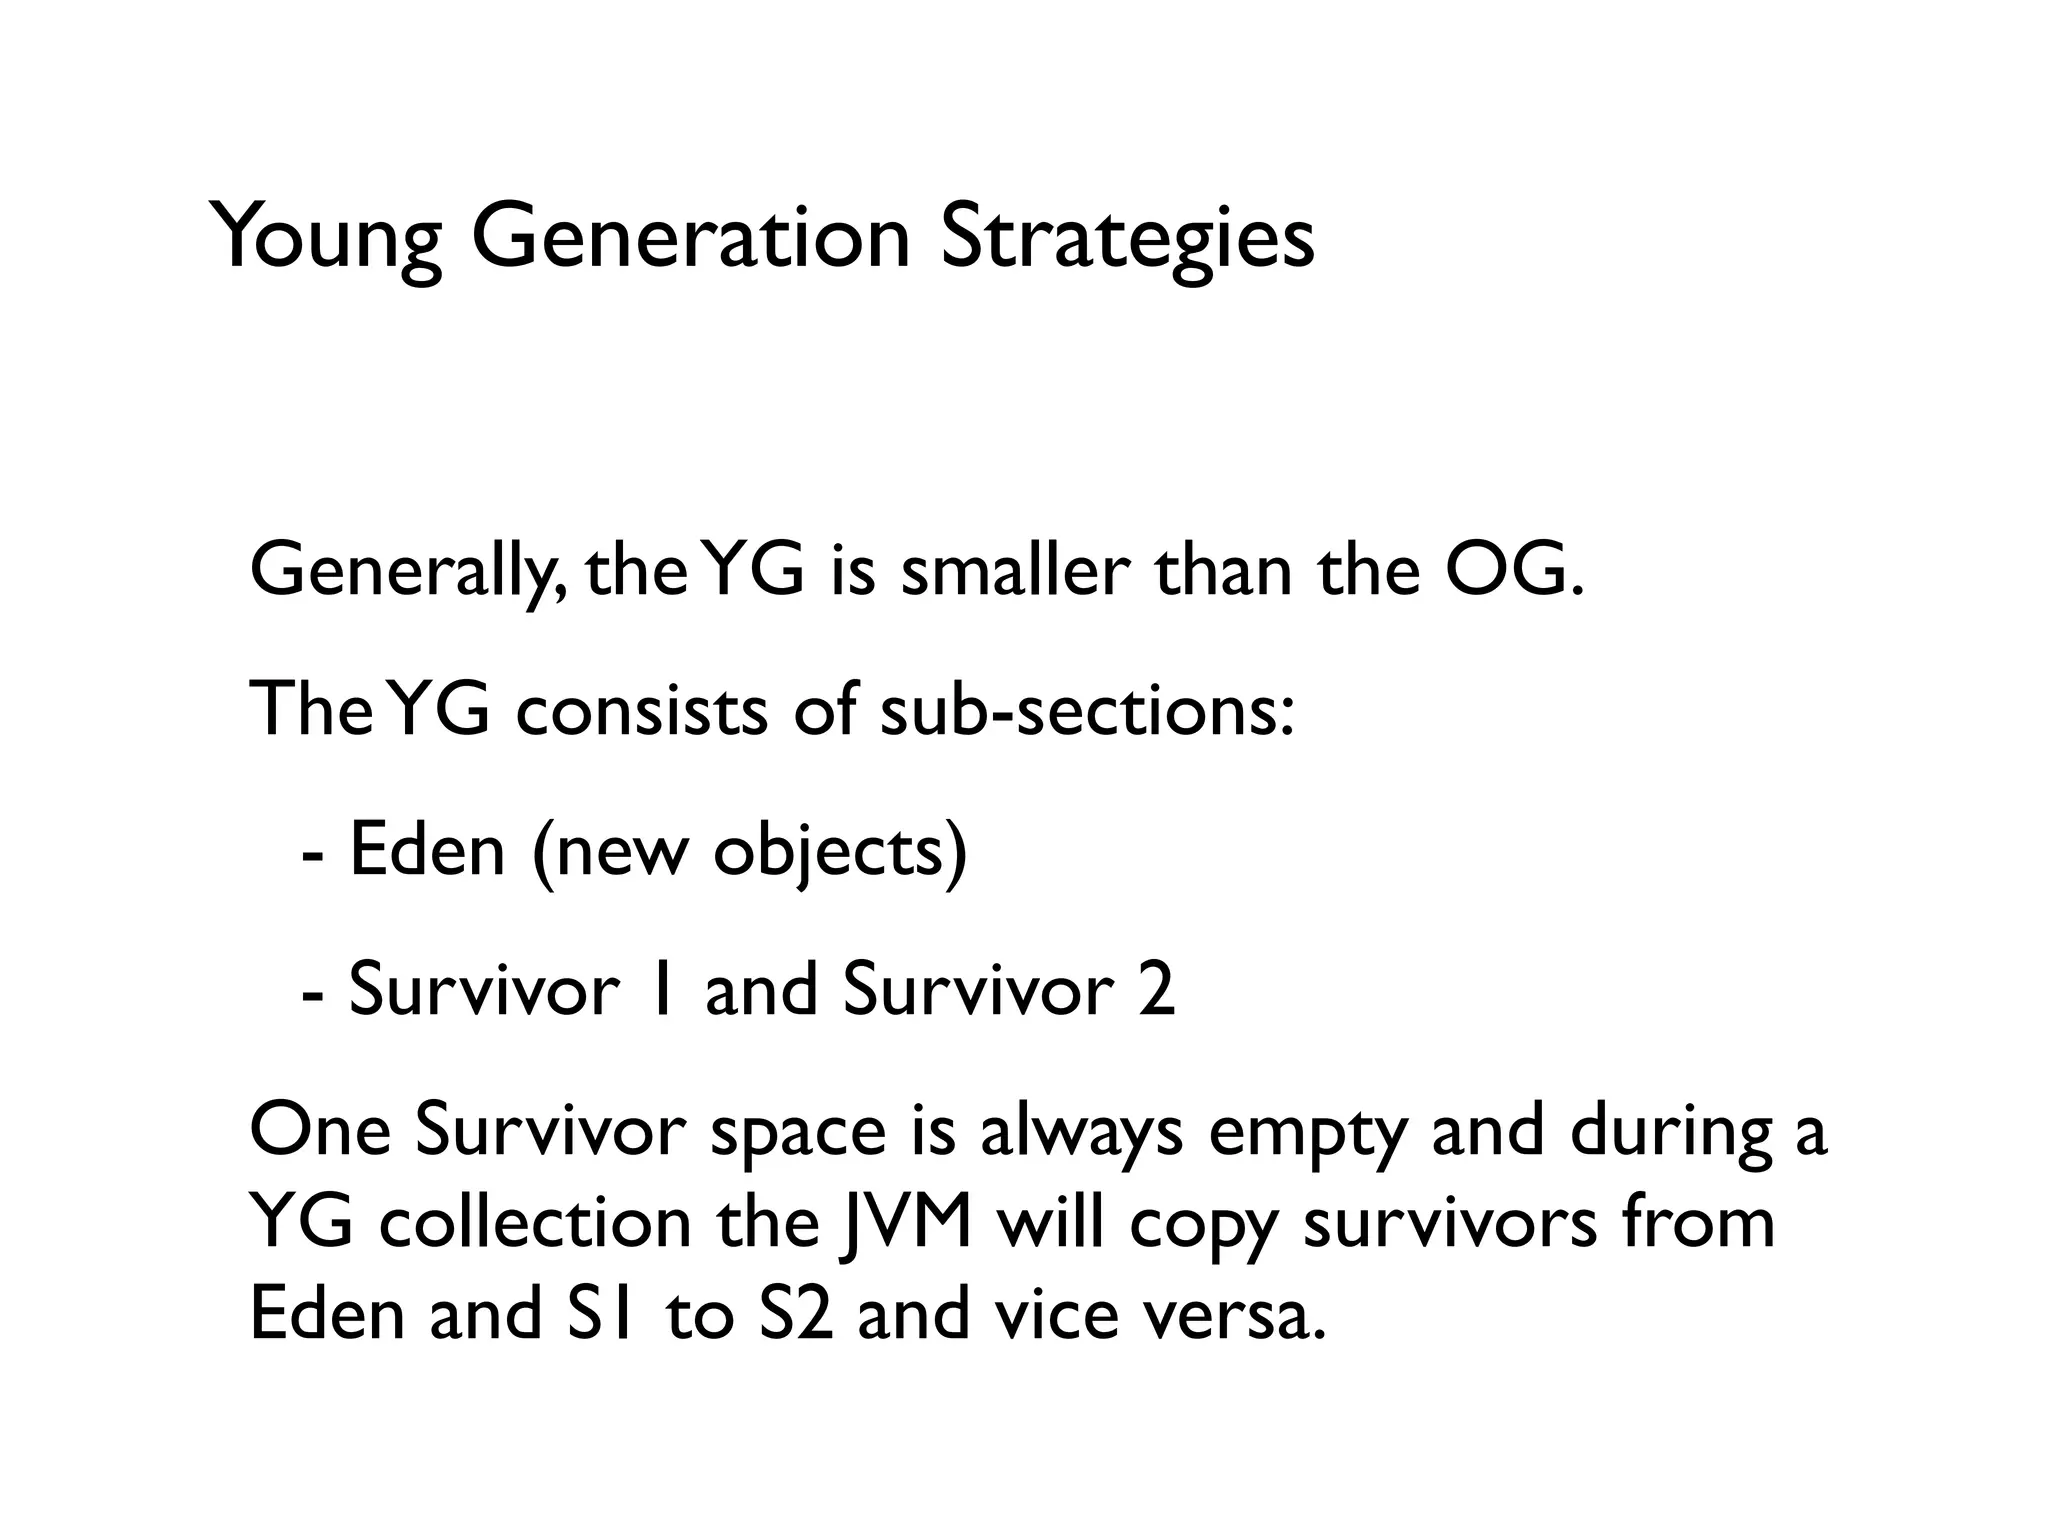
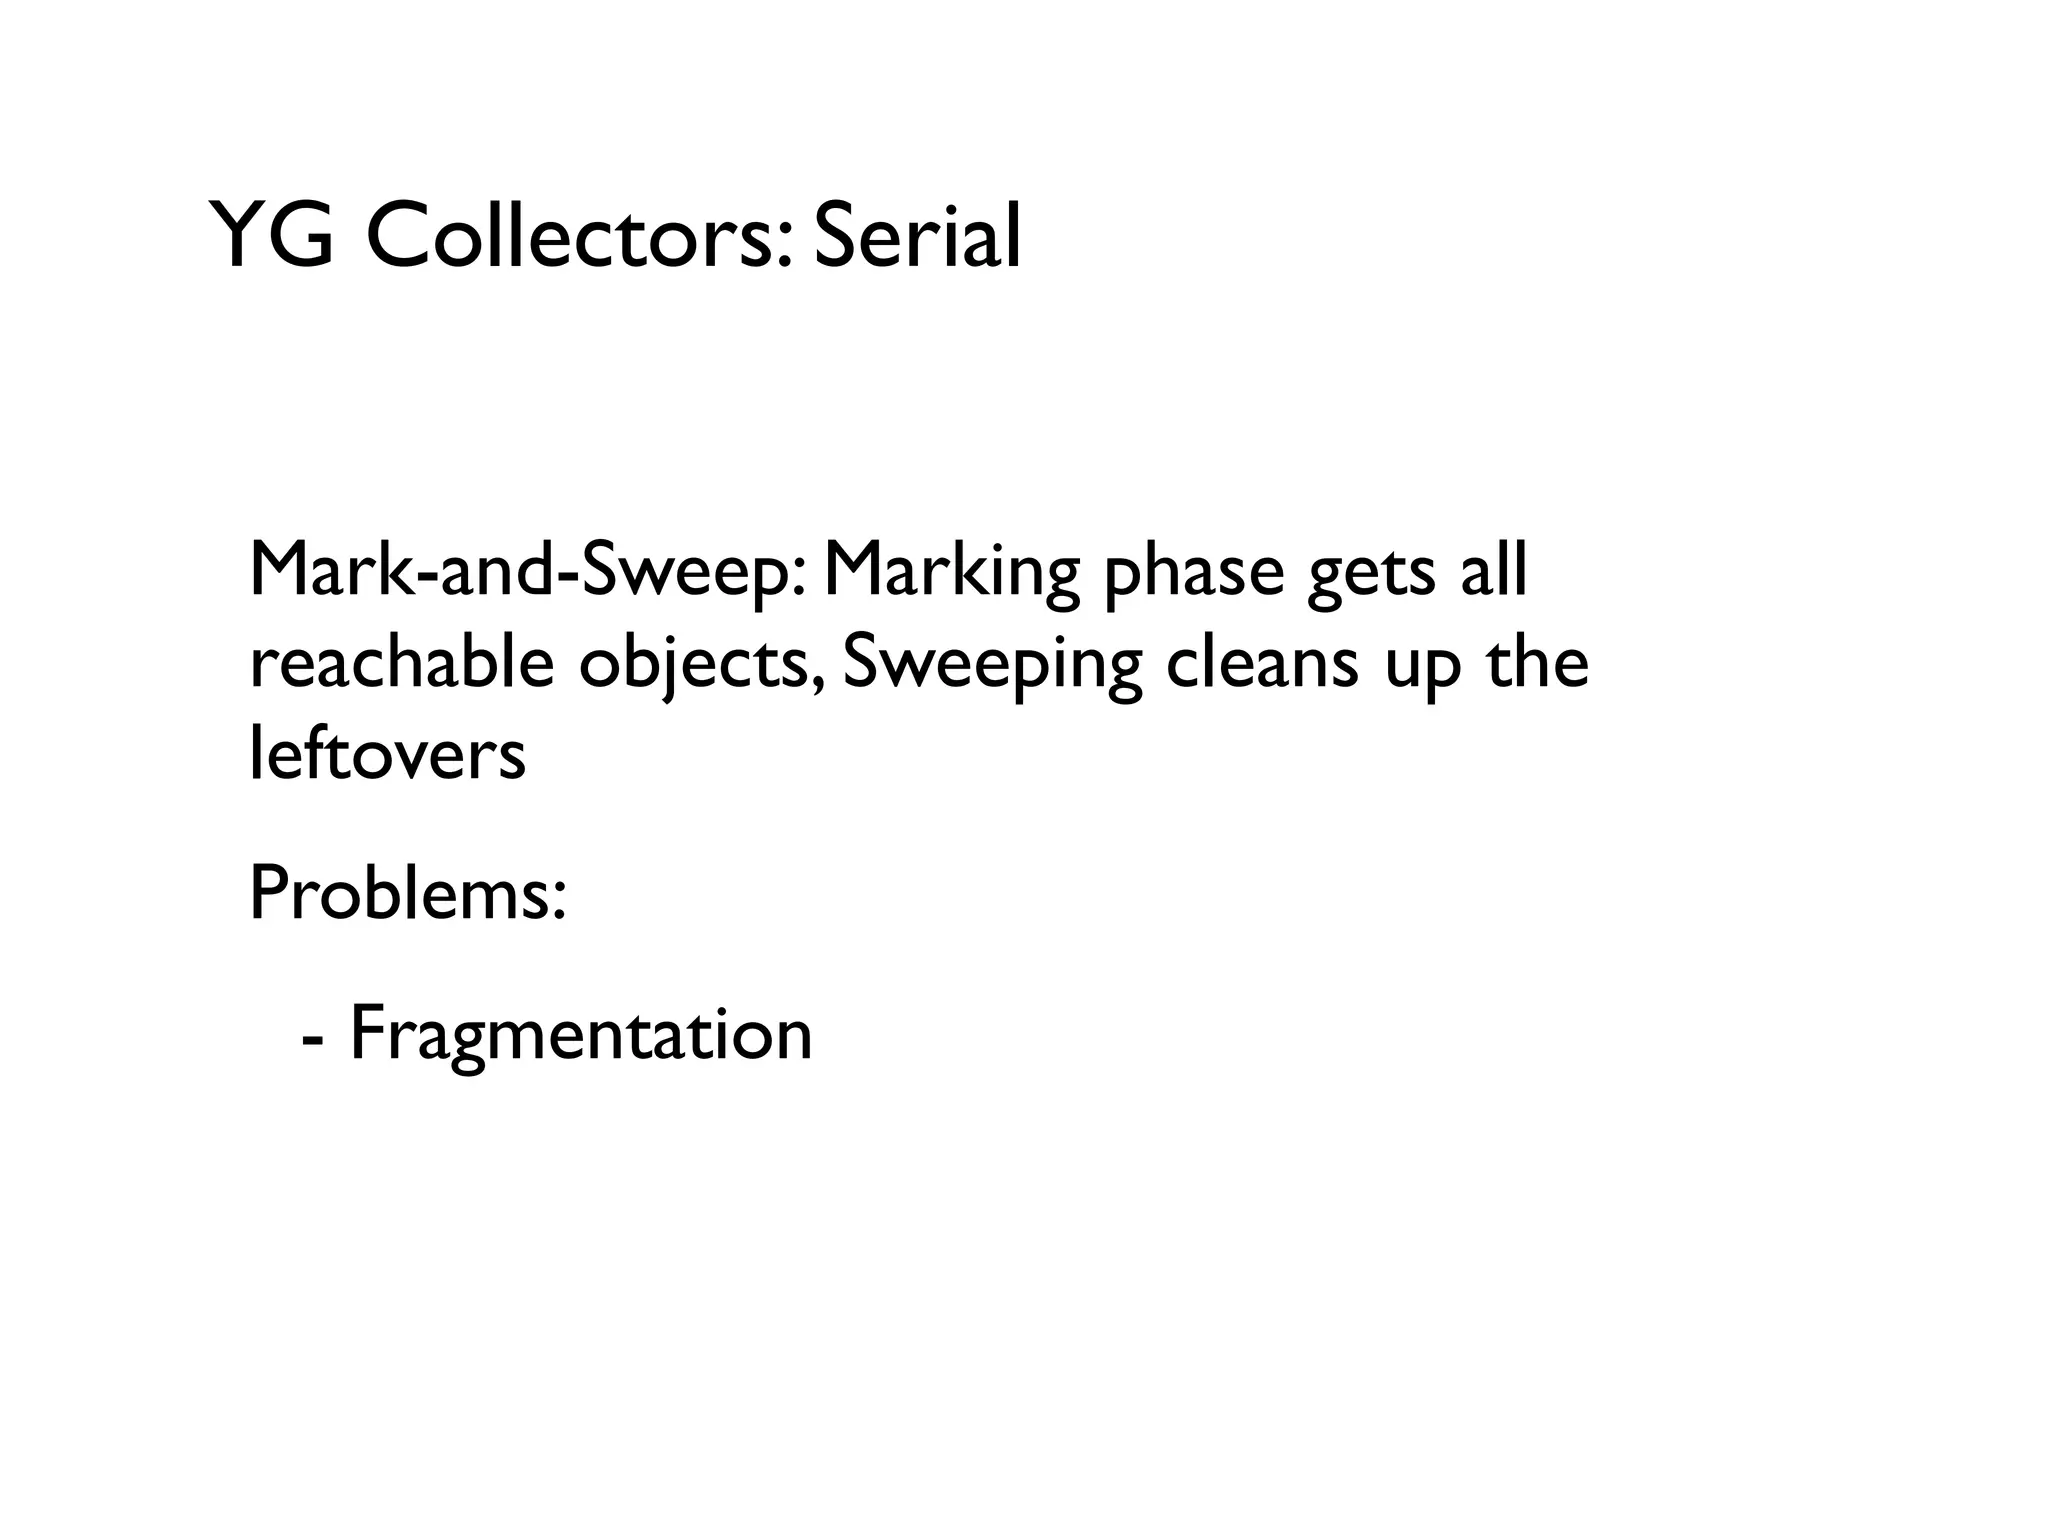
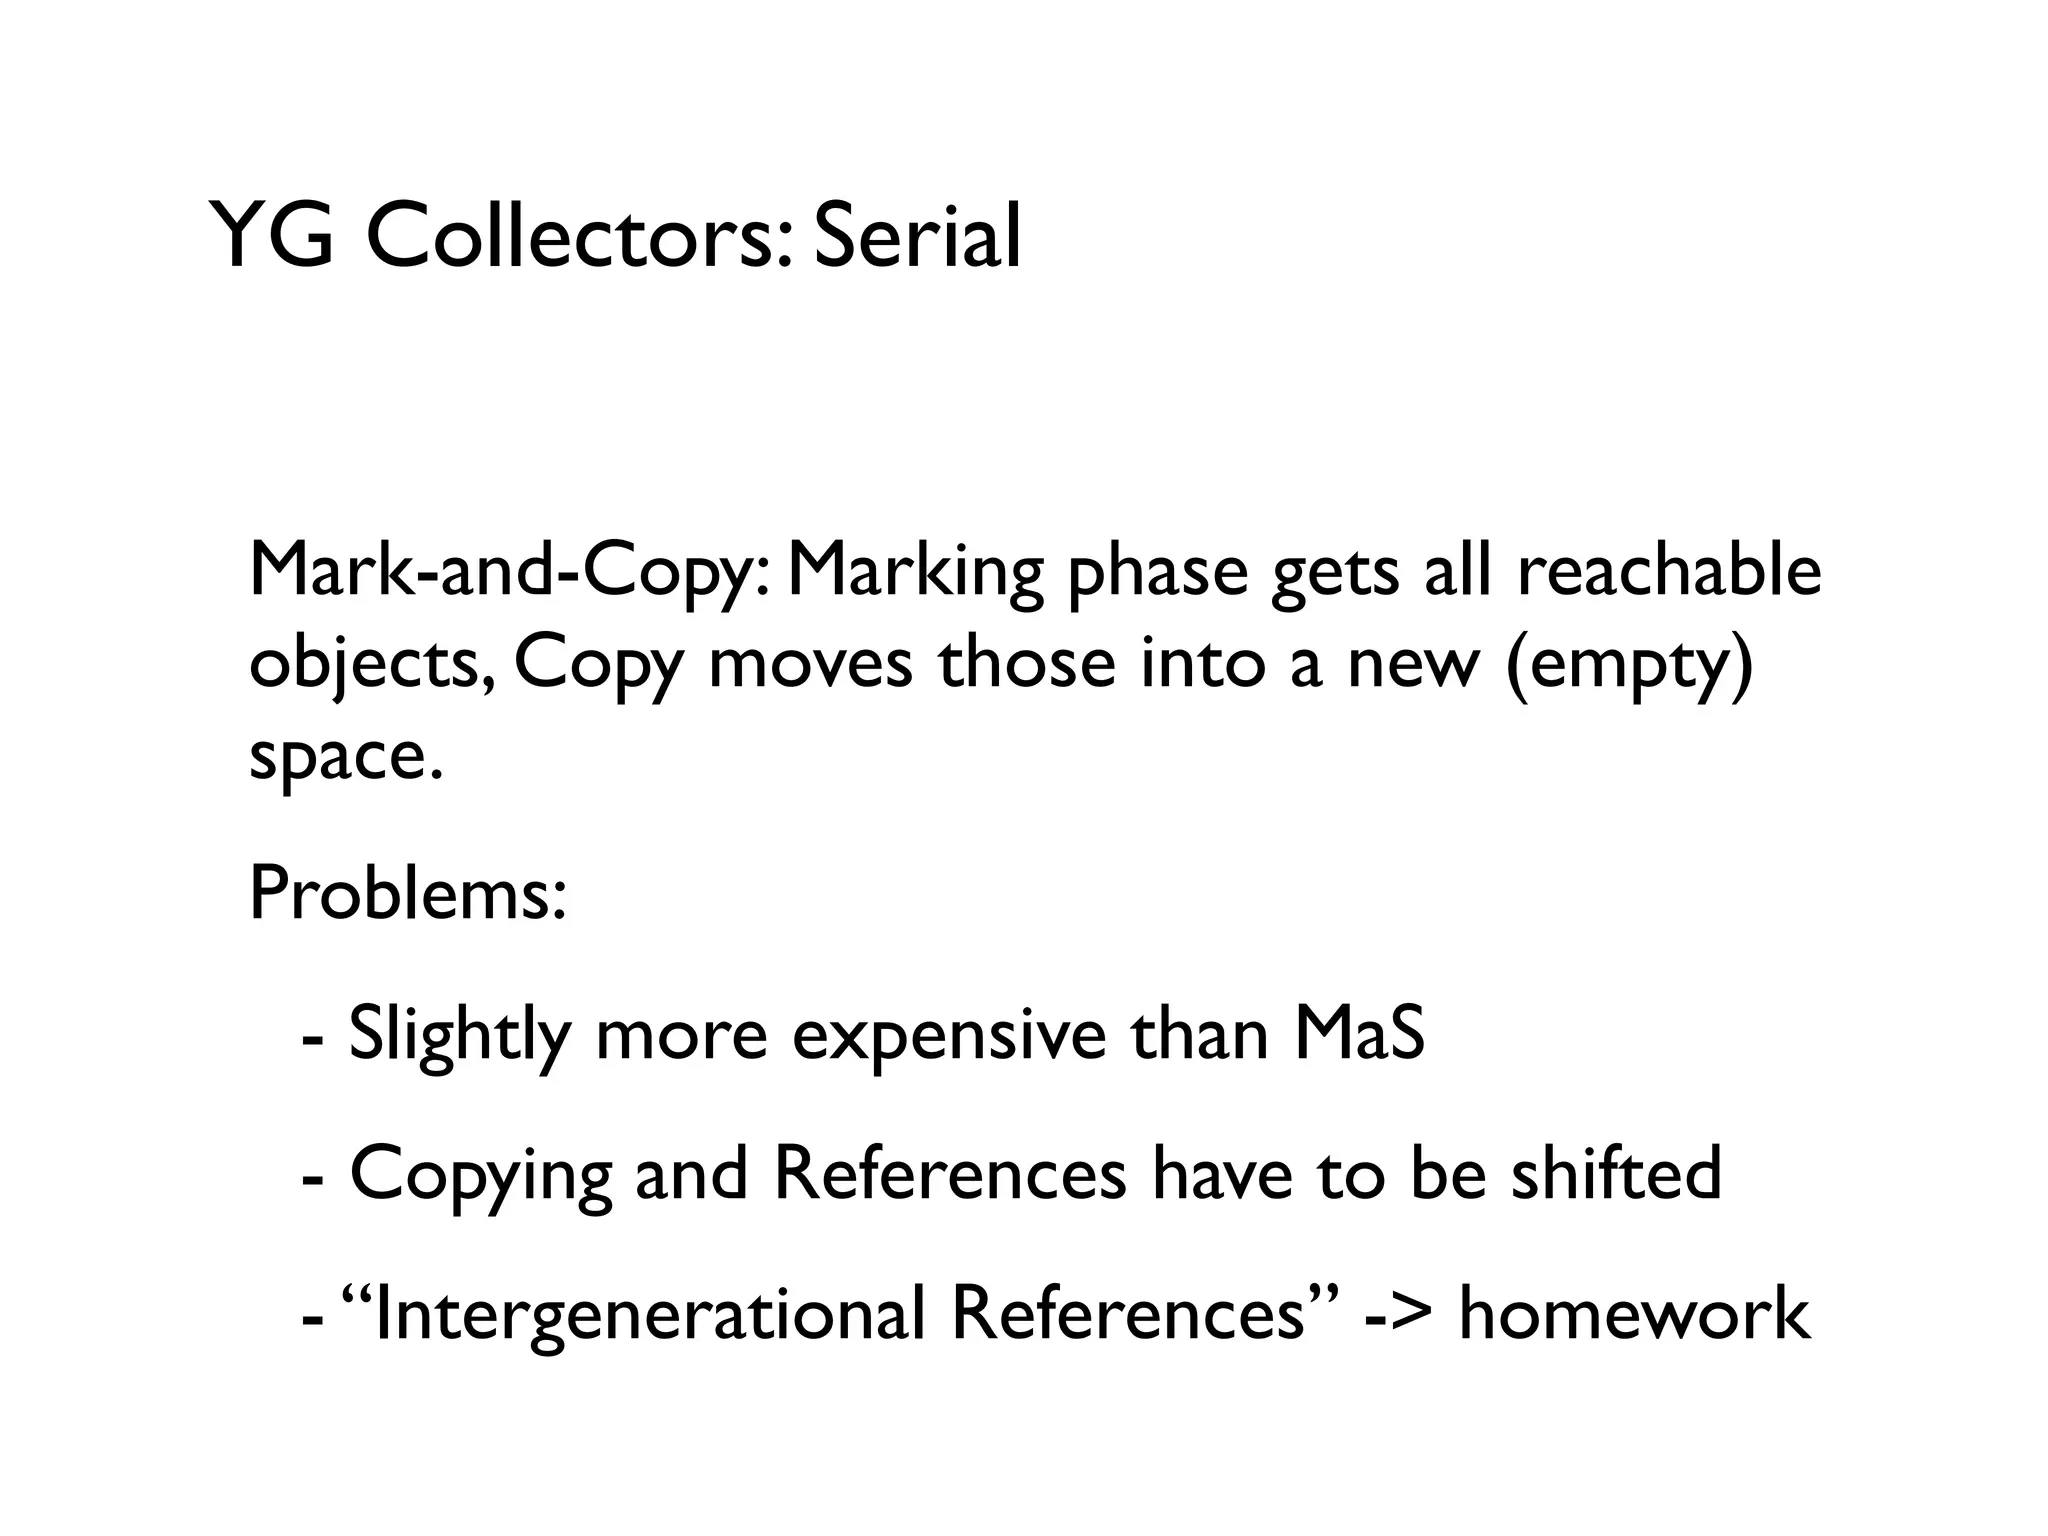
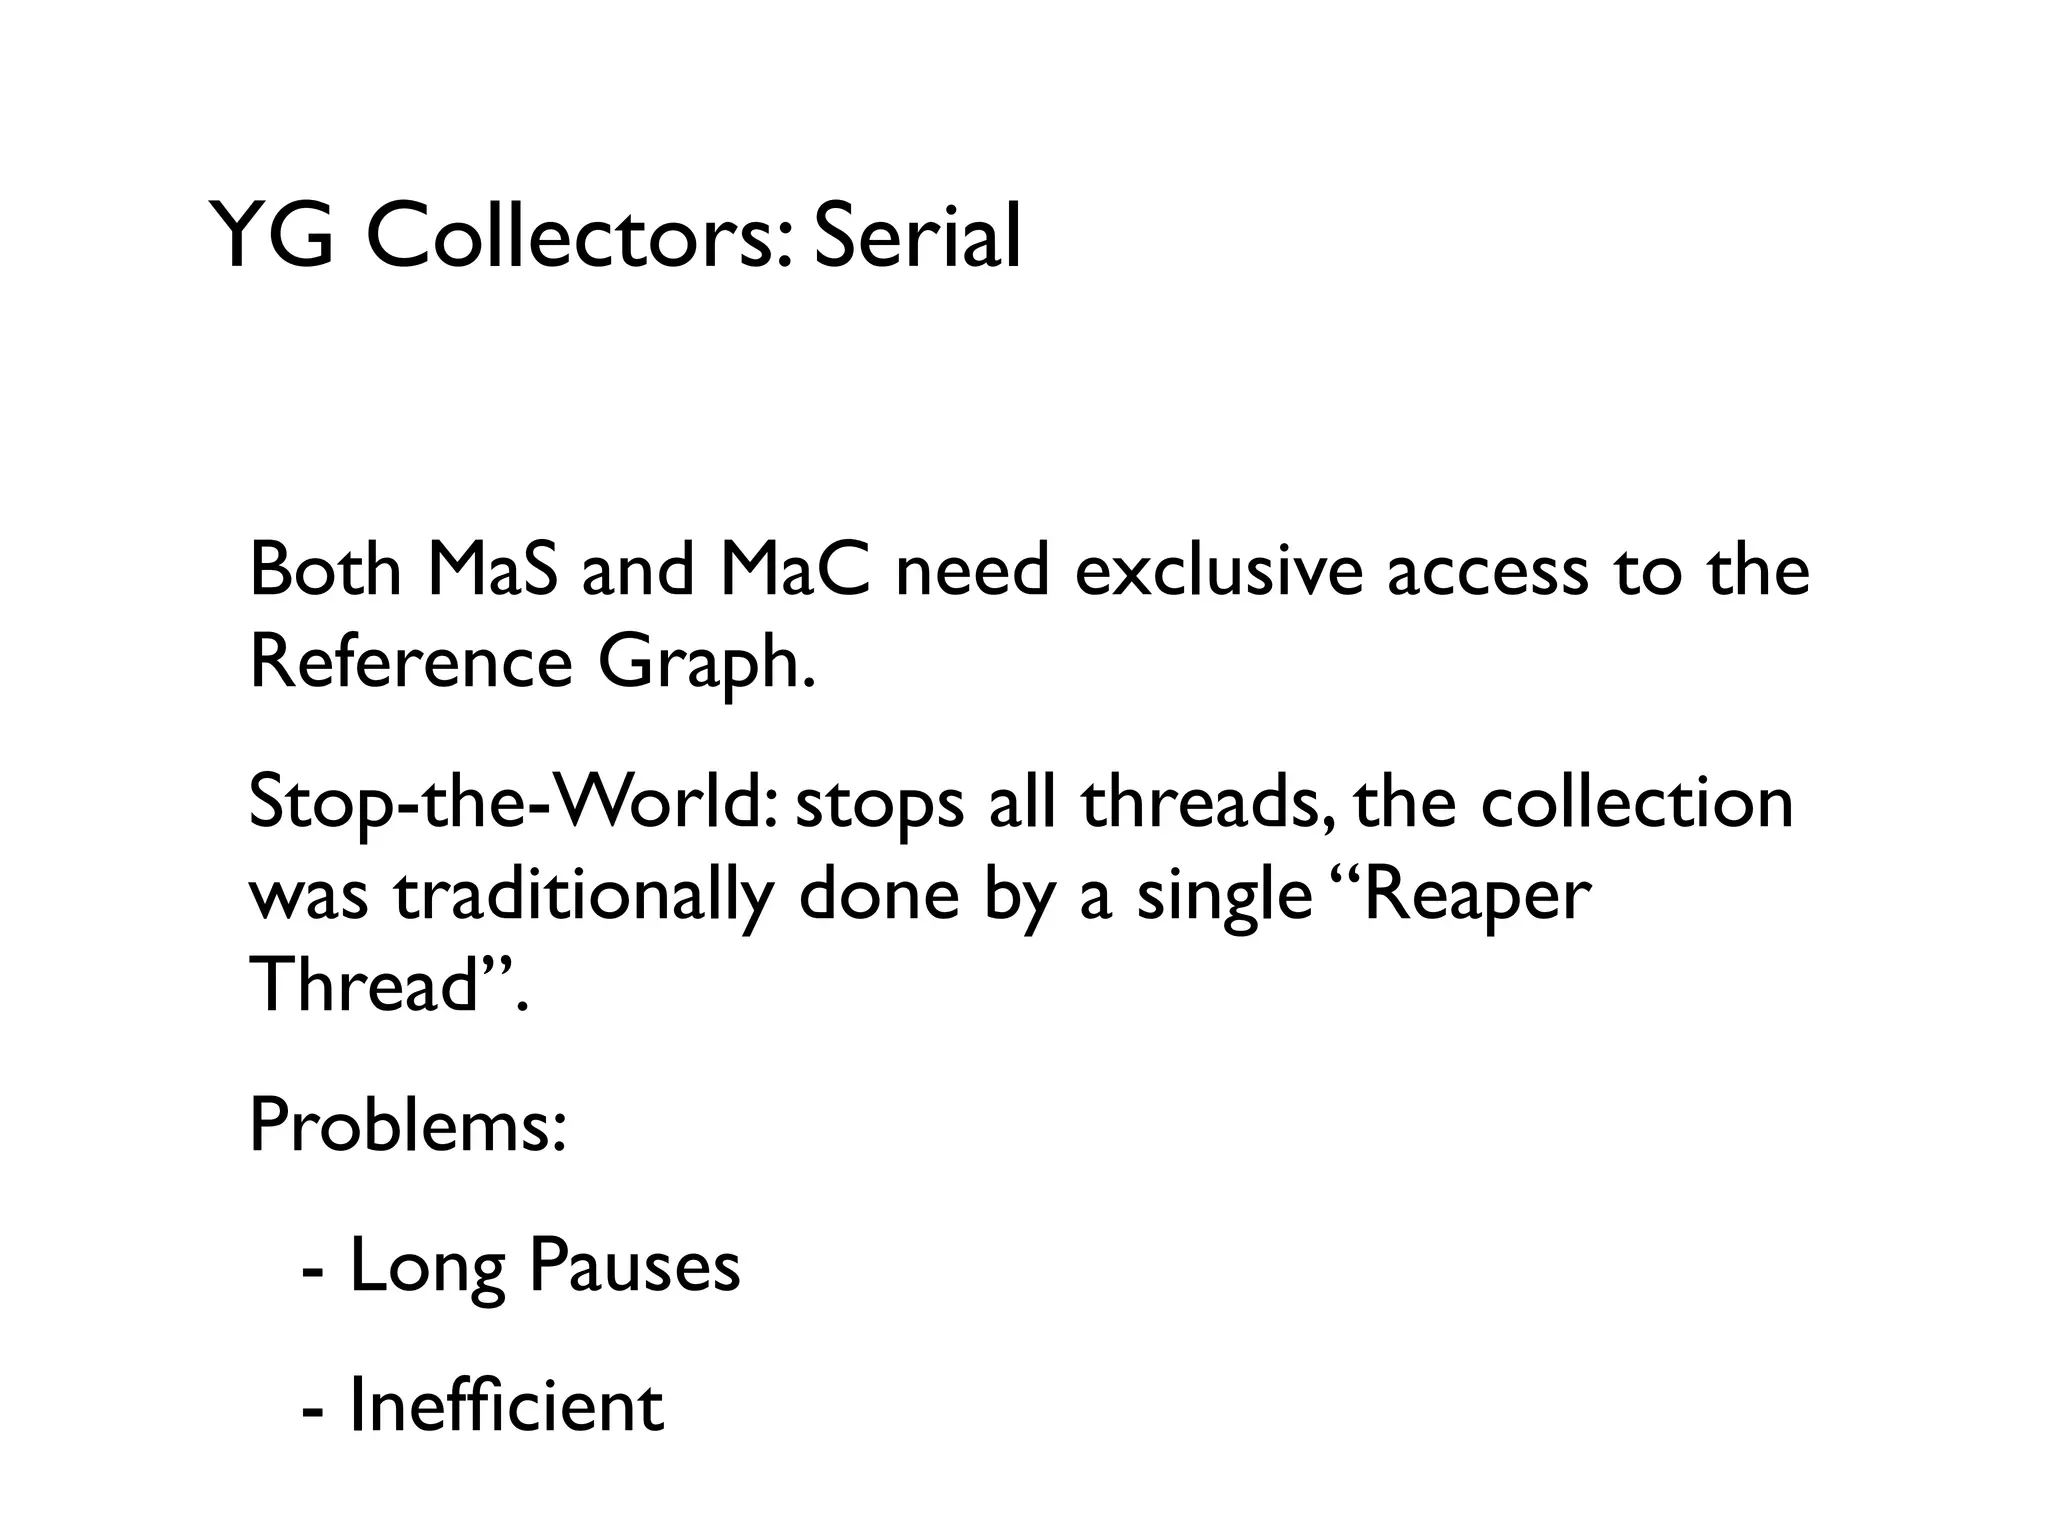
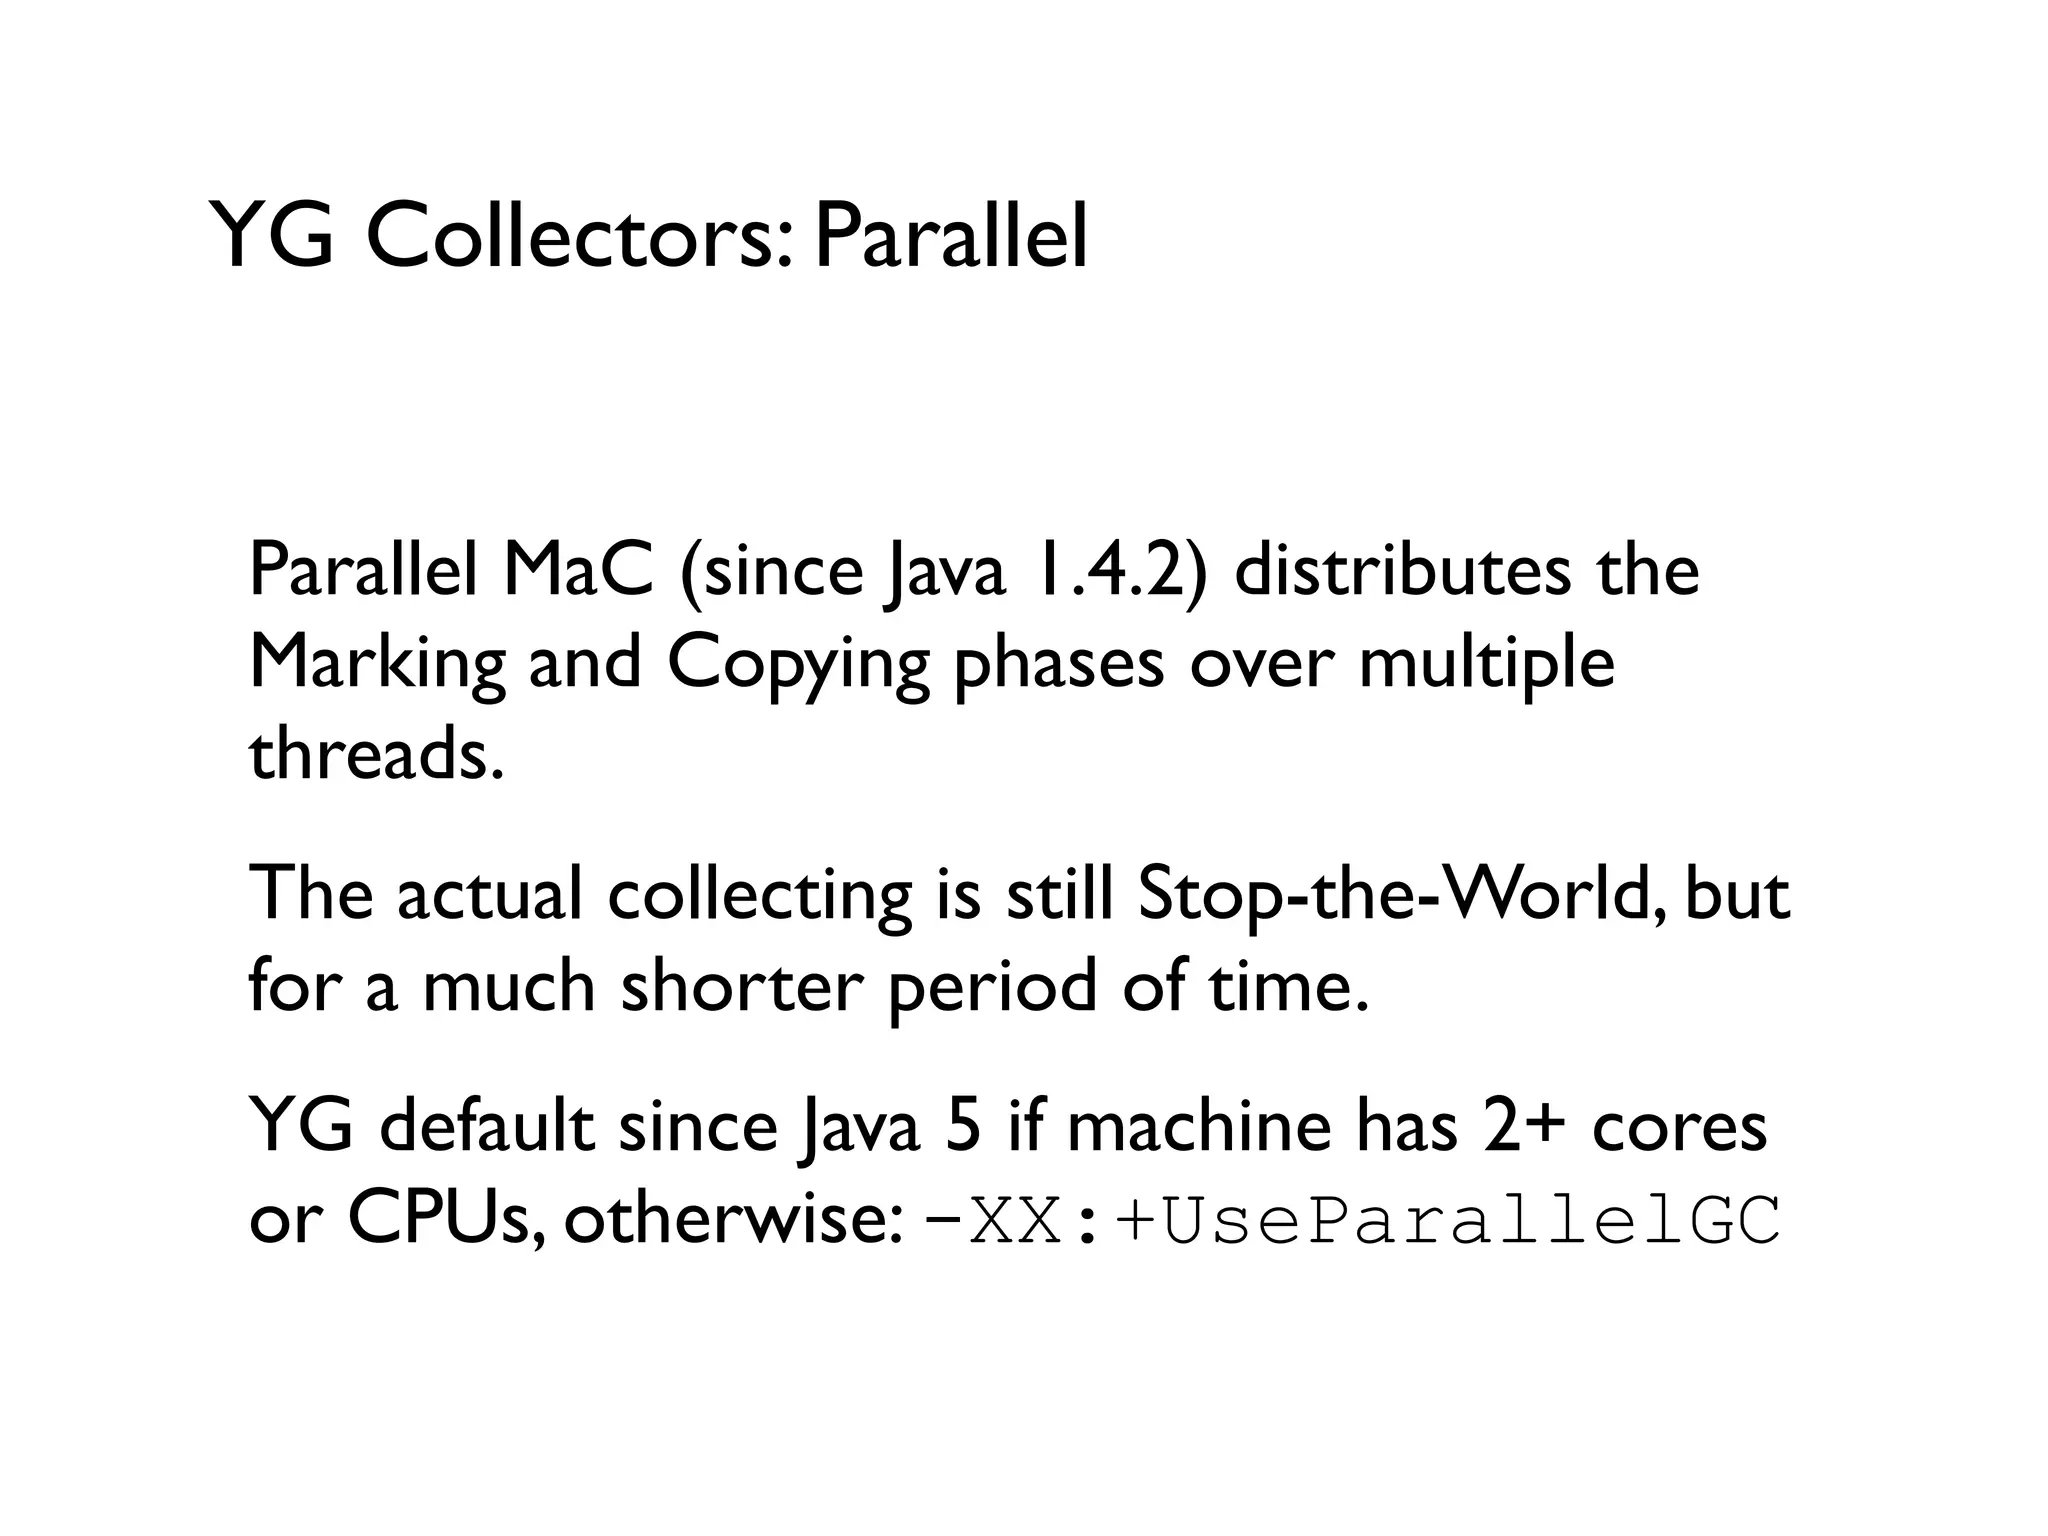
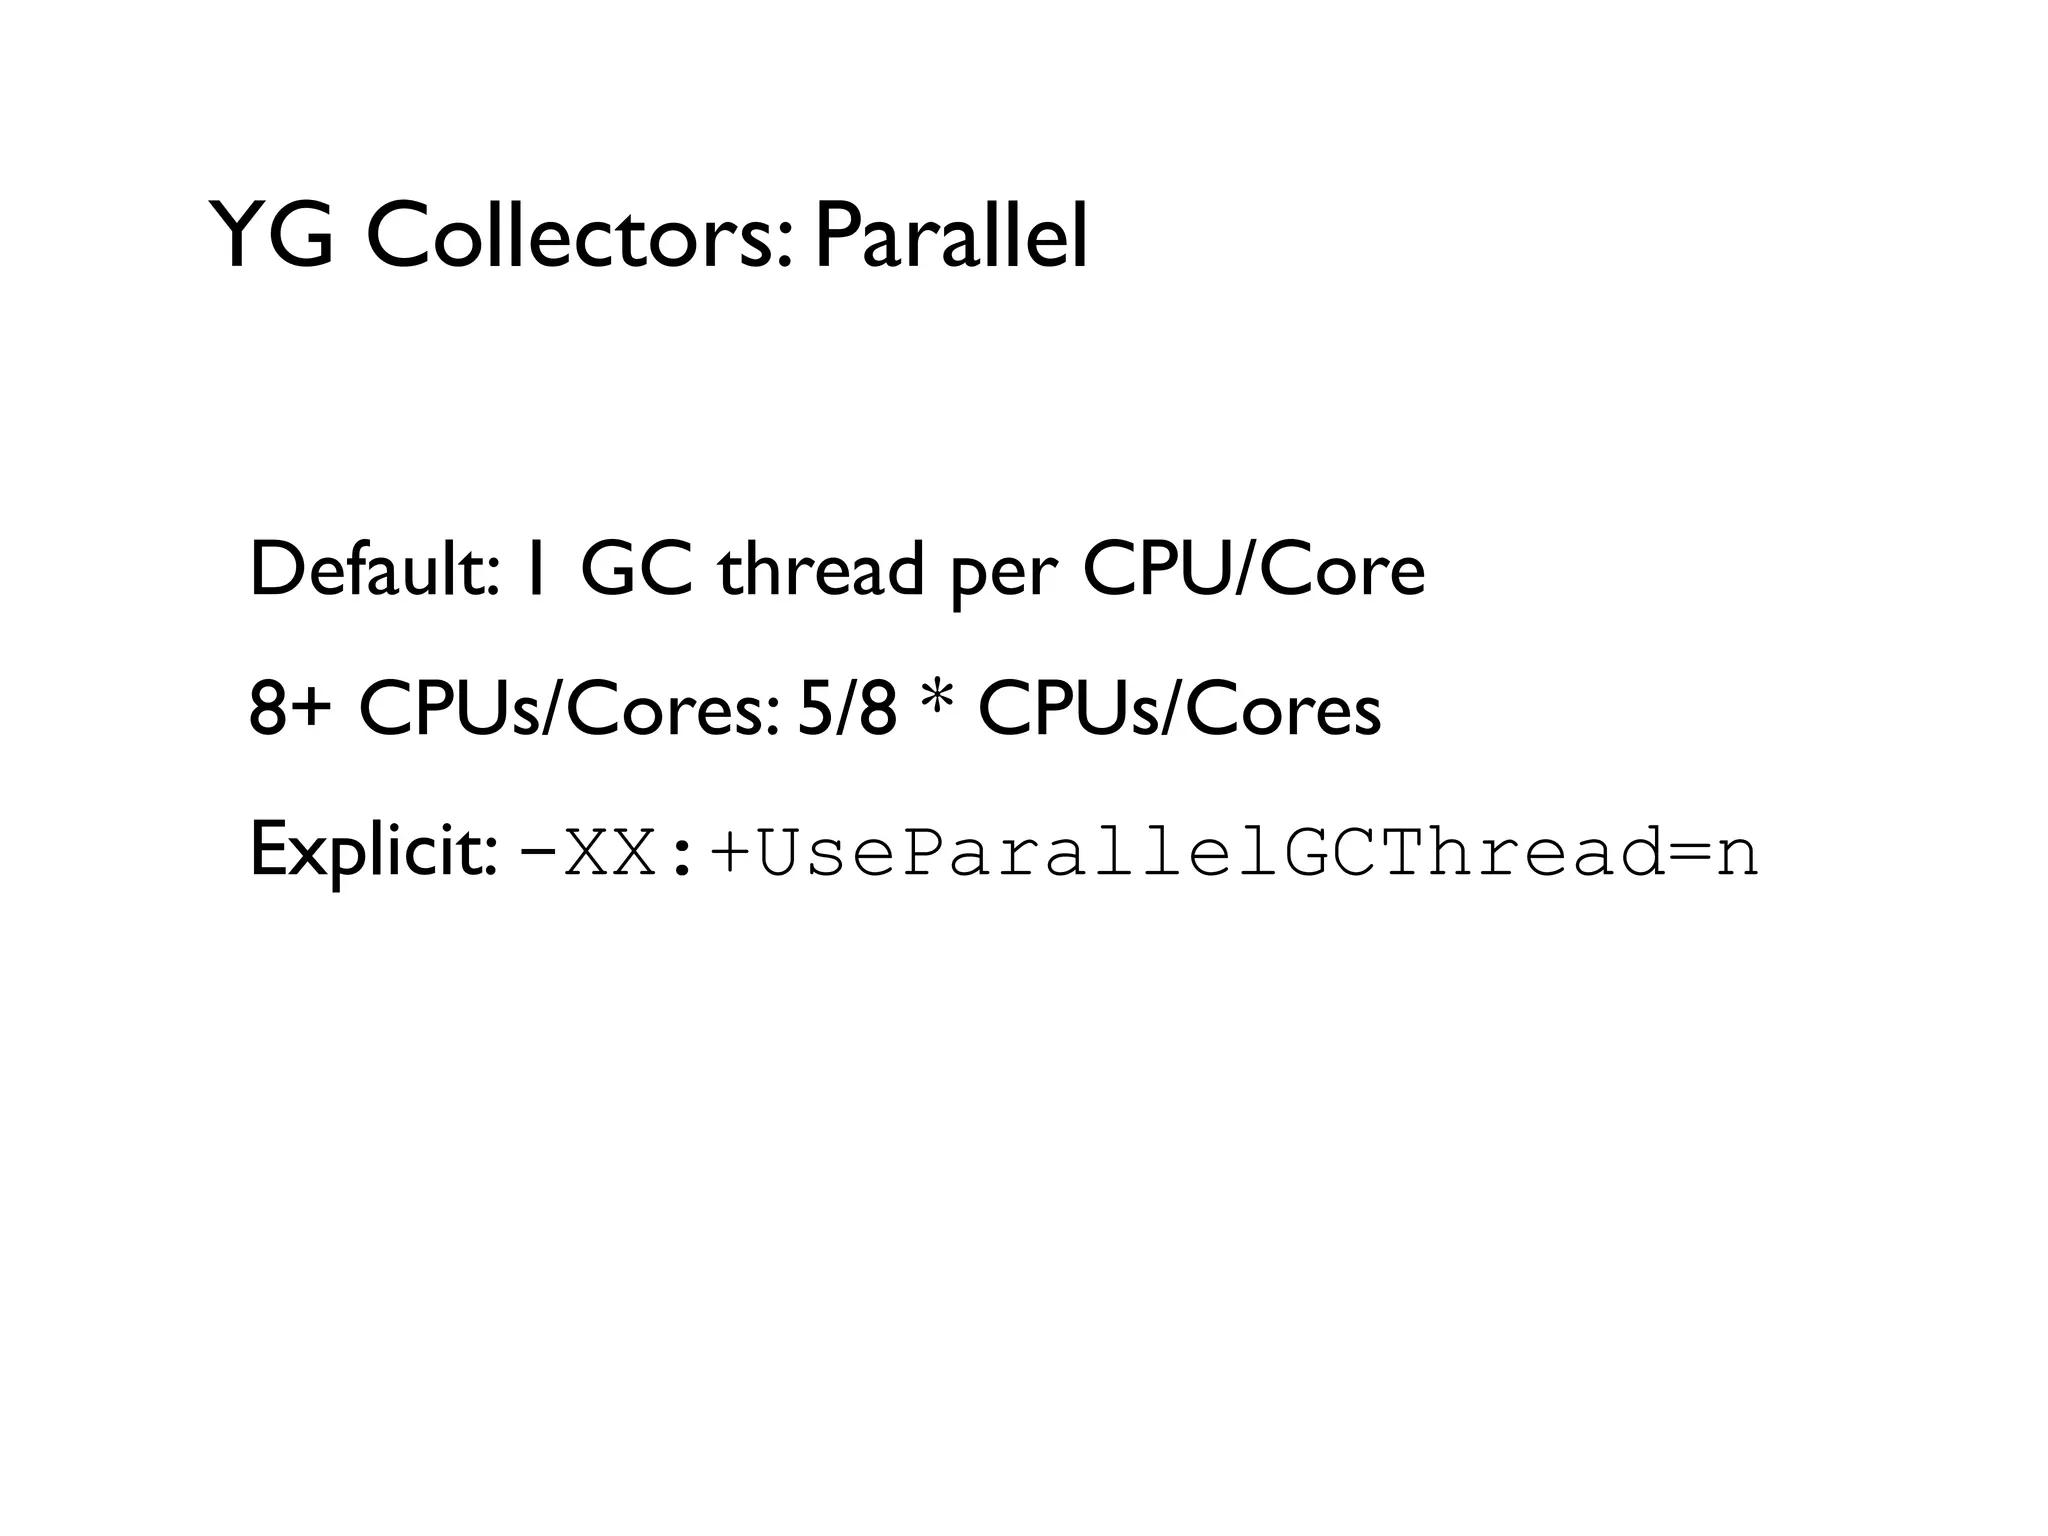
Different types of young generation collectors, their methods, efficiency, and respective problems.
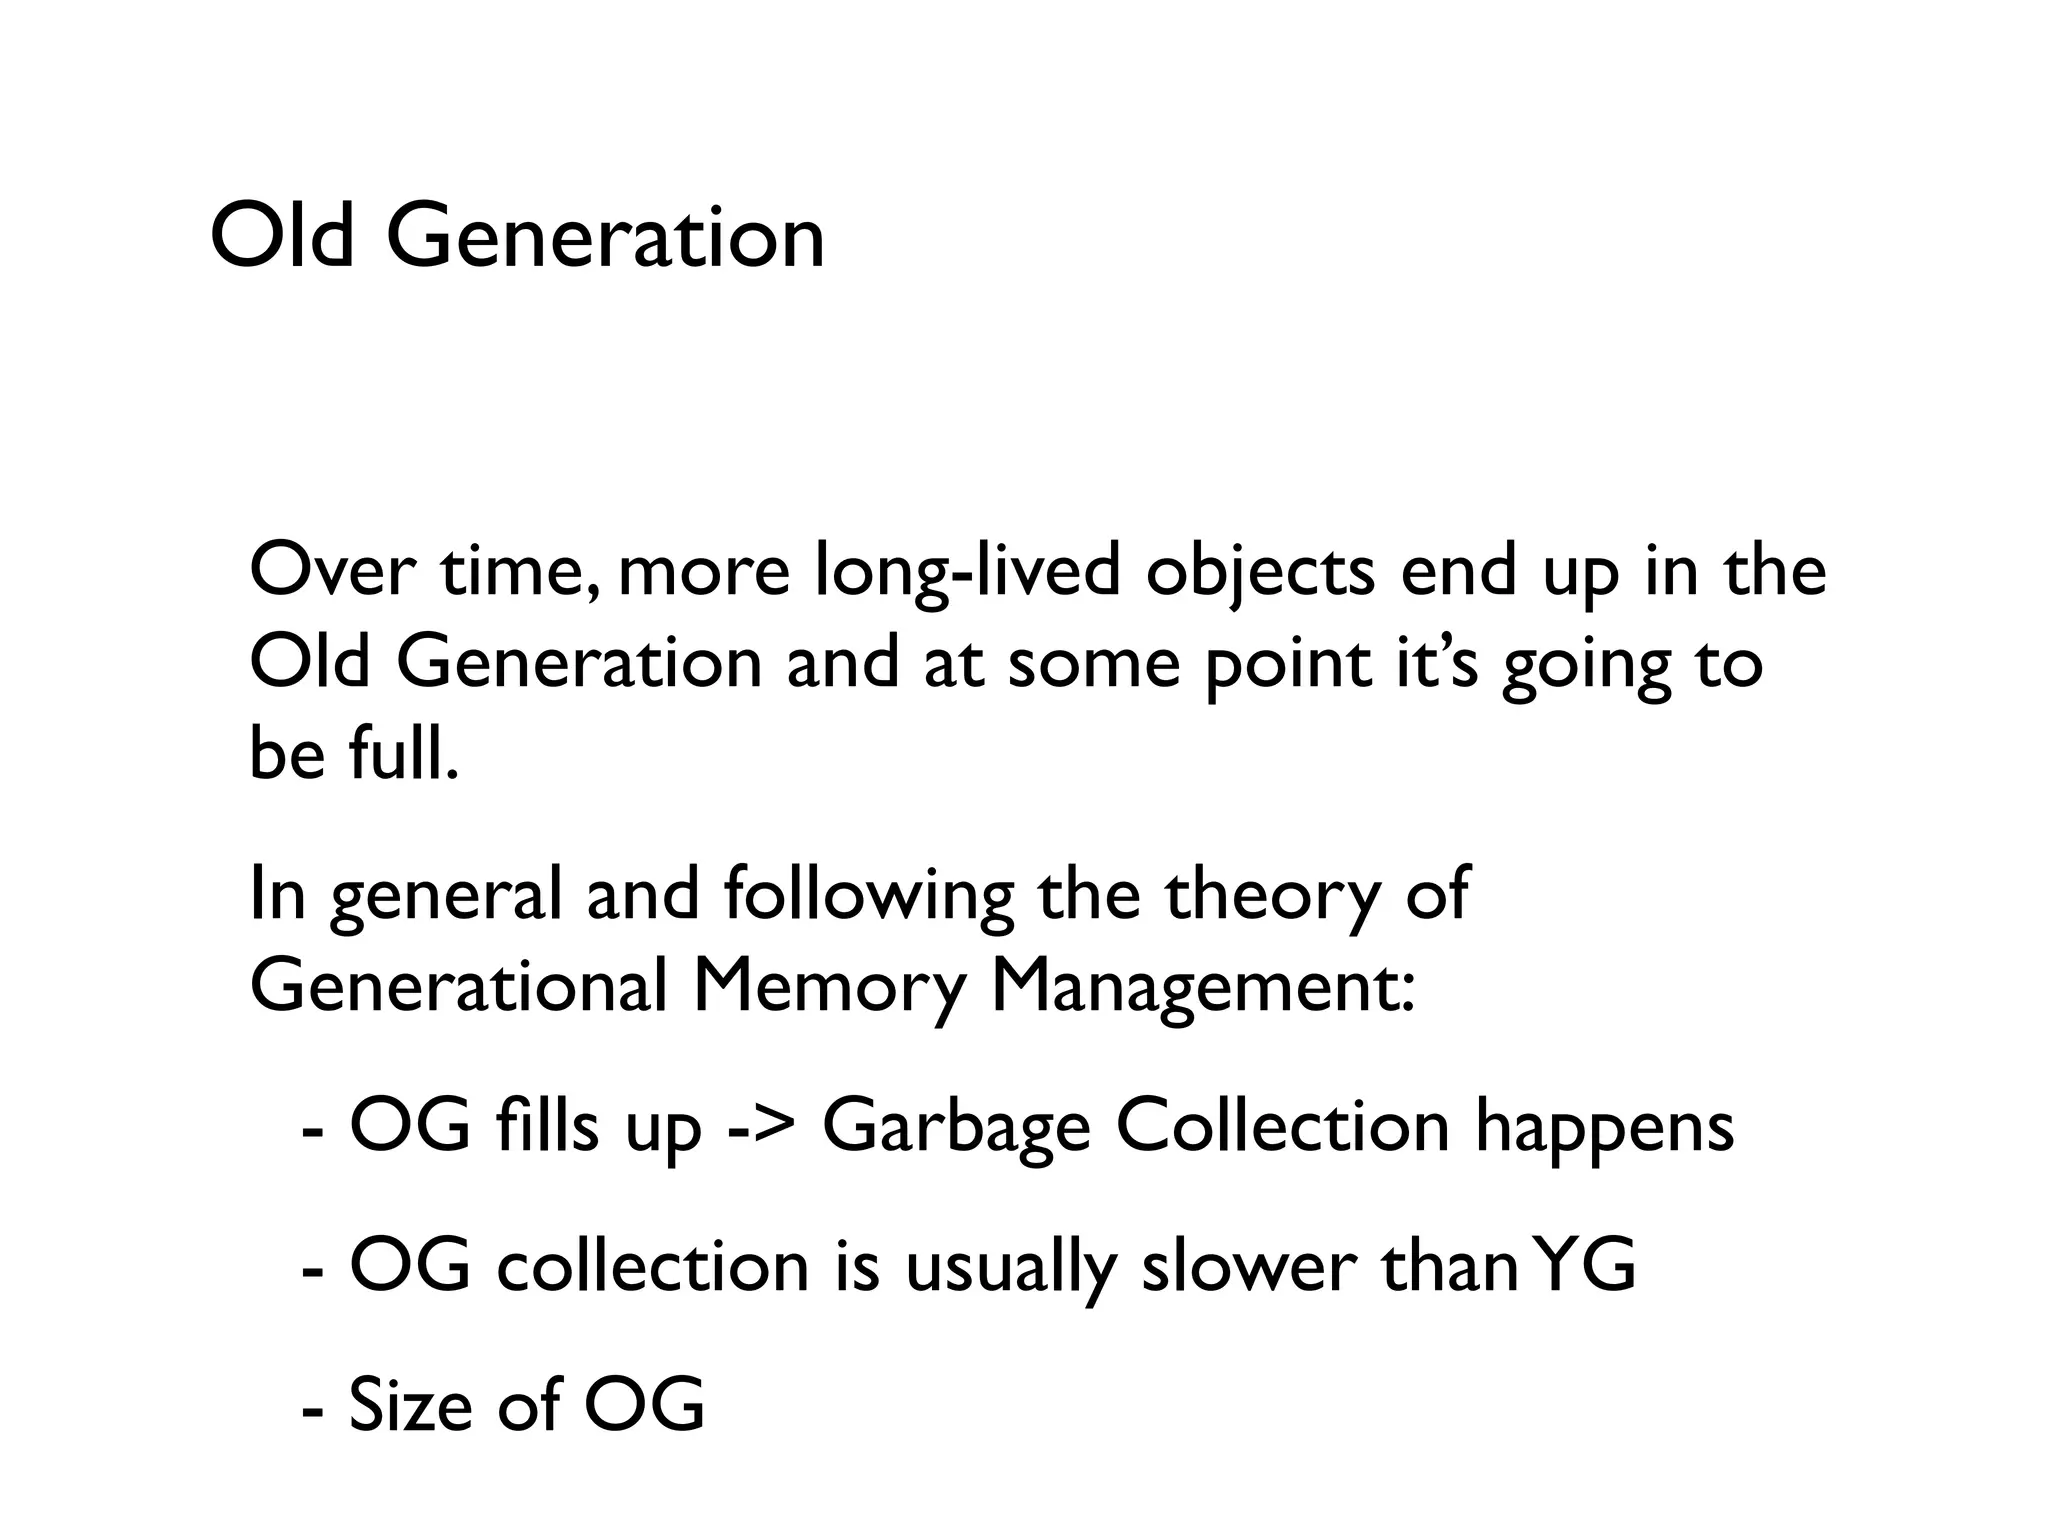
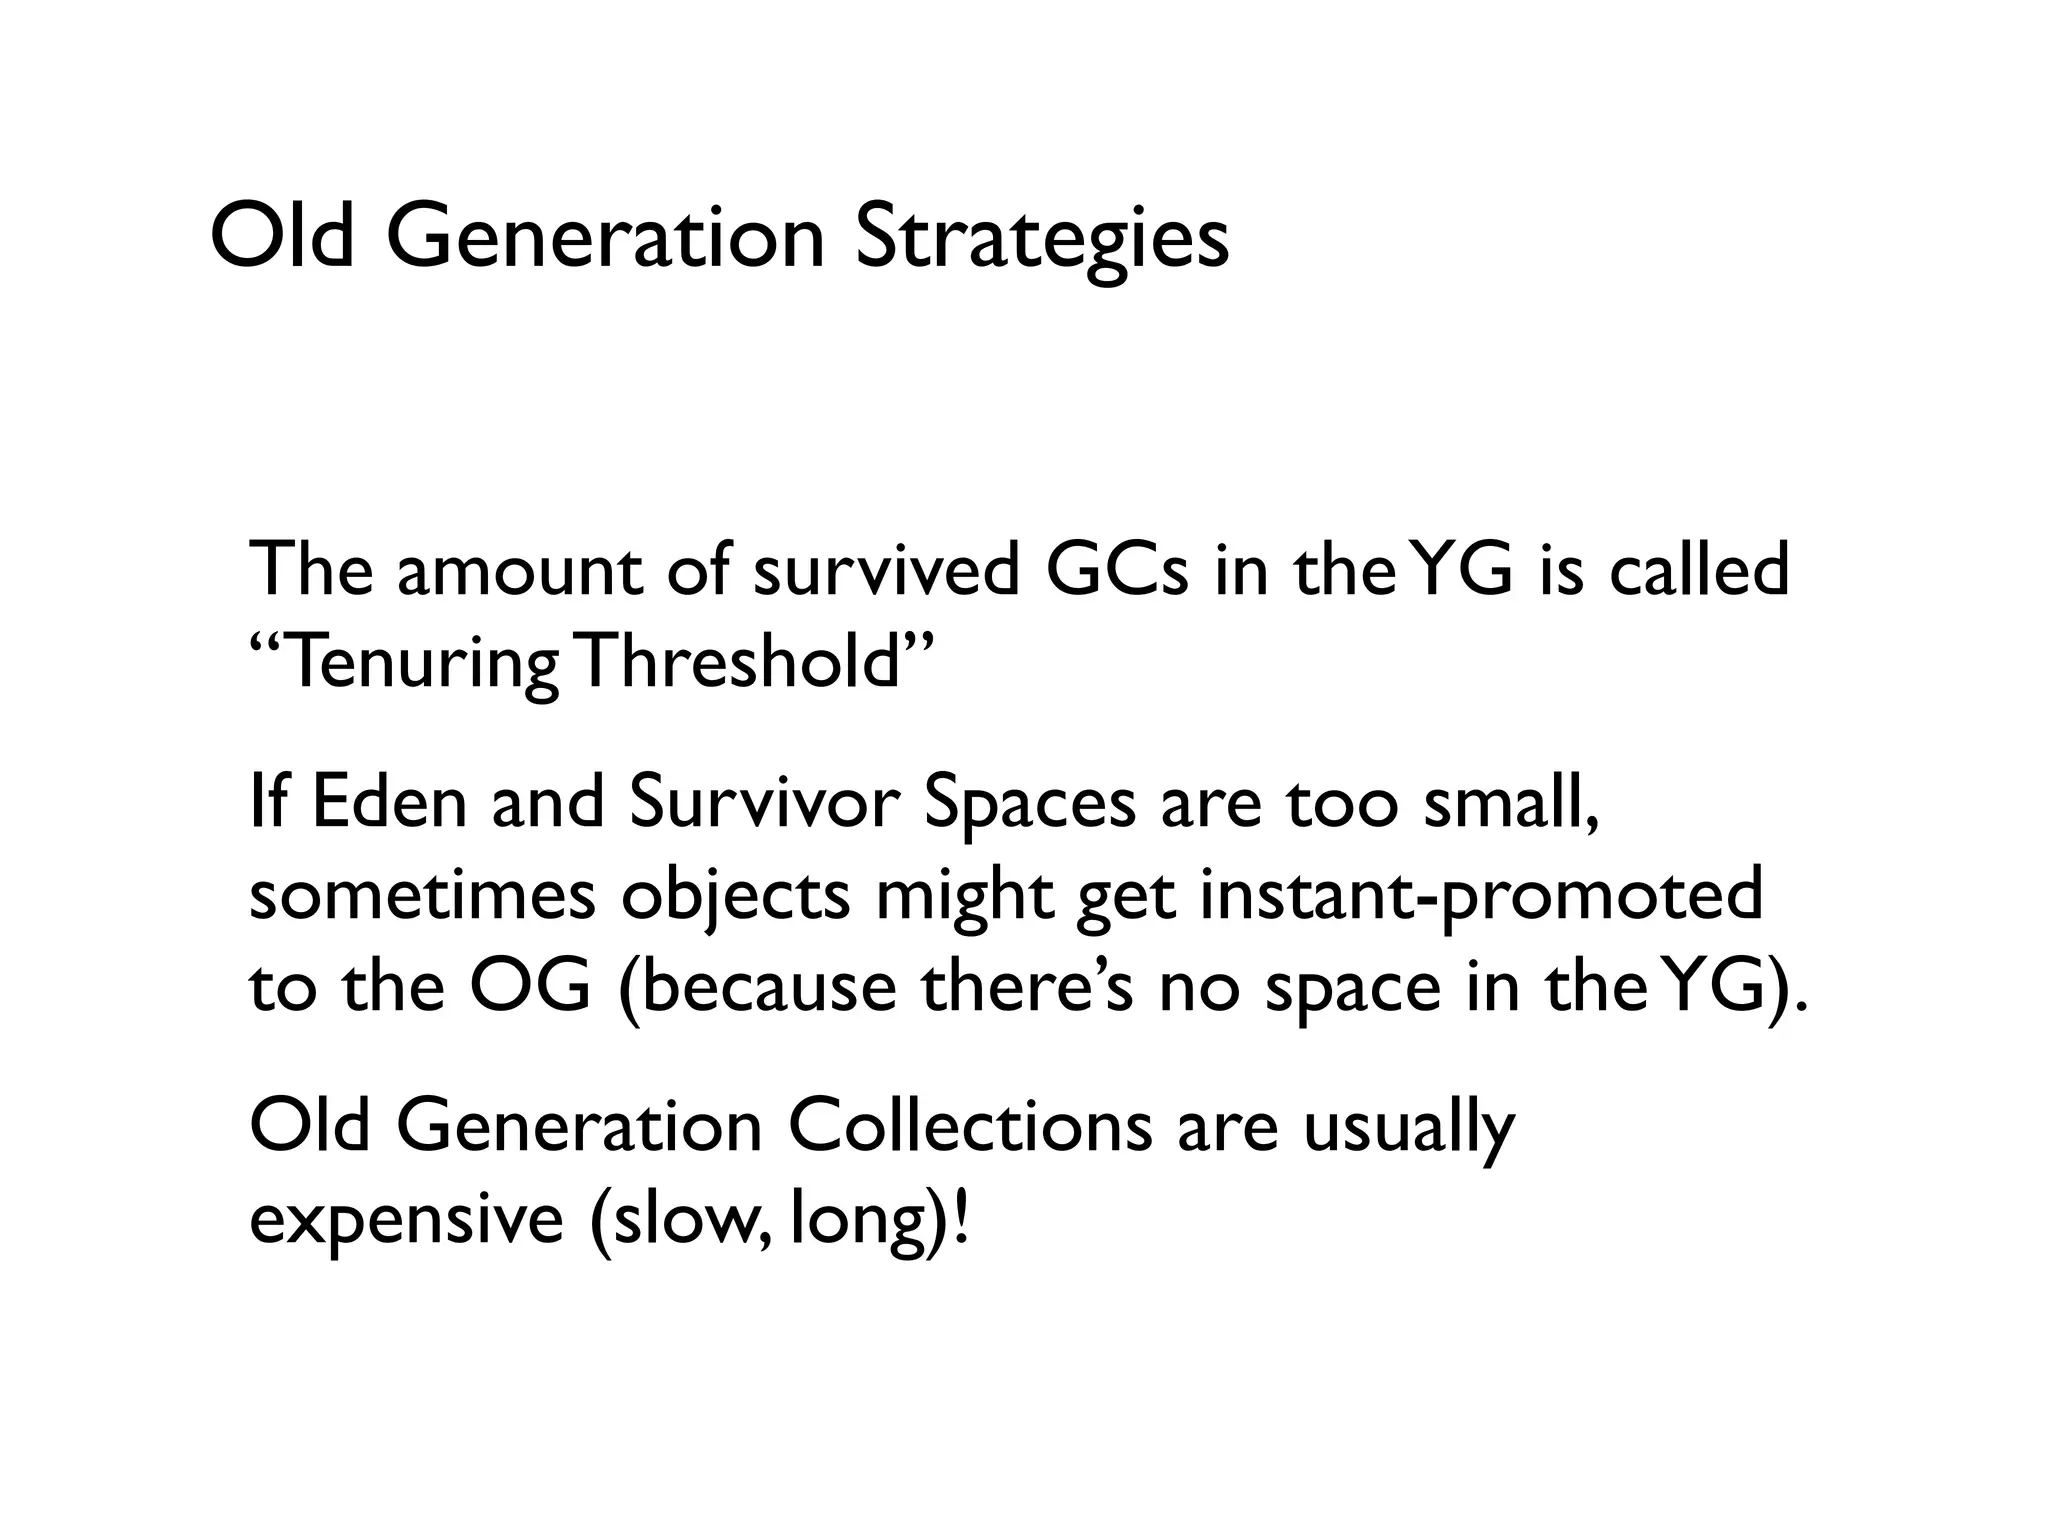
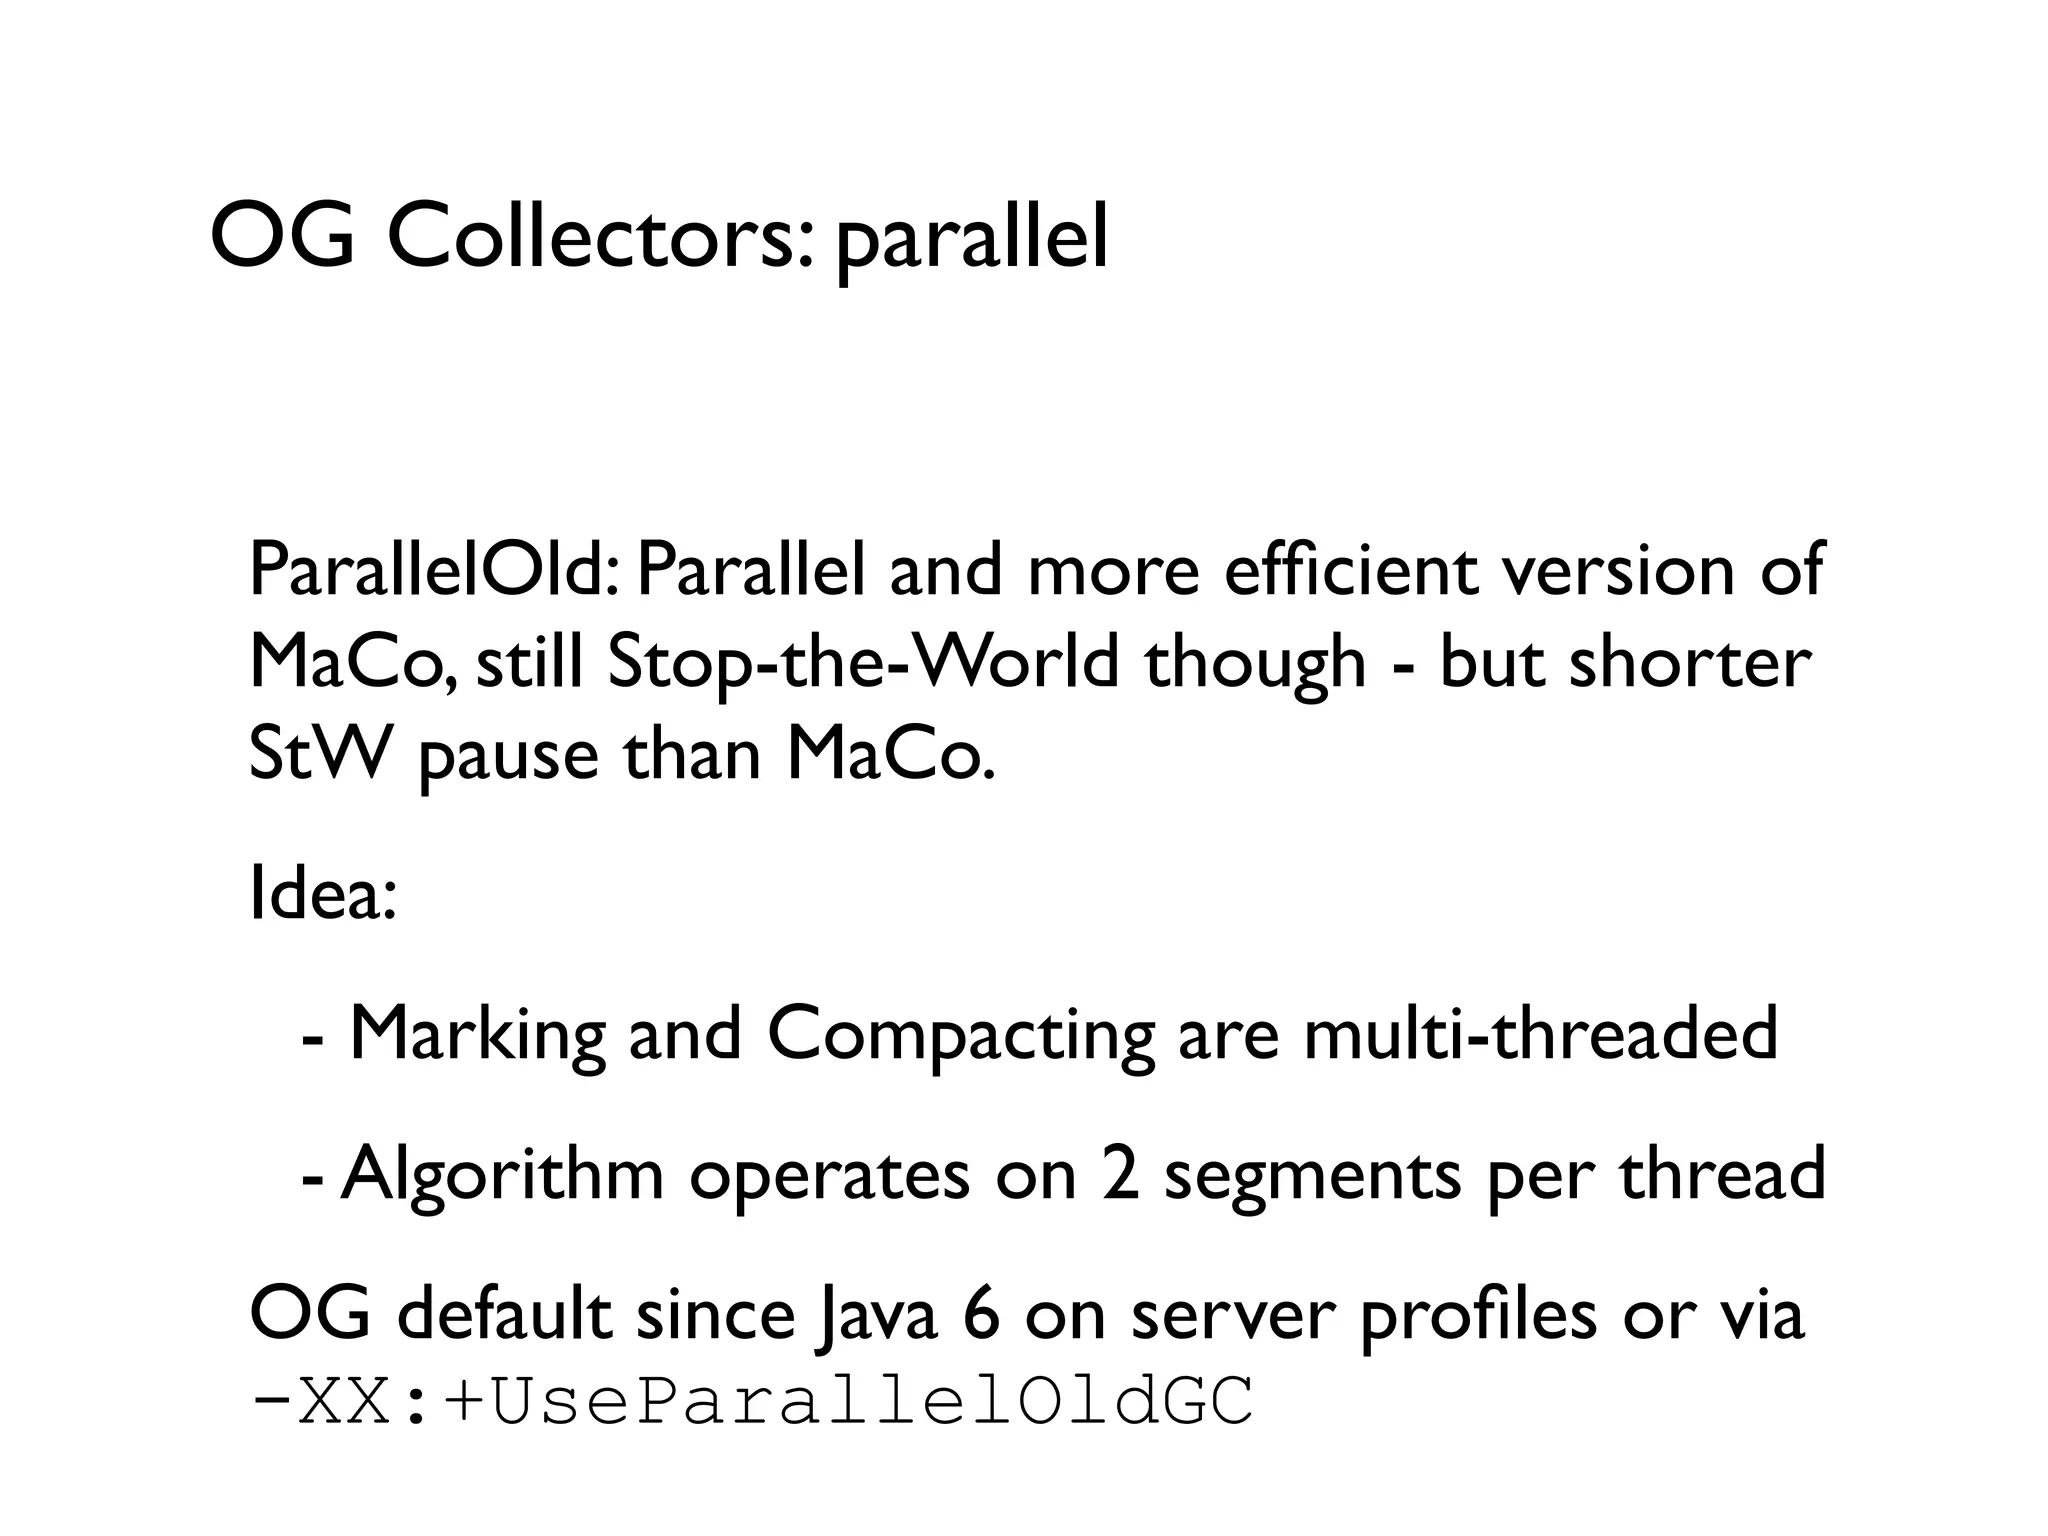
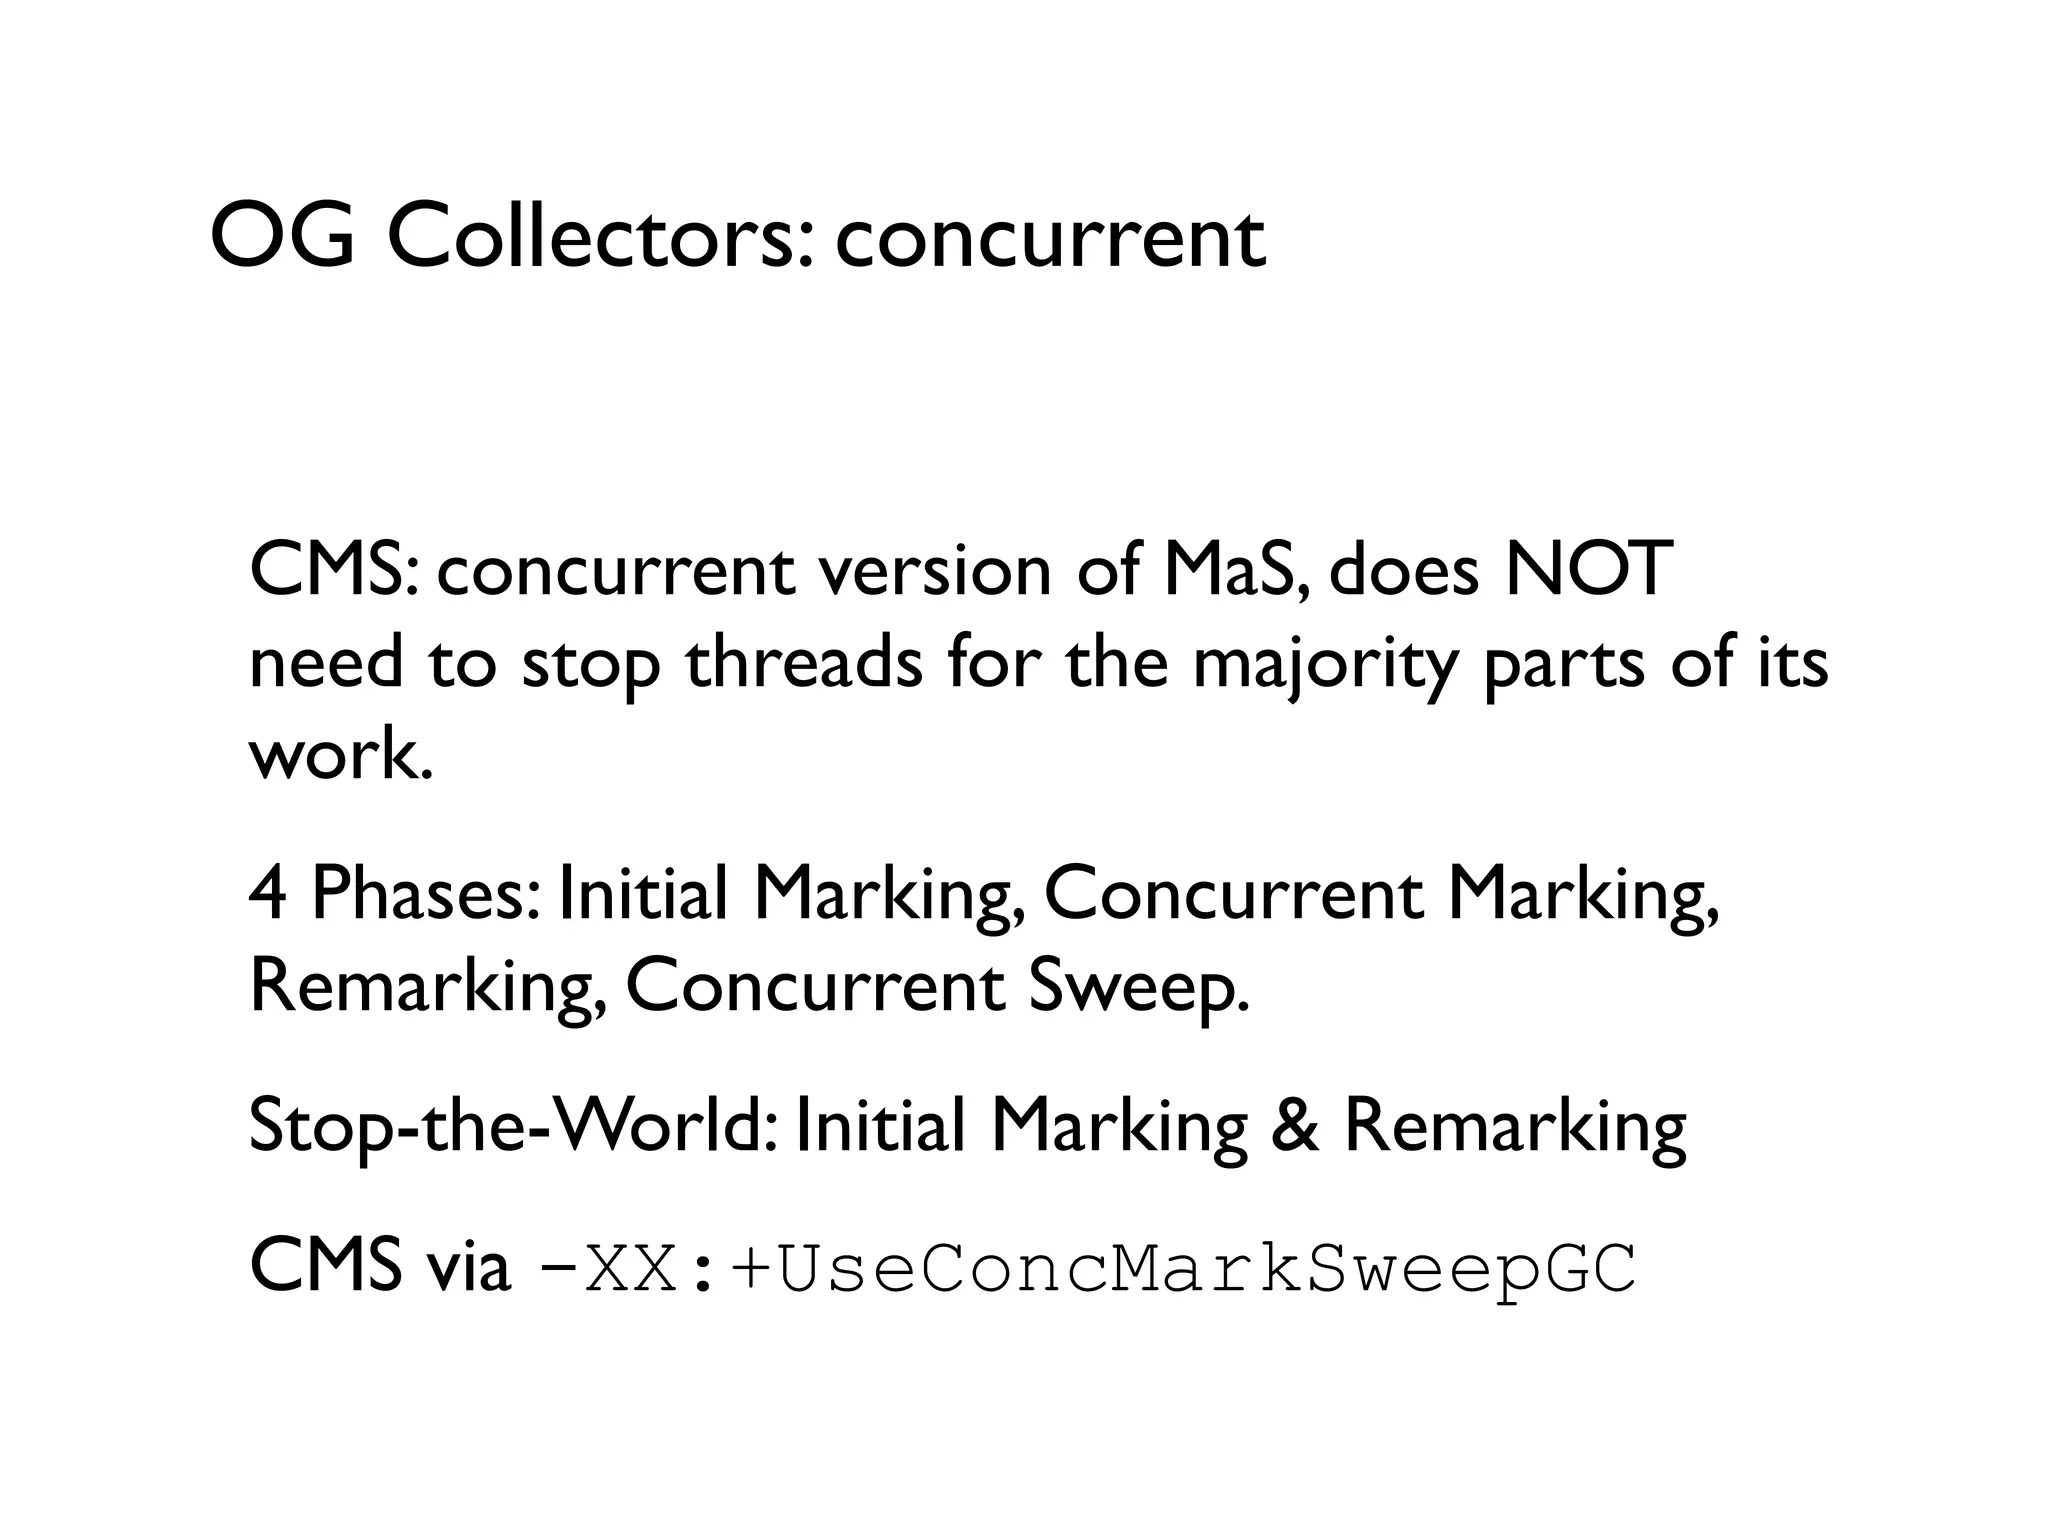
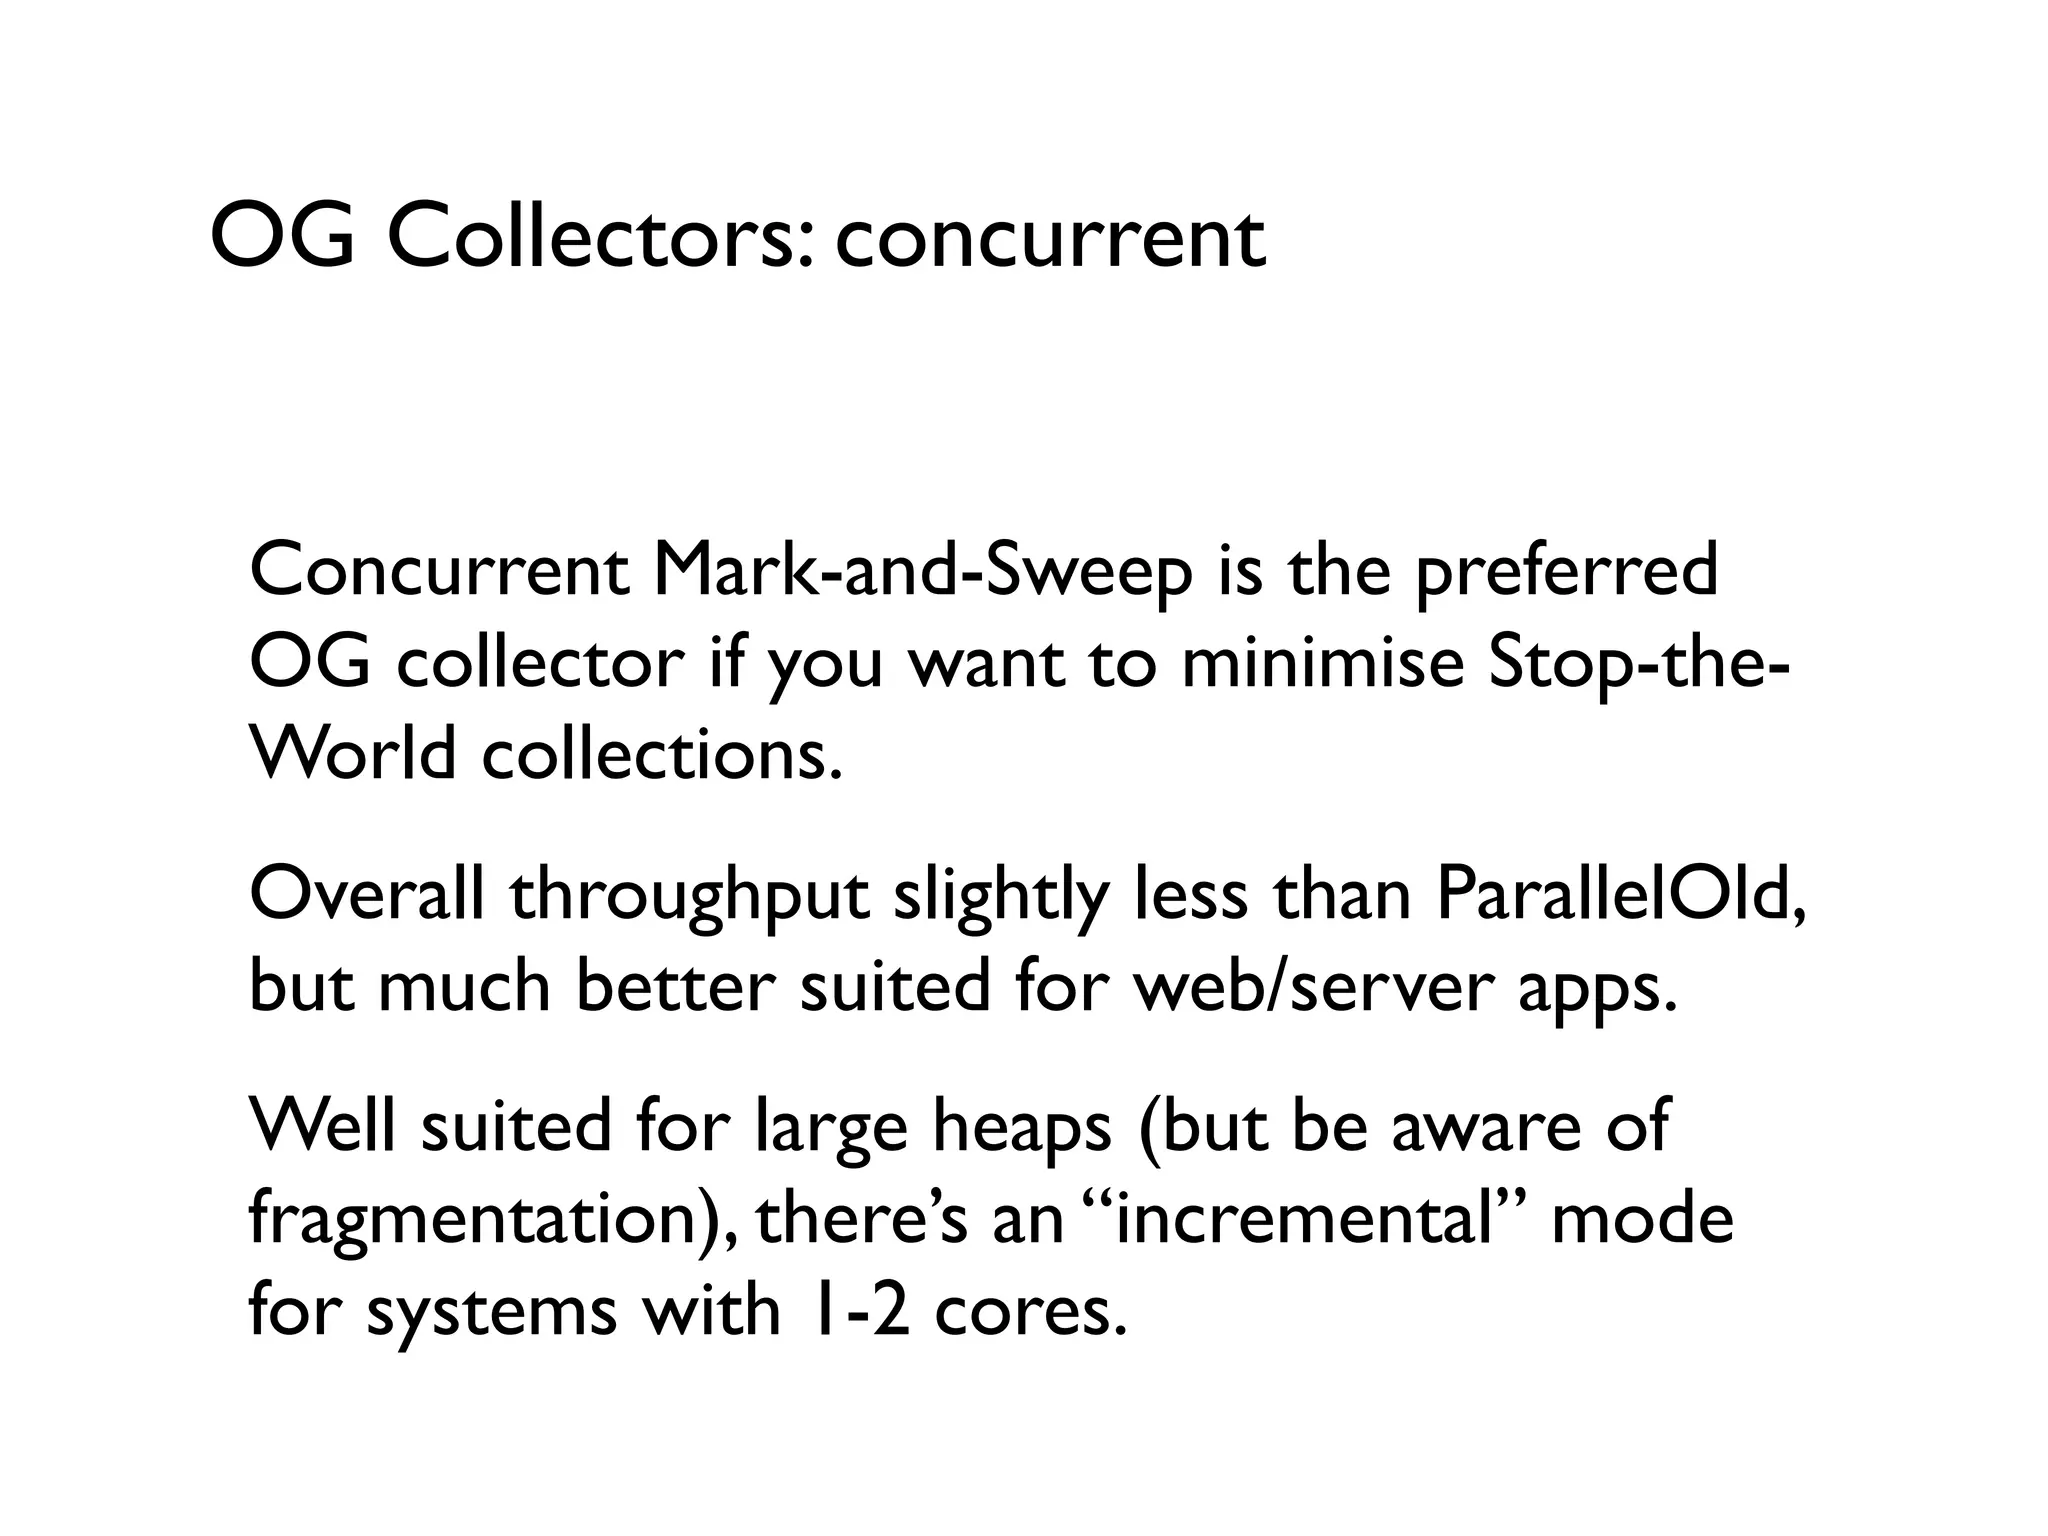
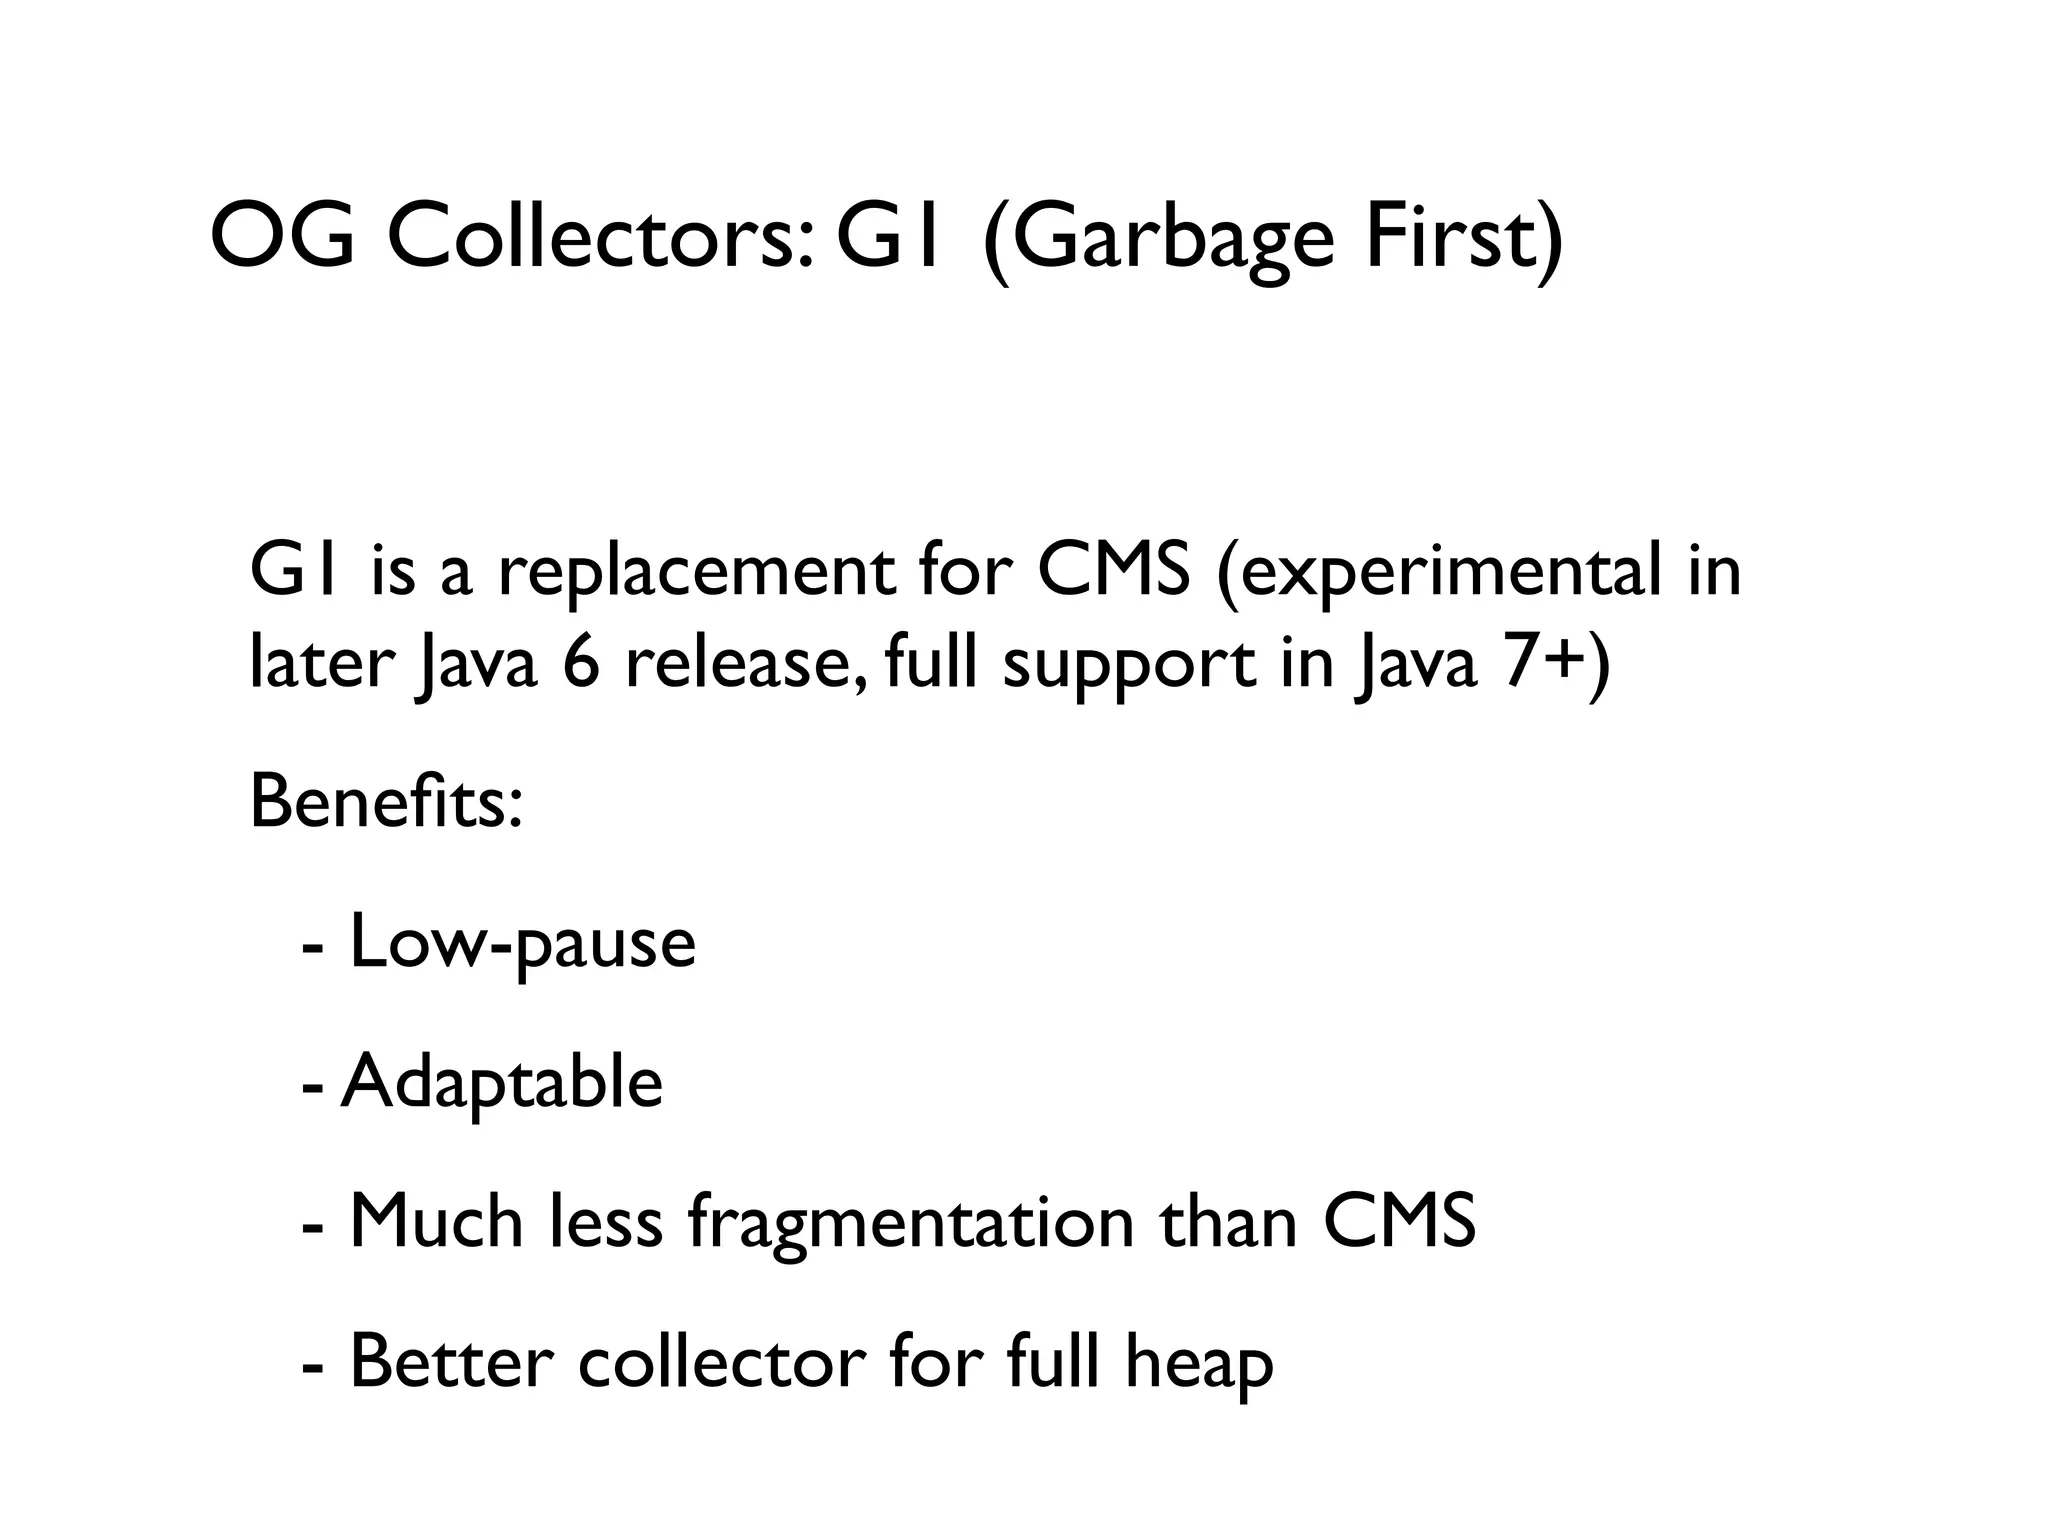
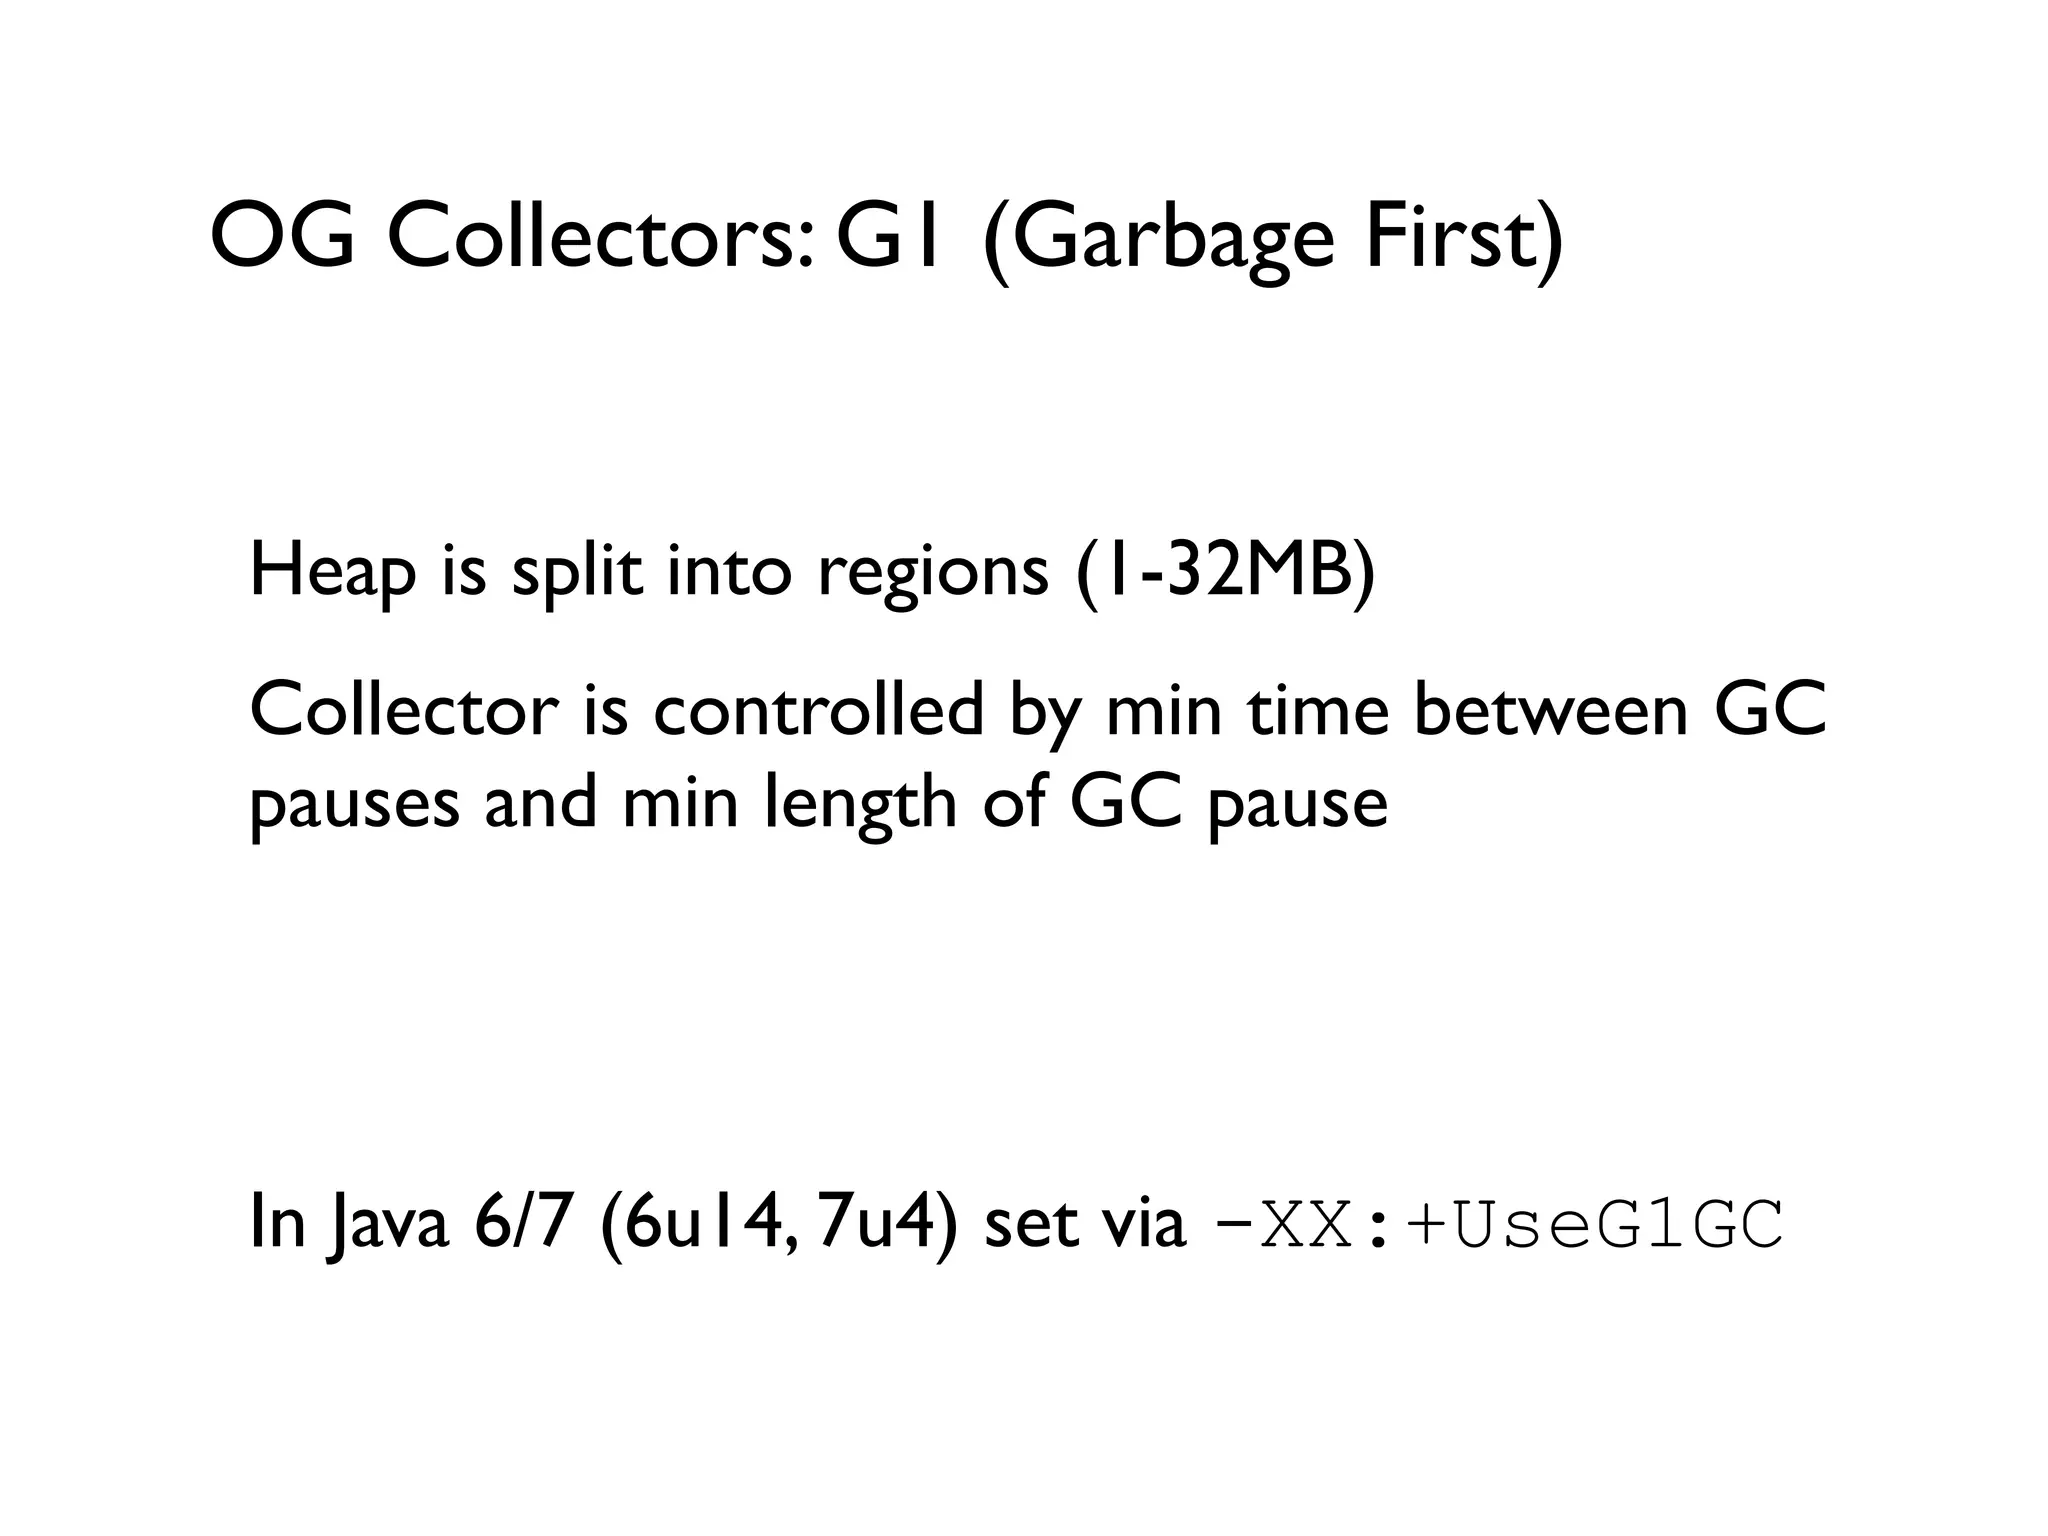
Old generation collector strategies including serial, parallel, concurrent collection, and G1 collector.
Principles of JVM tuning, emphasizing that optimal settings depend on specific application needs.
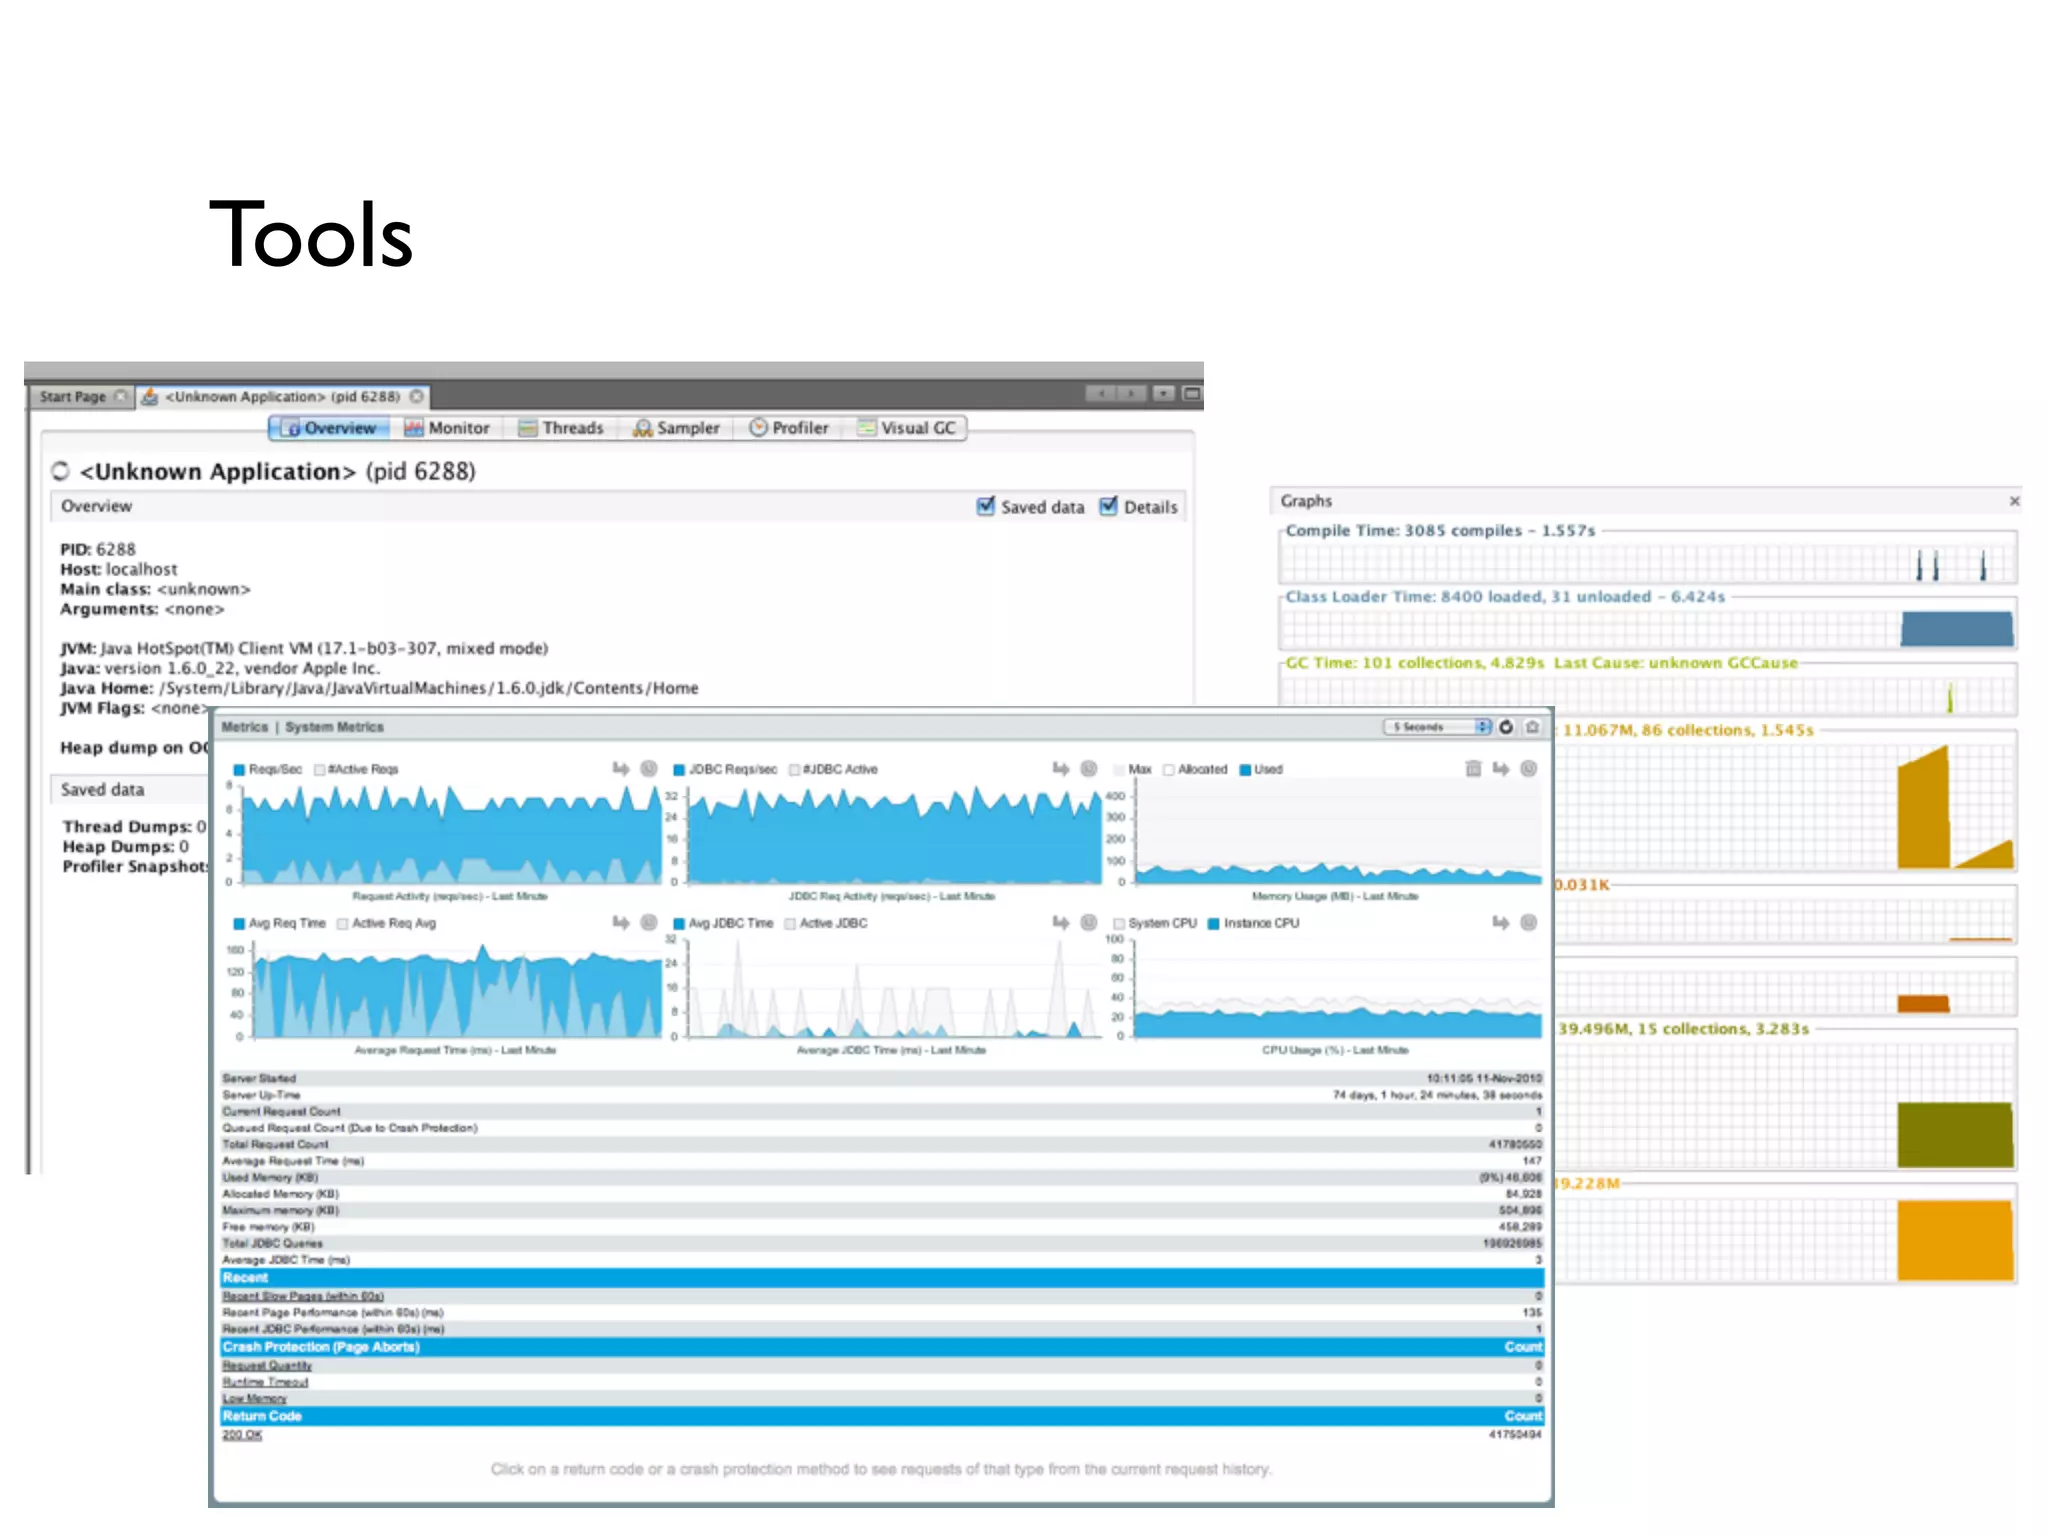
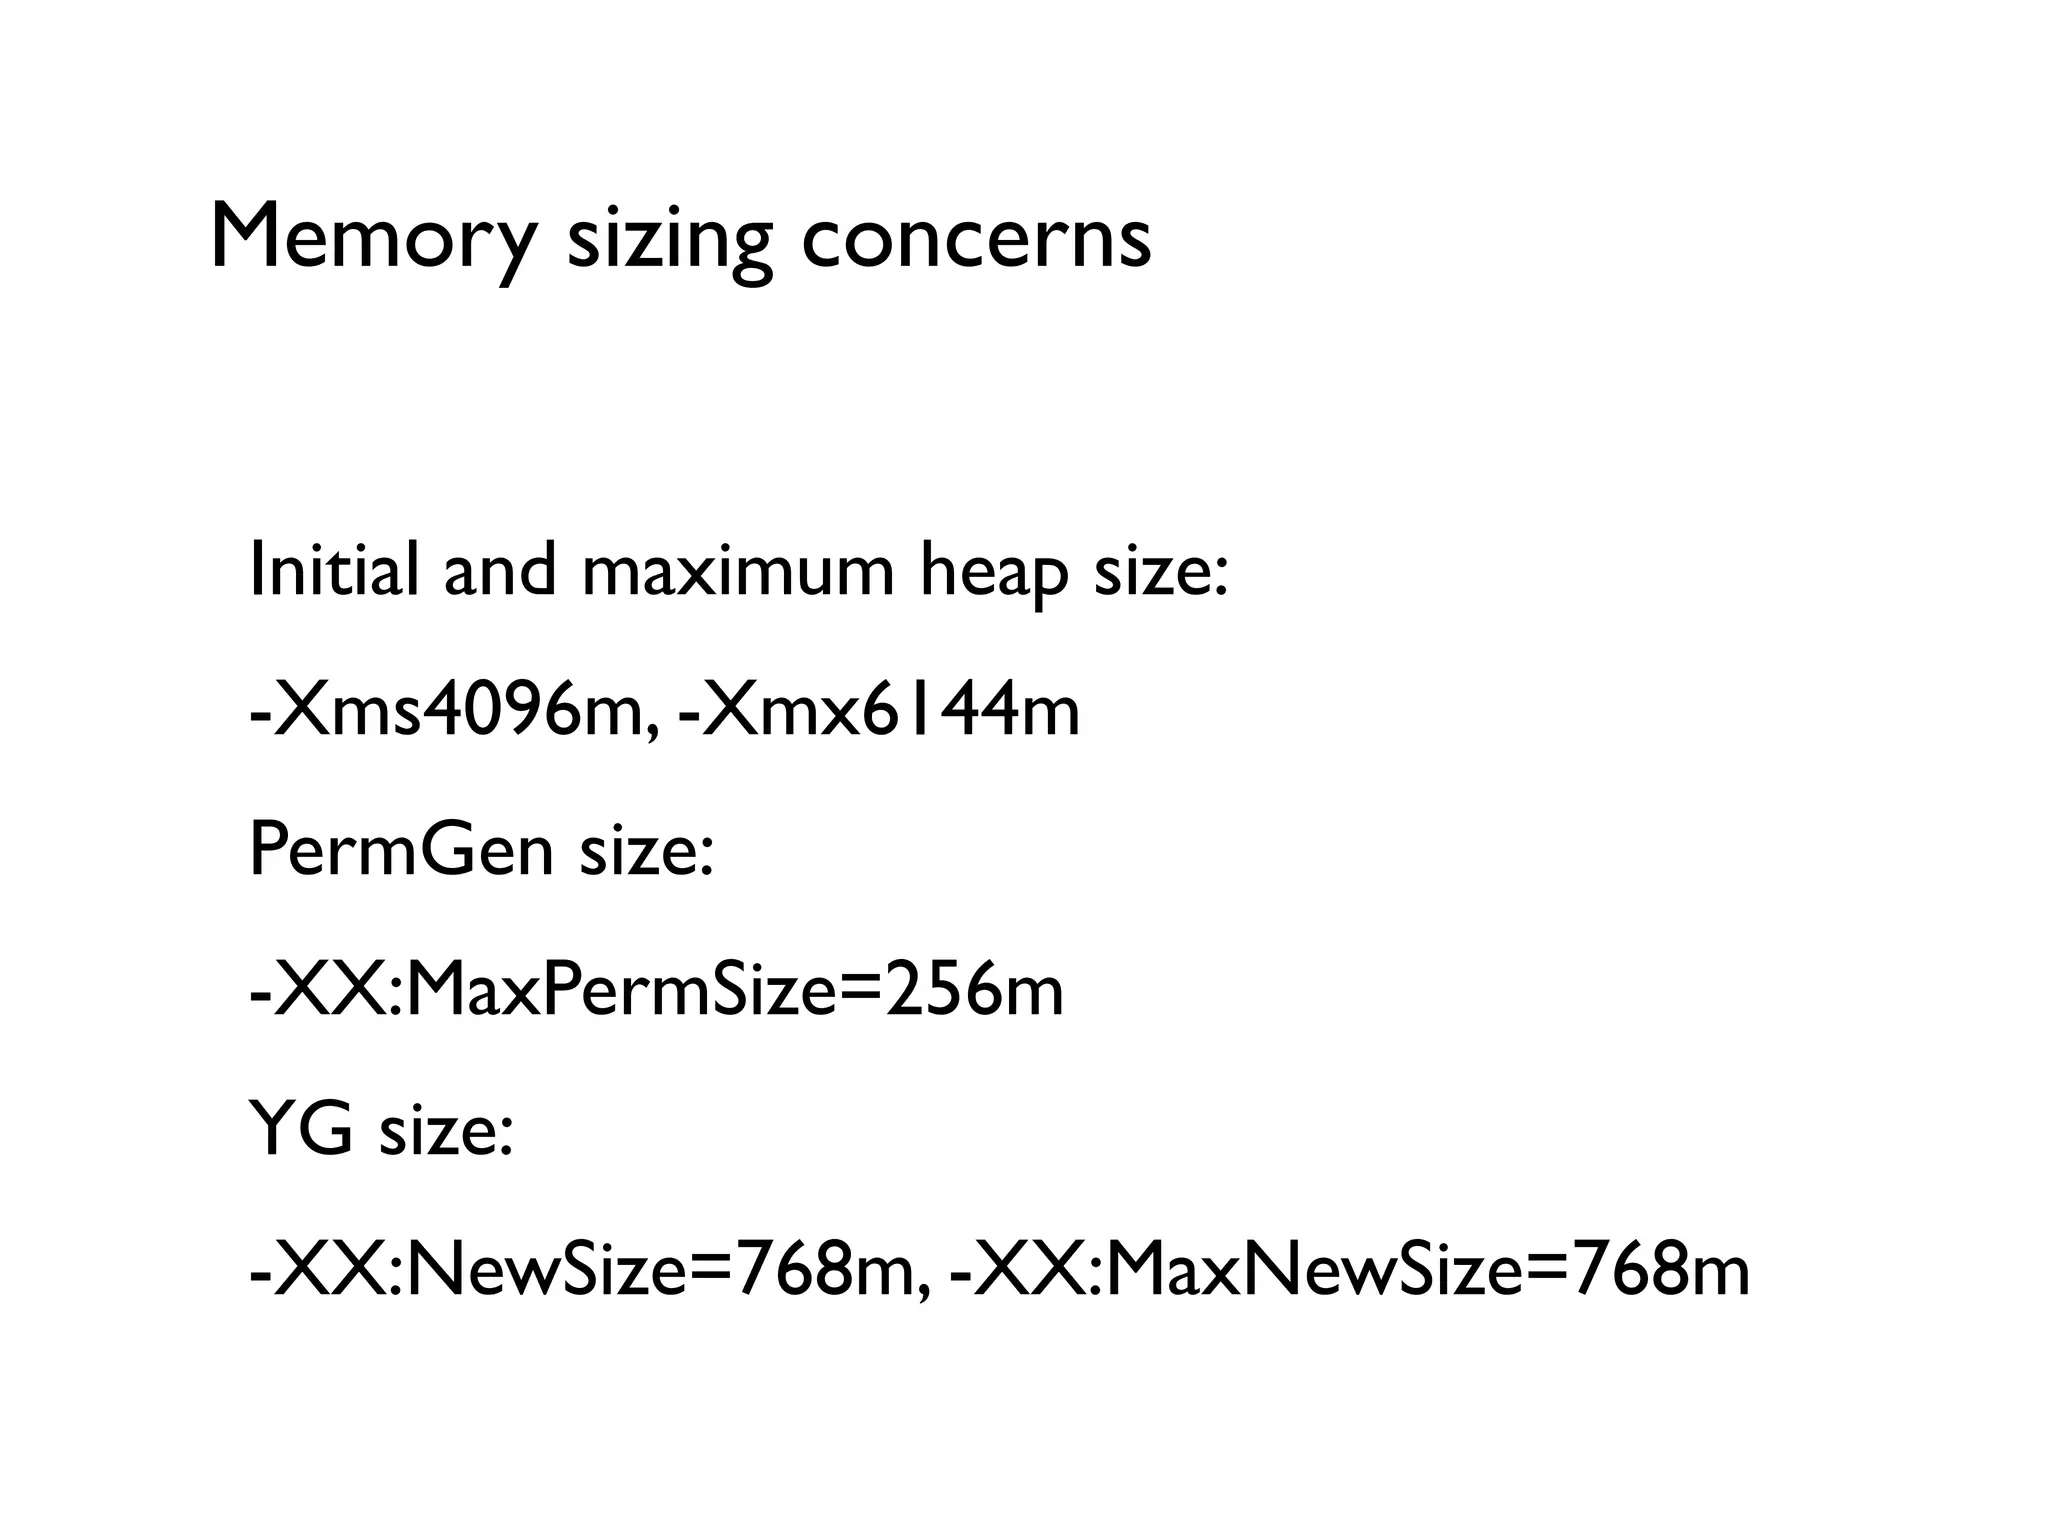
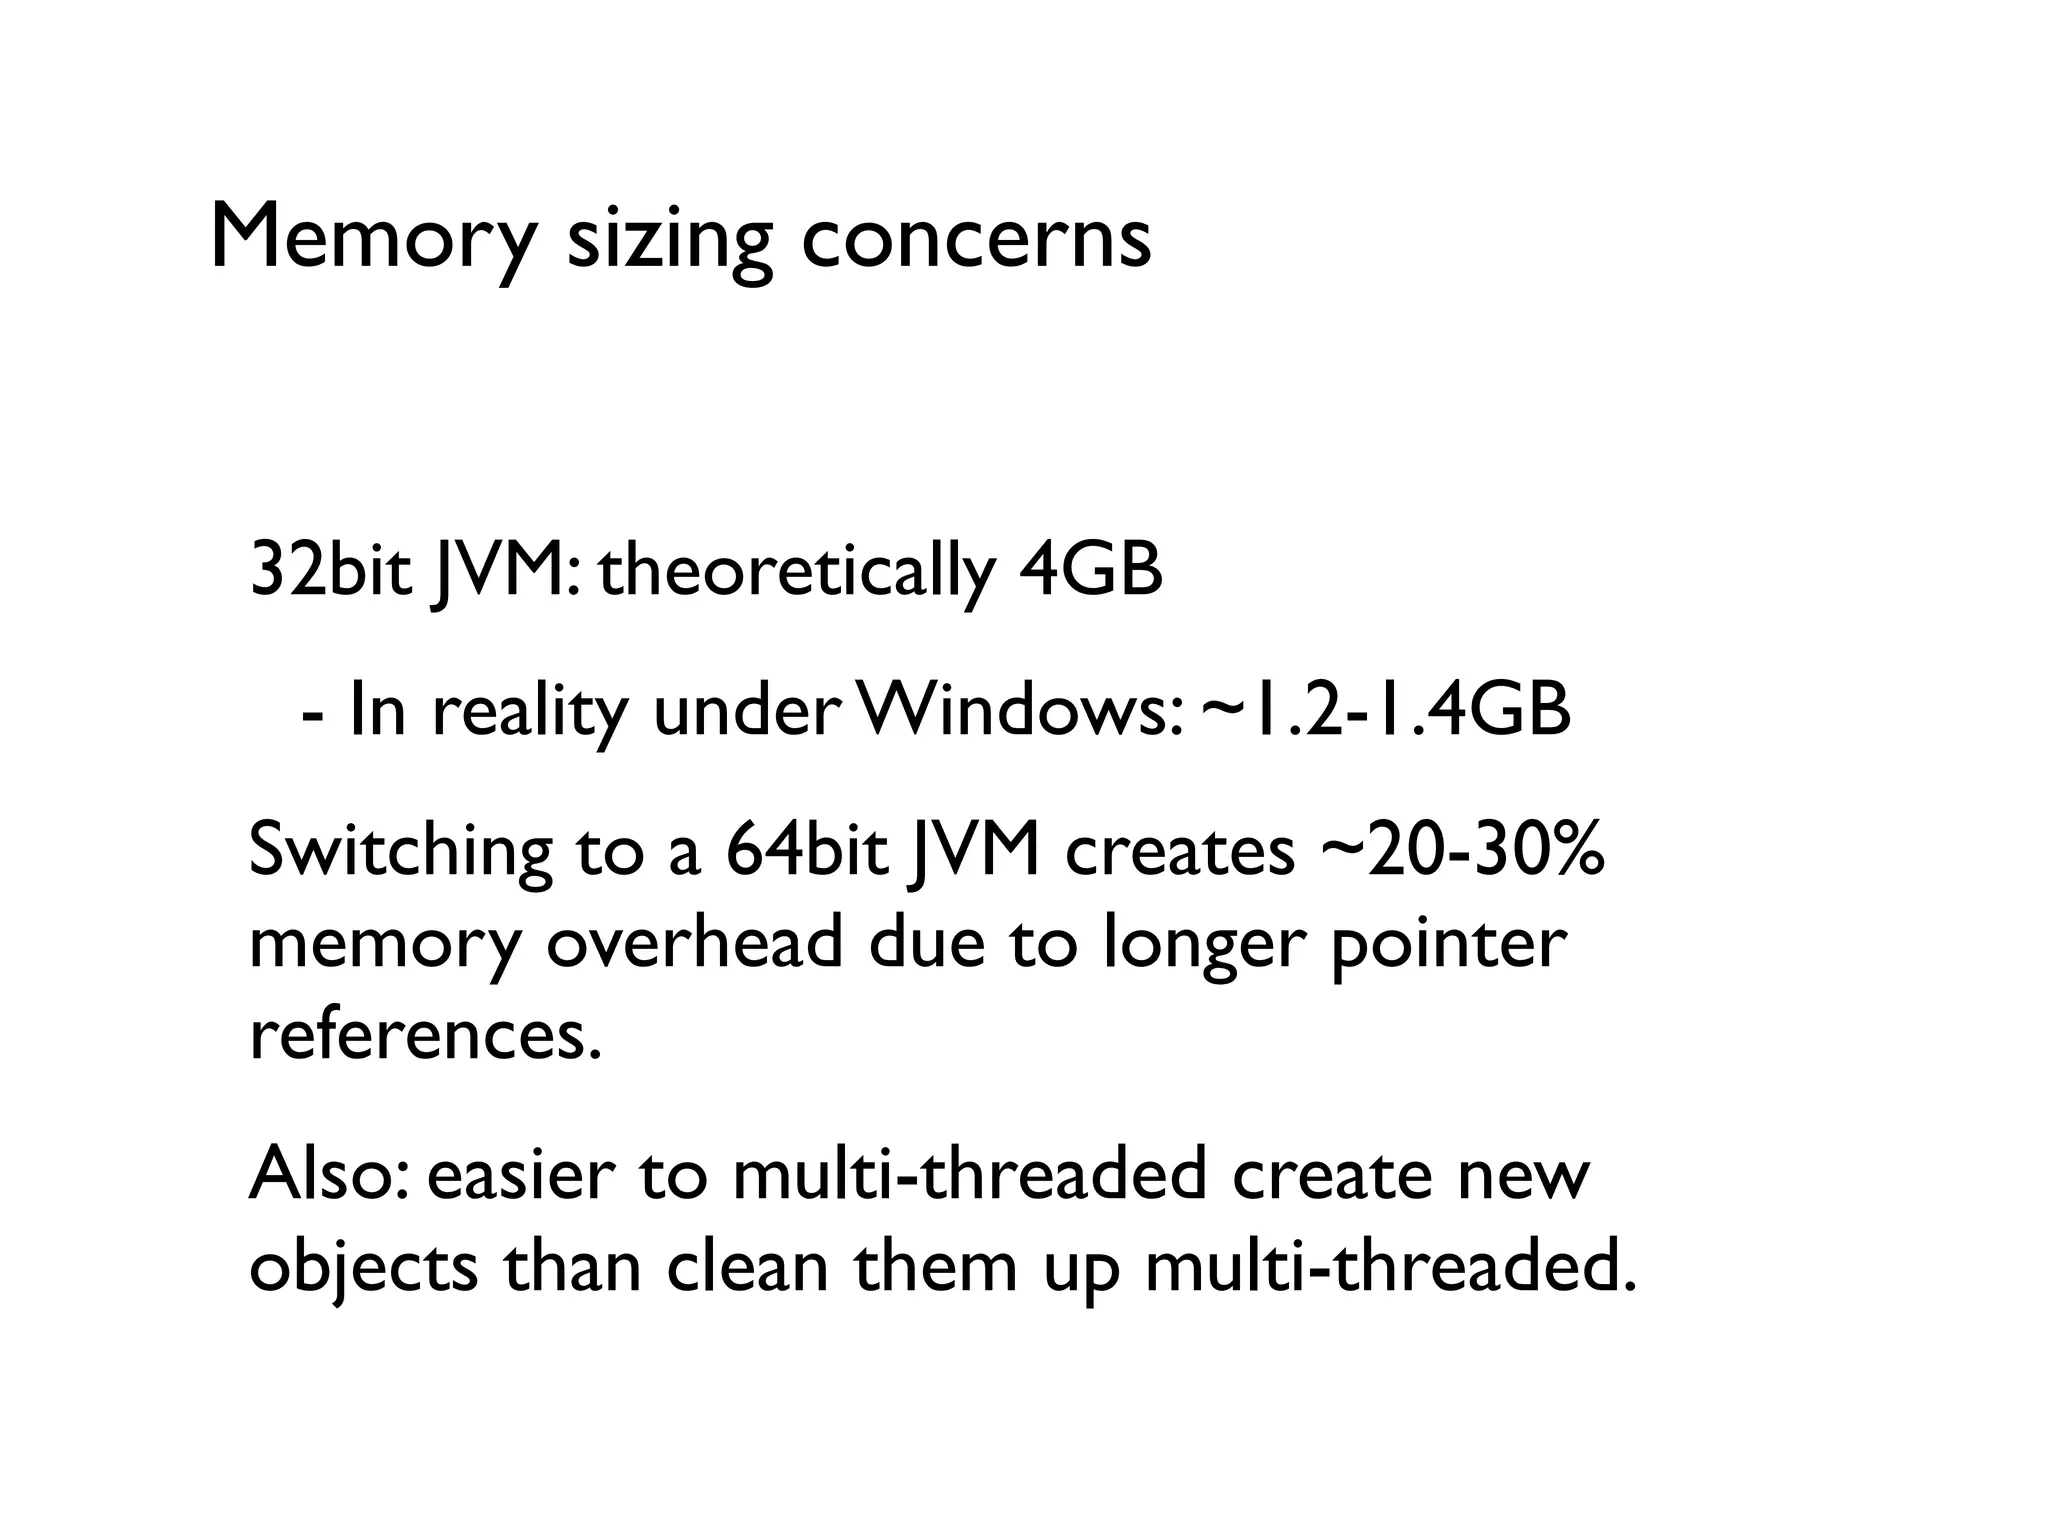
Steps for the tuning process, monitoring tools, and critical memory settings for effective performance.
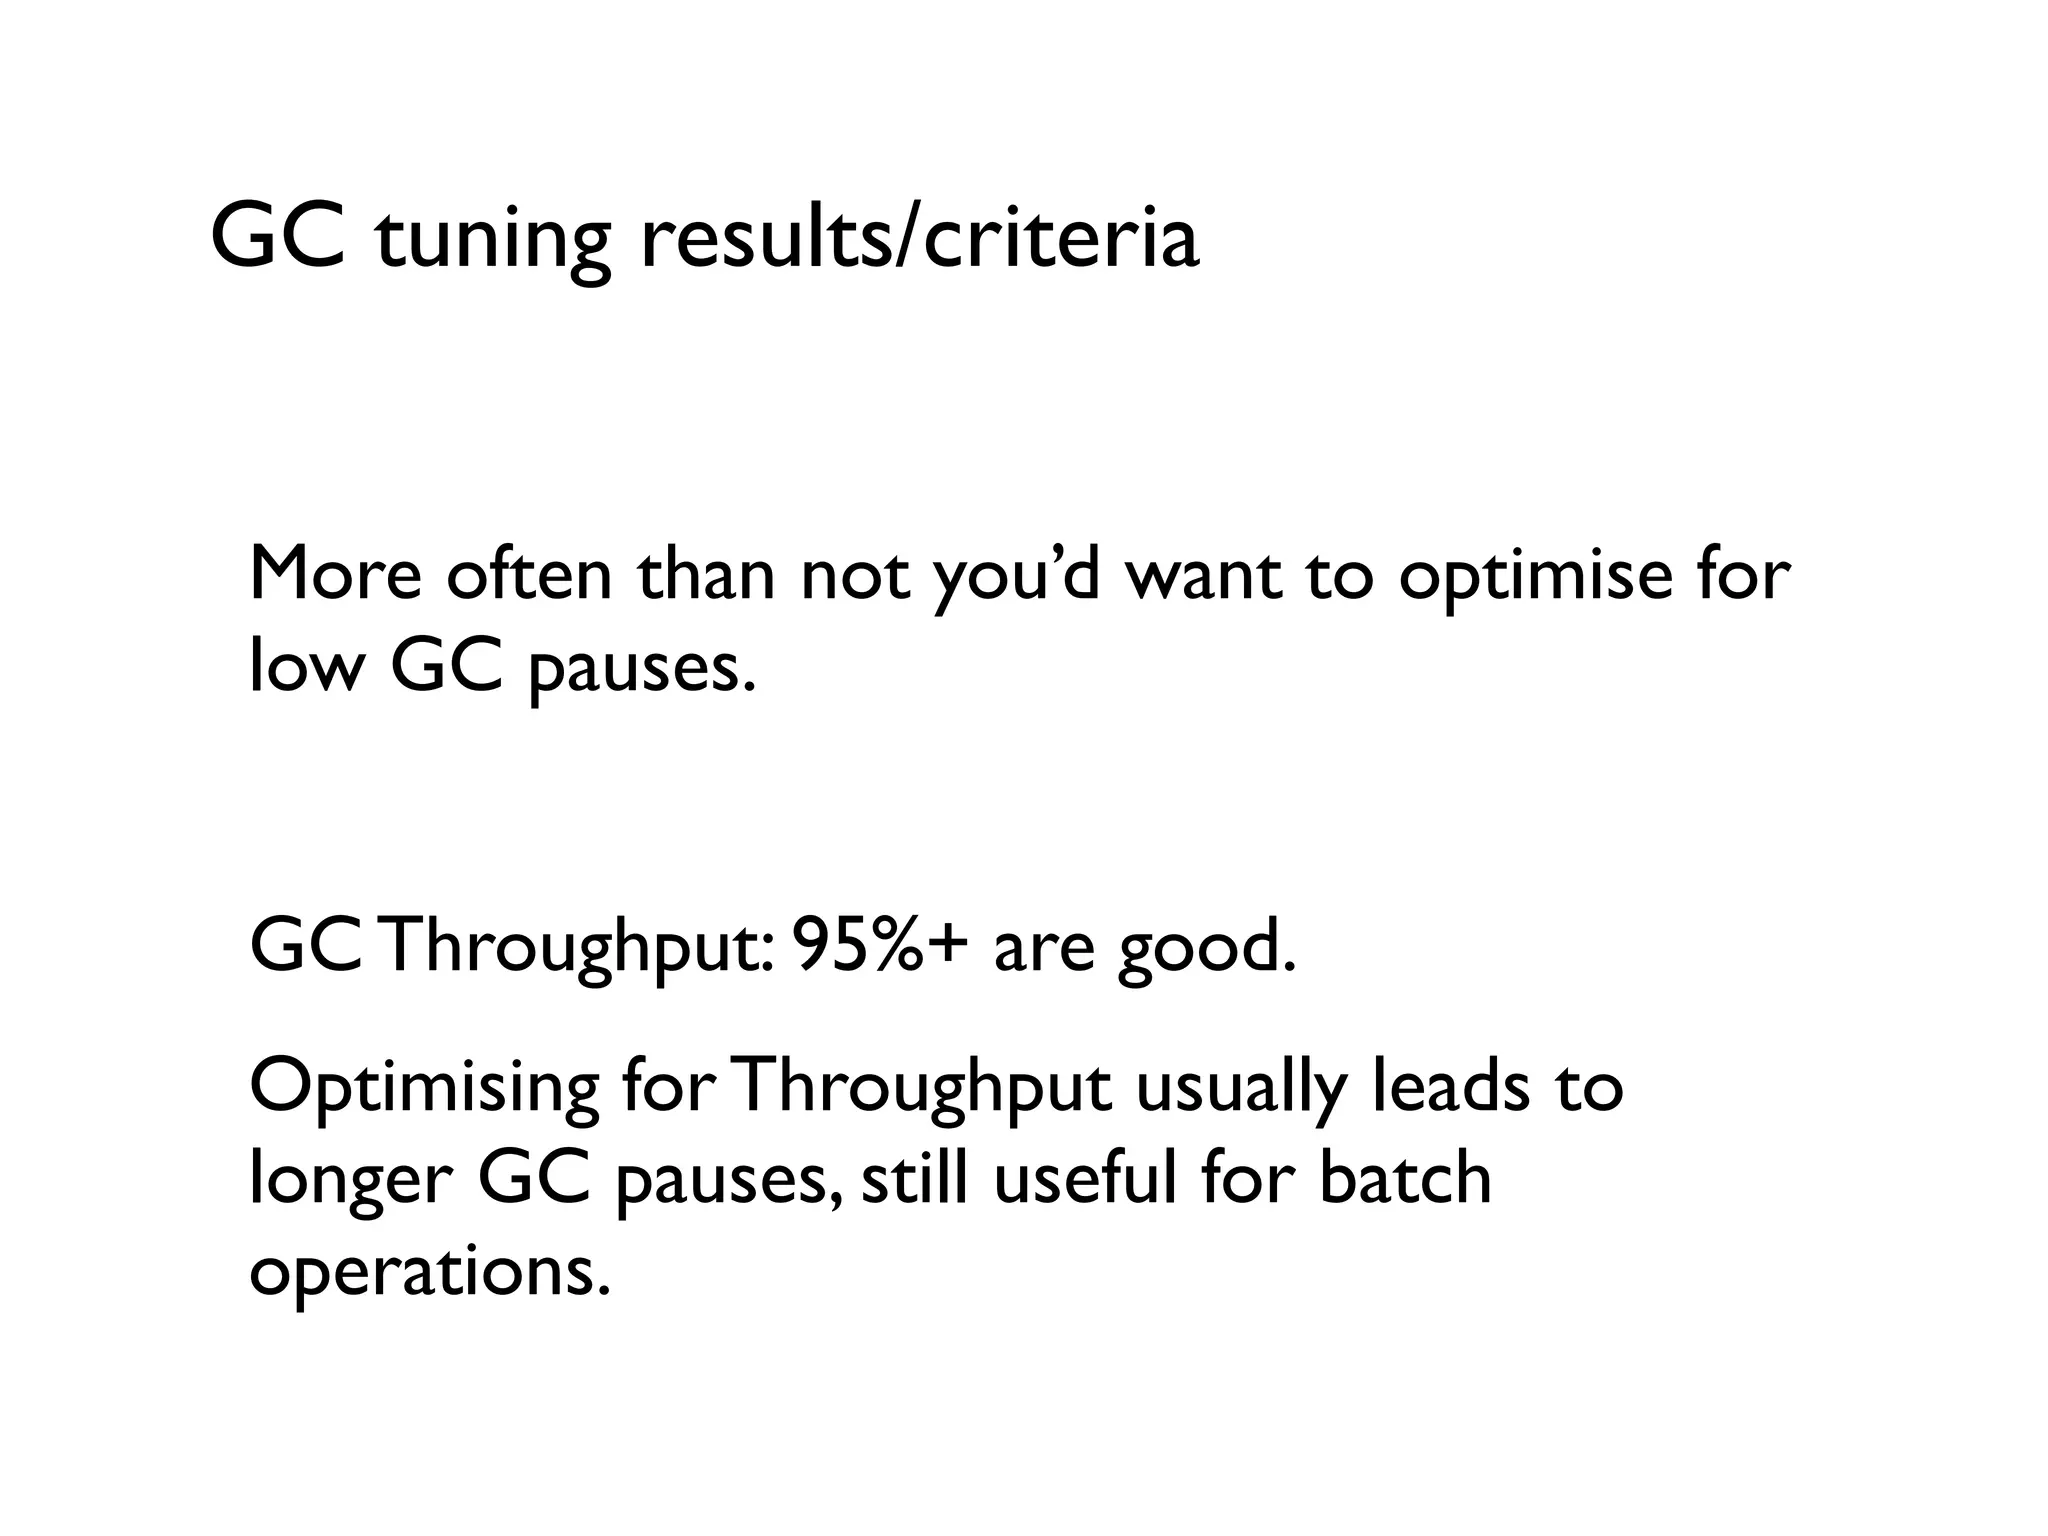
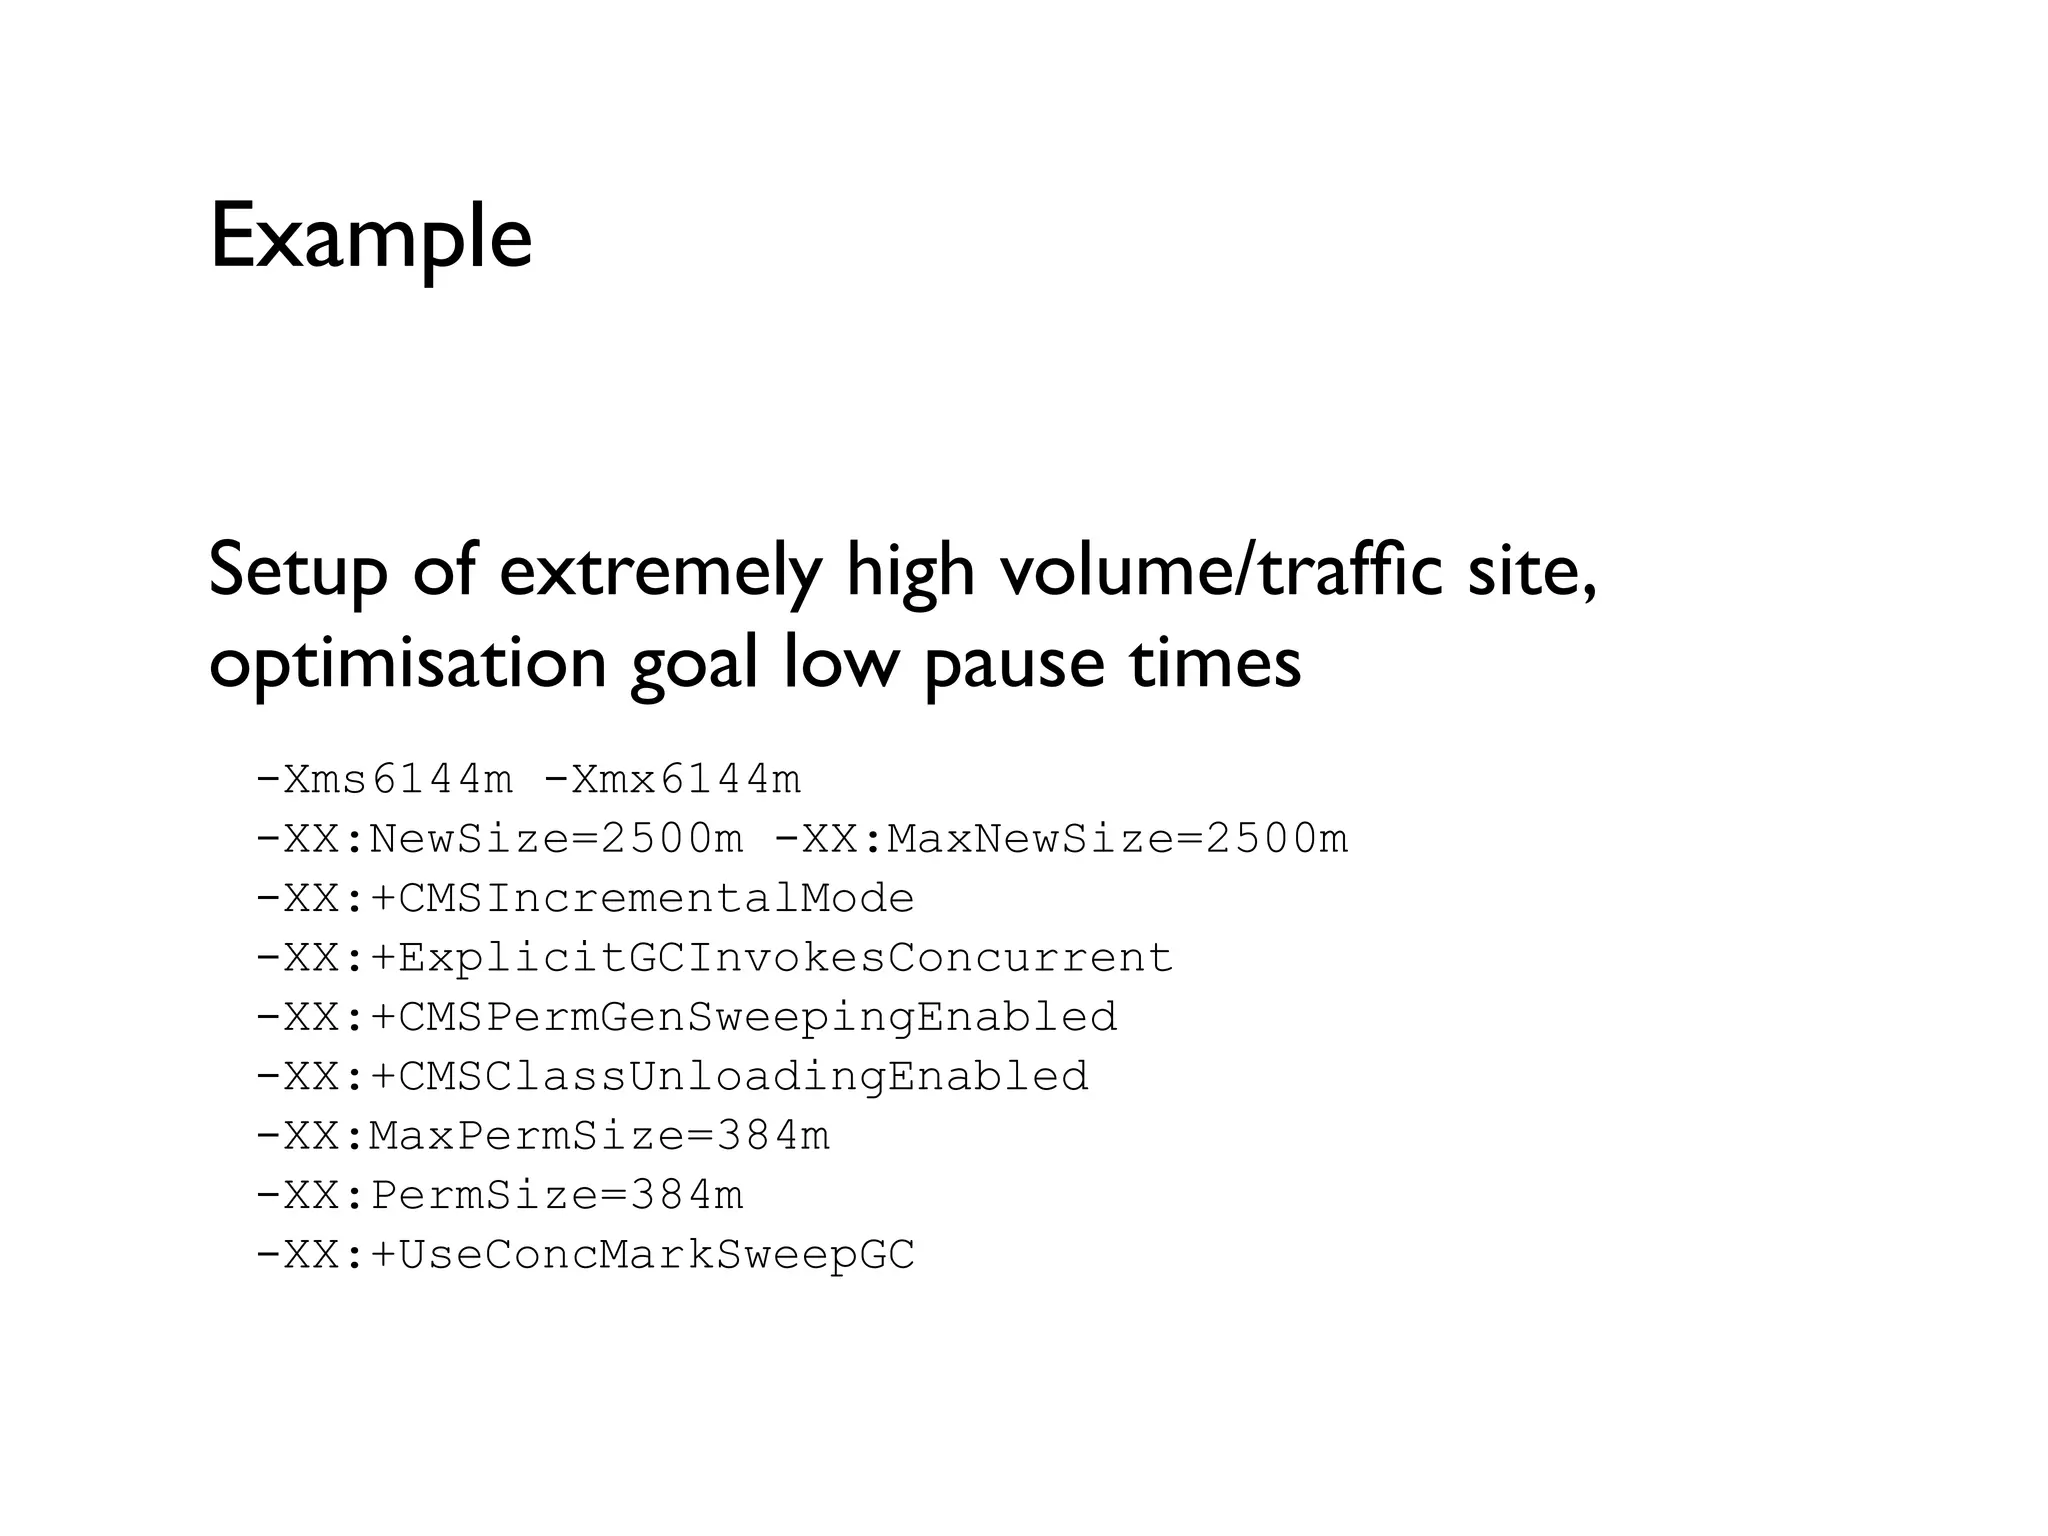
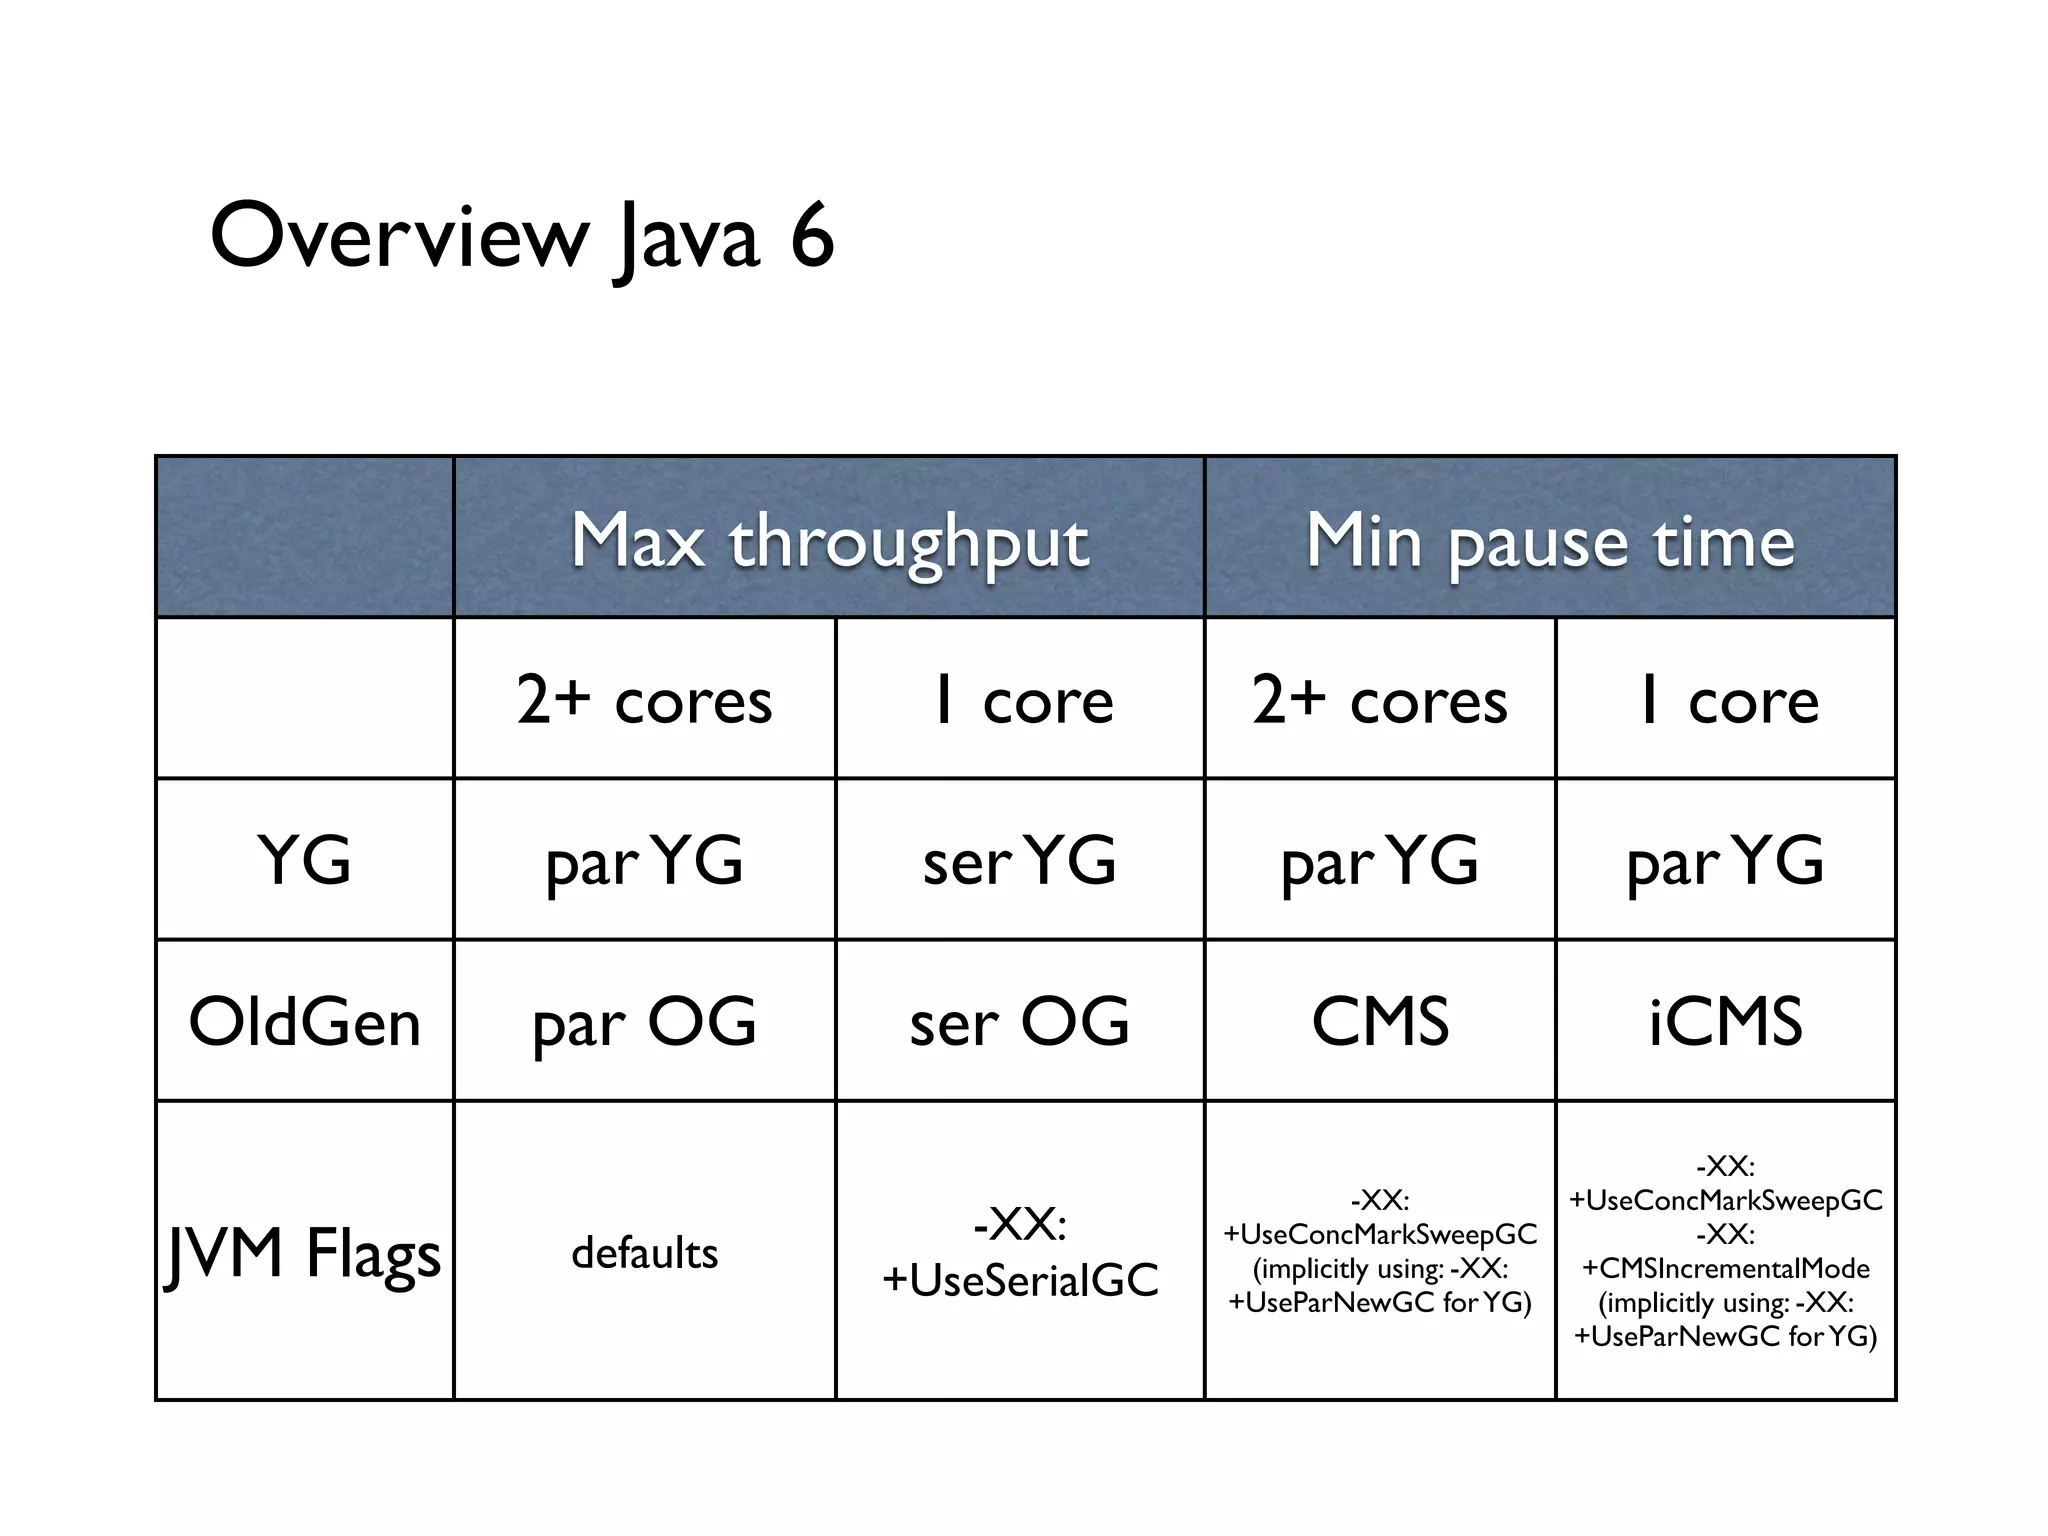
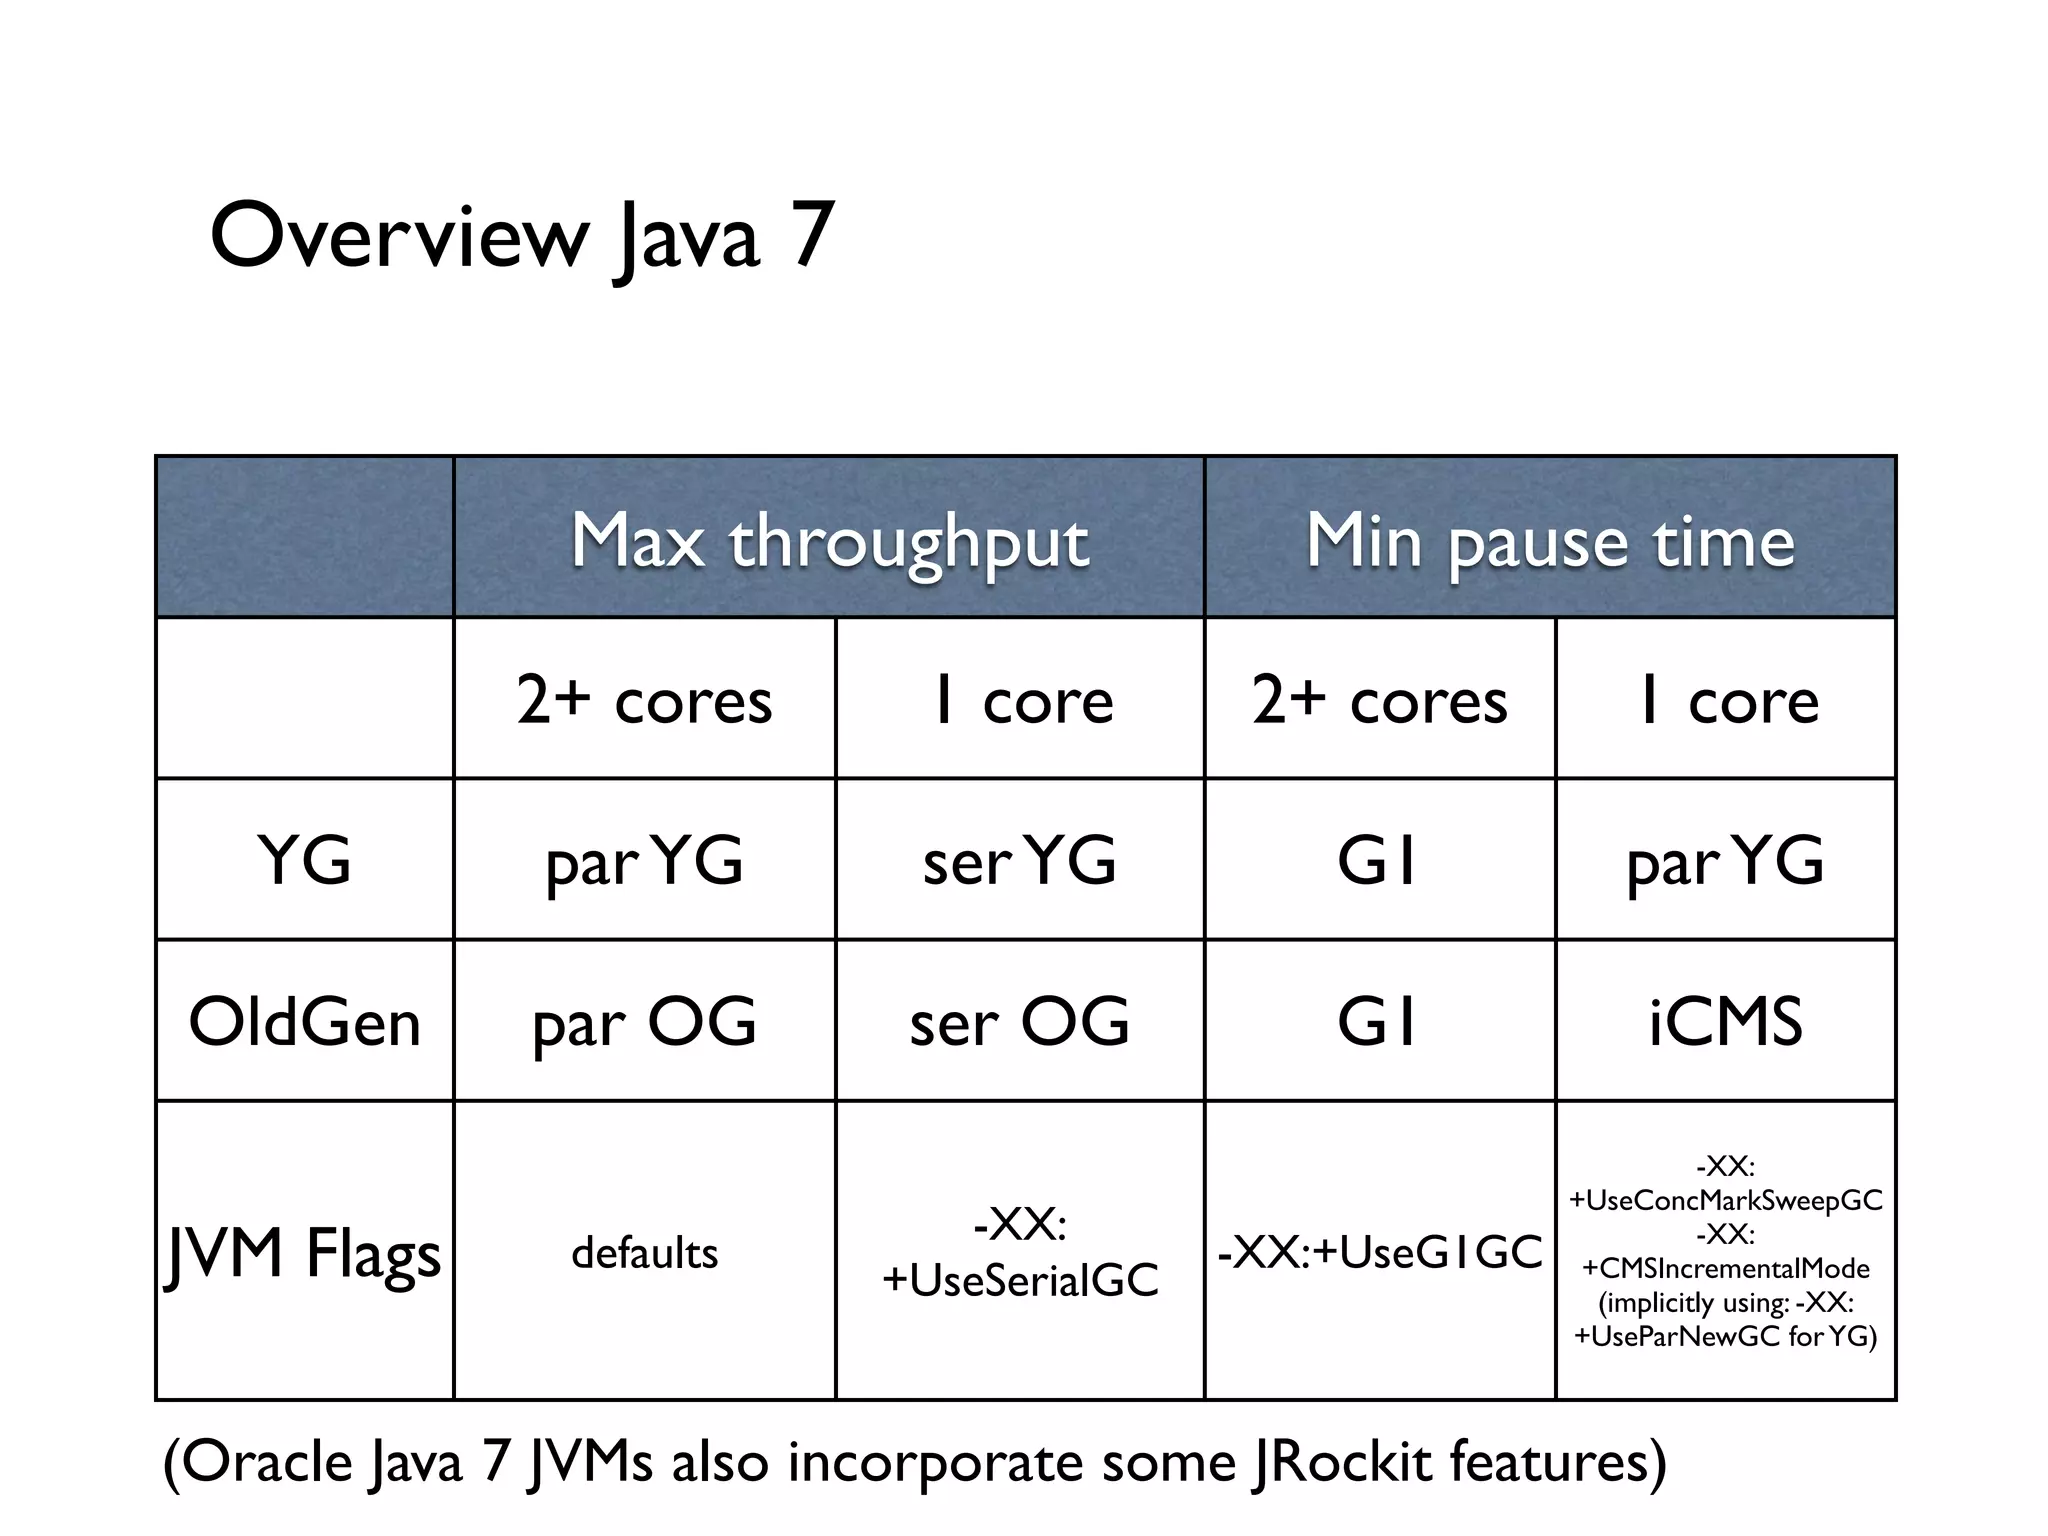
Examples of tuning for high-volume sites, focusing on low pause times and variations across Java versions.
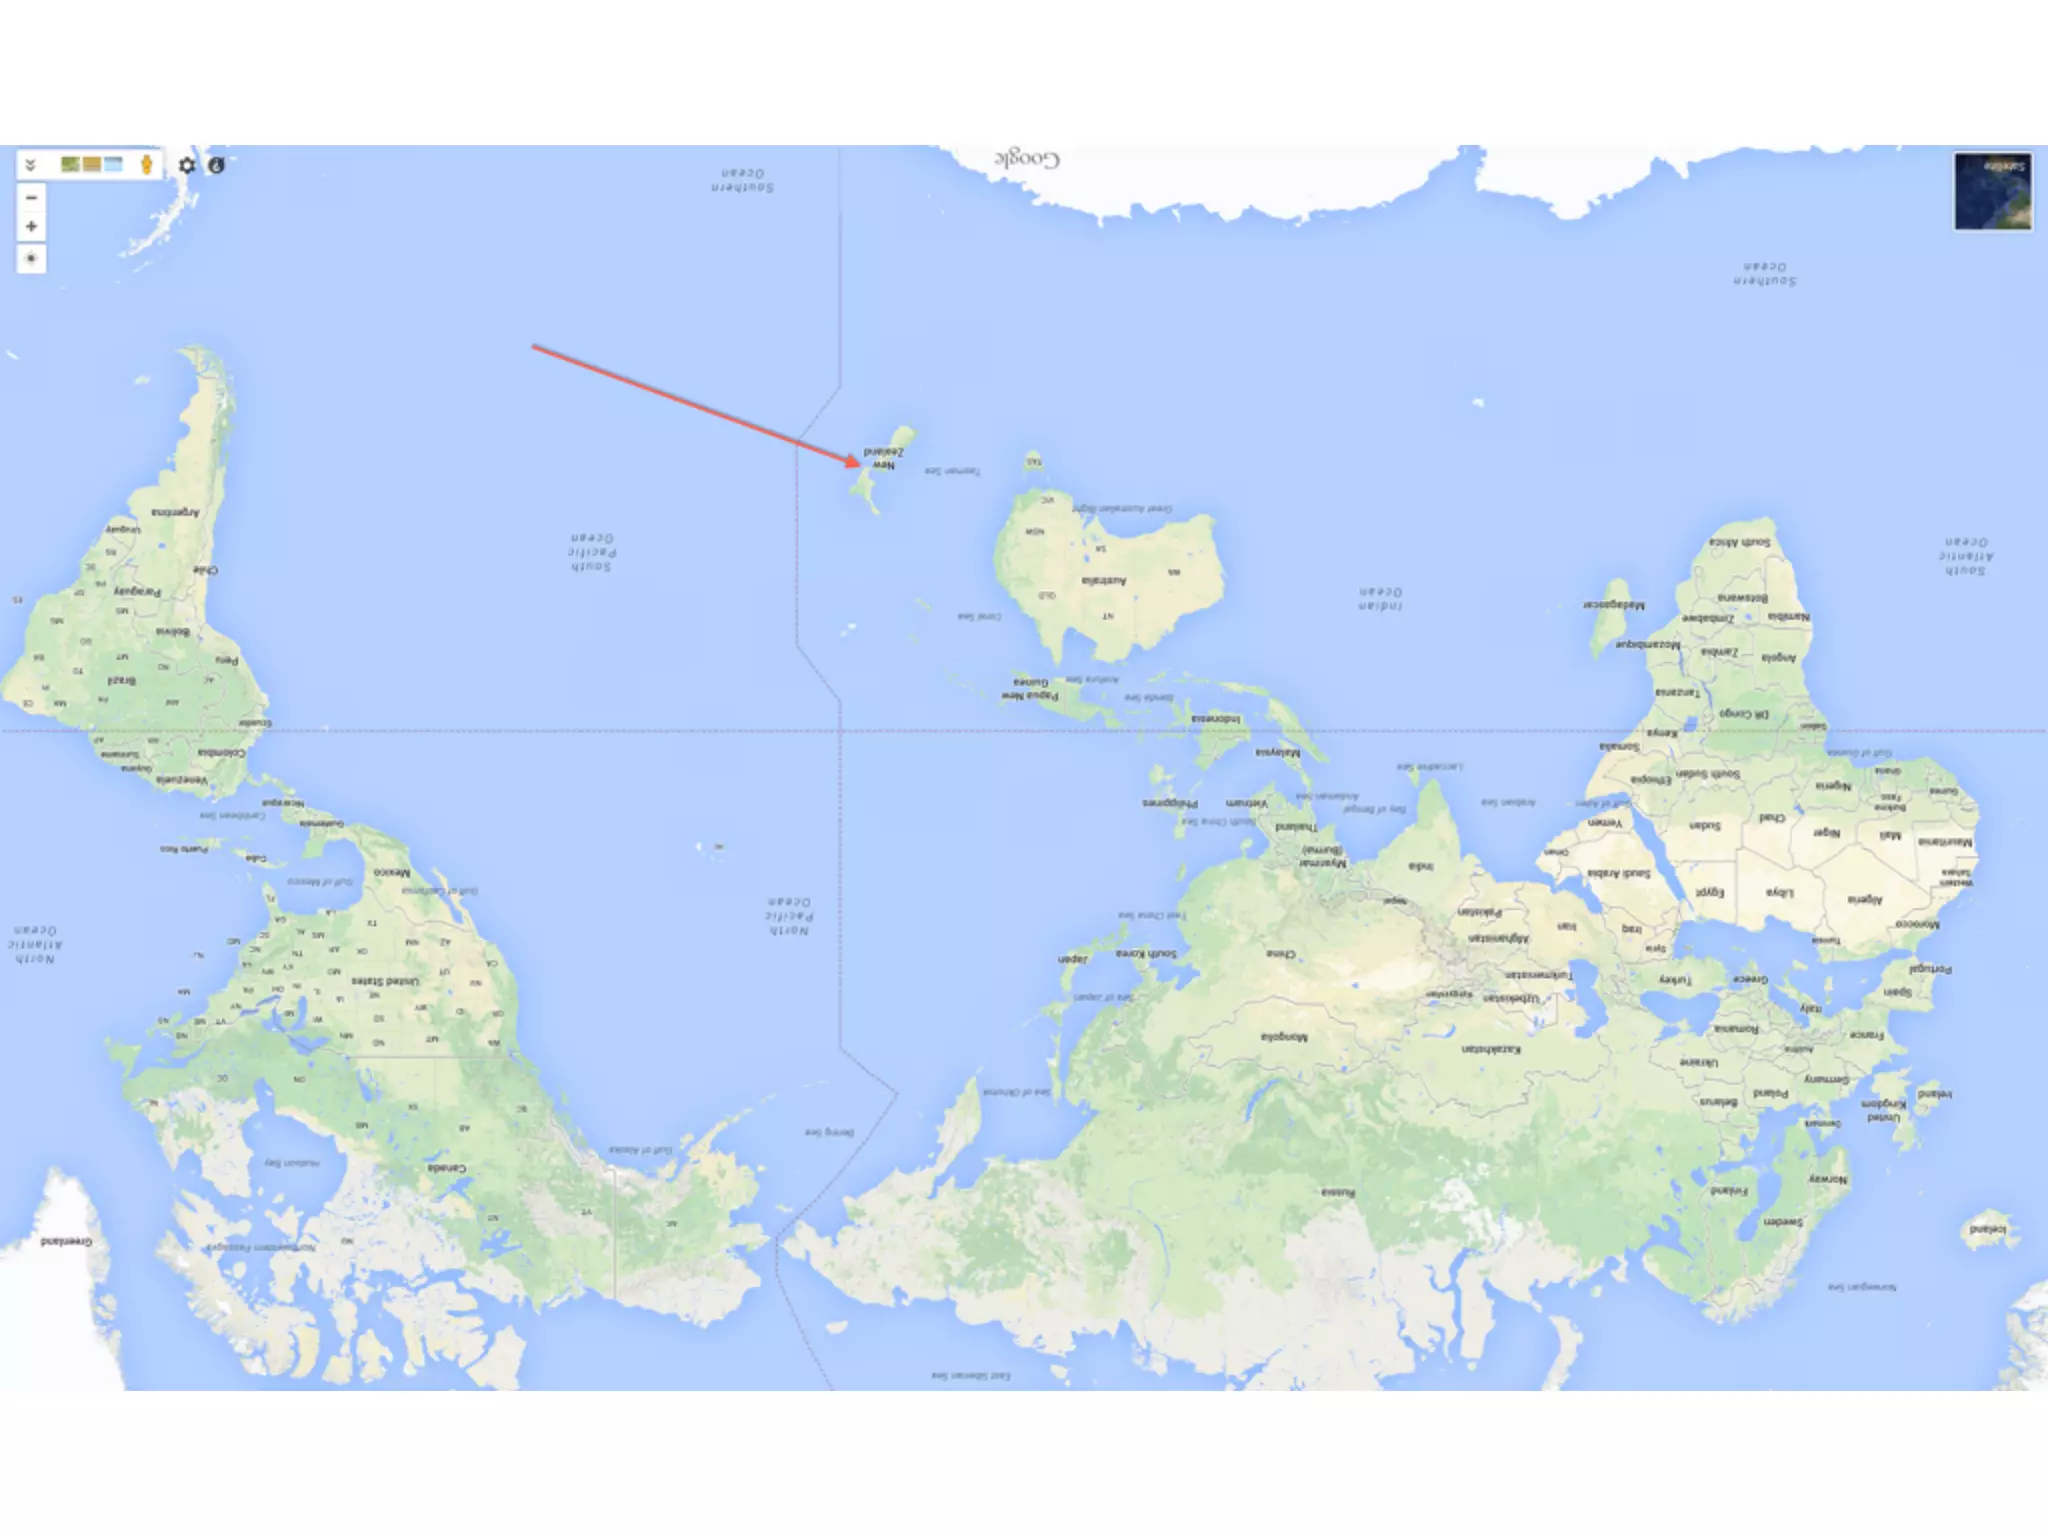
Credits for photos used in slides and provides contact information for Kai Koenig.


![[THR20007] WSL v2와 Rancher K3S로 빠르게 로컬 쿠버네티스 클러스터 만들기 / Quickly create a loca...](https://cdn.slidesharecdn.com/ss_thumbnails/8kcsik1vtzo50icigmgc-signature-1f1acddaec3a632cc6803999458a42673325e2d346ed5d110a79363d05df3ec6-poli-200123063703-thumbnail.jpg?width=640&height=640&fit=bounds)
![[네이버오픈소스세미나] Next Generation Spring Security OAuth2.0 - 이명현](https://cdn.slidesharecdn.com/ss_thumbnails/springsecurityoauth2-180905043902-thumbnail.jpg?width=640&height=640&fit=bounds)
![[오픈소스컨설팅]이기종 WAS 클러스터링 솔루션- Athena Dolly](https://cdn.slidesharecdn.com/ss_thumbnails/athena-dollyv3-150206074107-conversion-gate02-thumbnail.jpg?width=640&height=640&fit=bounds)


![[BGOUG] Java GC - Friend or Foe](https://cdn.slidesharecdn.com/ss_thumbnails/javagcfriendorfoe-101125015602-phpapp01-thumbnail.jpg?width=640&height=640&fit=bounds)