1. International Journal of Economics, Commerce and Management
United Kingdom Vol. IV, Issue 2, February 2016
Licensed under Creative Common Page 144
http://ijecm.co.uk/ ISSN 2348 0386
WHY STILL DEVELOP NATIONAL STANDARDS FOR EXPORT?
AN INDONESIA CASE STUDY
Biatna Dulbert Tampubolon
Chair of Innovation Economics, VWS2, Technische Universität Berlin, Germany
tdulbert@gmail.com
Abstract
Trade liberalisation has run into the common policy to reduce trade barriers. However, each
country seeks to protect the interests of its domestic producers against the competitive pressure
of imported goods. Many countries use the standards and conformity assessment as laid down
in the Non-Tariff Measures. The tendency of all the countries, particularly developing countries,
to adopt international standards is greater because it reduces the time, costs less, and helps to
open up new markets. Why are developing countries still developing national standards for
export? According to results derived from empirical data analysis using a concordance table, the
value of the correlation coefficient is relatively small, but higher up to 2 years, and still significant
(𝑟𝑠< 0,05). Overall, this has had a significant impact on the Indonesian trade. Viewed from the
best linear regression model, there are some positive and negative impacts in some product
sectors. The growth rate of standards development in Indonesia contributed 14.42% positive
impact on the export value since the year 2000 to 2014 and the growth of standards adoption
only yielded 10.02% positive impact in the same period. Overall, the combination of these two
factors had a positive impact at 12.54%.
Keywords: National standard, adoption, export value, international trade, Indonesia trade
INTRODUCTION
Strengthening regional interdependence and linkages between countries resulted in the
emergence of trading blocs (Baldwin and Seghezza, 2010). The tendency of trade liberalisation
is characterised by a change in the terms of trade towards policies on trade barriers, i.e., input
subsidies, import tariffs, export taxes, quotas, and others will be gradually abolished. Most of the
export companies will be inspected by the buyer or parent companies. This is in an effort to
2. International Journal of Economics, Commerce and Management, United Kingdom
Licensed under Creative Common Page 145
avoid losses, e.g., due to safety problems, or by placing the goods on the export market (Beghin
et al., 2013). A partnership between the private actors and the bilateral trade increased the use
conformity assessments by third parties, e.g., through Mutual Recognition Agreements in the
food sector (Blind et al., 2013).
Some references related to standards and trade in developed countries such as the UK,
Germany, Canada, and France, mentioned the existence of a strong relationship between
standards and international trade, with one of them being the opening of new markets (Swann,
2010, Swann, 1996). As we know, developed countries have advanced technology development
and standardisation. But for developing countries, technology and standardisation are still
undergoing the development process. Therefore, in general, developing countries tend to follow
the developed countries because of standards development, mostly initiated by developed
countries.
Some countries try to protect the interests of their domestic manufacturers from the
competitive pressure of the imported goods. Meanwhile, many countries are using Non-Tariff
Measures (NTMs), such as standards and conformity assessment (Beghin et al., 2013, Chen
and Mattoo, 2008, Berti and Falvey, 2011). Standards can become barriers to entry in the
market (John C. Beghin). In the NTMs face of imperfections in the market, protect potential
market respectively. Standardisation activities further improve their transparency by consensus.
(Fischer and Serra, 2000, Berti and Falvey, 2011, Marette and Beghin, 2010). In the last
decade, activities of standards and conformity assessment in regional and international trade
such as ASEAN and APEC increased significantly.
On trade assumption, foreign markets are more at risk for failure than the domestic
market (Beghin et al., 2013). This approach assumed that domestic producers and consumers
have been fully responsive in meeting all domestic regulations. The local producers find it easier
to sell their products and try to monopolise the domestic market. They are closer to their
consumers and use feedback to improve their product in a shorter time. But the domestic
market has been supported by the infrastructure of conformity assessment, and so both,
domestic and foreign producers, imposed production requirements (voluntary or mandatory
standards). Domestic and foreign suppliers have to make different efforts to meet market needs.
External suppliers, however, also have a positive impact, such as technology transfer.
Each state’s social planner chooses the optimal level of inspection to enforce e.g., food
safety to maximise the welfare of the country, so that the consumer surplus and domestic
manufacturers are clean against the potential of health externalities. However, the number of
frequency of checks, imposed on foreign producers established by social planners in the
4. International Journal of Economics, Commerce and Management, United Kingdom
Licensed under Creative Common Page 147
Some literature on the effects of national standards on exports from one country to another,
have a negative impact (Blind and Jungmittag, 2001), negative and significant impact (Van
Beers and Van Den Bergh, 1997, Wilson et al., 2002), positive and significant impact (Blind,
2001, Moenius, 2004, Moenius, 2006b, Moenius, 2006a, Swann, 1996). Most of the literature
based on the bilateral trade model and scopes only the small number of national standards (not
regulation) on specific sectors, such as agriculture, and textiles (Fontagné et al., 2005, Beghin
et al., 2013, Swann, 2010, Czubala et al., 2007).
Swann et al. (1996) described the relationship between standards and the trade
performance, using the UK's total trade (exports and imports) to the world. But the UK is a
developed country in terms of technology, industry, and standardisation, while Indonesia is only
a developing country in three.
Development National Standard
Each country has its own standards development policy. Based on the number of standards
drawn up and set out each year, the trend of the development standards policy in the state can
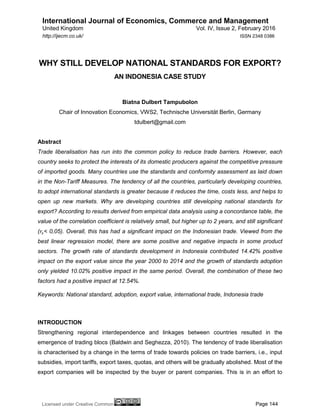
be seen. In the following figure, it is shown how national standards development in Indonesia
since 1987. For the purpose of conducting an analysis, we need data about the number of
standards available in each sector, but do not need to measure the extent to which they are
used. The standards will be associated with each industrial sector, and the products traded in
the international trade.
The market which had been using standards as a reference will be more homogeneous,
therefore, all the products that enter the market should be minimised to comply with the
standards referred. Each manufacturer will use their advantages and competition of price to
attract consumers to choose their products (Swann, 2010, Cebr, 2015). Foreign manufacturers
commonly offer their product with characteristics associated with environmental or safety risks
or advantaged technology in the production process whereas the domestic producers do not
have it. But sometimes some domestic consumers do not want to or are not interested about the
high technology process. When the product fulfils the standard requirement, the price of the
product is more considered. Both, manufacturers in the country, and abroad, must fulfil the
required market standards. The advantaged technology costs are higher than low-technology.
However, every market has different needs, both domestically, and across borders, hence,
every market has different requirements at different levels of provision, where each domestic
producer and importer are trying to meet the needs of each market (Moenius, 2004). The
product having different characteristics will increase the cost of production, which to be borne by
manufacturers to be able to get in on the market.
6. International Journal of Economics, Commerce and Management, United Kingdom
Licensed under Creative Common Page 149
Adaptation costs for exporters are higher when national standards are not harmonised with
international standards, but the existences of national standards still provide valuable
information for product adaptation on the market. Without information on standards, the exporter
will incur more costs to collect. Hence, the standards reduce the costs required for product
adaptation (Moenius, 2004).
Some standards may be an opportunity for countries to access or enhance the
development of markets of developed countries. Strict enforcement in the domestic standards in
developing countries will engender a national reputation for safety products and encourage their
exports. Variations of the standard are important in the chain of the production process, to
obtain high product quality. In general, there are several types of standards: standard of
definition, standard of quality, standard of management, standard of testing, and so on. The
standard has two effects in competitiveness. Companies have used standards to enhance the
competitiveness and transparency of technical specifications for foreign suppliers (Blind, 2004).
Figure 2: Stock of Indonesia National Standard 1987-2014
Effect to Export Values
The restriction of trade policy allows the use of alternative policy options such as standard, the
border inspection policy, and labeling, in an international context. Under the terms of efficiency
in NTMs, the welfare losses are much clearer as compared to tariffs and quotas. More diverse
sources of supply would be greater if the cost of each source of supply could be sorted out and
they cannot discriminate the supplier with the reason of tariffs and quotas.
0
1000
2000
3000
4000
5000
6000
7000
8000
9000
Number
year
SNI
8. International Journal of Economics, Commerce and Management, United Kingdom
Licensed under Creative Common Page 151
Product sector on standards and export value may be represented by a single- or double-l digit
code or more. Thus, standards and trade development can indicate a negative or positive
impact on every sector. Reyes (2010), studied the impact of EU harmonisation of standards in
the electronics sector, to conclude that it increases the likelihood of US companies entering the
EU market. The national standard development is expected to affect the value increase in the
trade. The implementation of standards has a different impact on each sector, which we will
see, are based on the classification of ICS and HS and associated with the industrial sector.
International standards are increasingly adopted and used by governments and
companies in developing countries for international trade or competence requirements in the
international market (Cebr, 2015). Increased awareness from developing countries in
international standard development was demonstrated by the increase in participation in
Technical Committee or Sub-Committee in international standardisation (Maertens and
Swinnen, 2009).
Figure 3: Indonesia National Export to Worldwide 1999-2014
Standard, Industry and Trade
In this paper, we will use three different classifications, namely the classification for standard,
industry, and exports (trade), wherein each classification has a provision in its respective
grouping. The standard uses the International Classification for Standards (ICS). This
classification is structured to classify national, regional, and international standards, and other
normative documents in databases, libraries, etc. This classification is applied on standards,
0
50
100
150
200
250
Value (US$)
Billions
Year
Value
10. International Journal of Economics, Commerce and Management, United Kingdom
Licensed under Creative Common Page 153
The author also calculates a simple growth rate as a comparison between two values in a
different time, shown as a percentage of the initial value:
Growth rate =
present value − past value
past value
𝑟 =
𝑣𝑡 − 𝑣0
𝑣0
Concordance
In this paper, the authors take a red line for the relationship of the third grouping as a product.
Other economic activities such as service, definition, management, testing, and other services
in the ISIC classification are not covered in this study. The effect of the national standard in
management, such SNI ISO 9000 series, even though they have impacts to support export
product quality, is also not included (Tampubolon and Janitra, 2011). This concordance is the
study result from some conversions which have published, such as concordance between ISIC
Revision 3 industry classifications, and ICS standard classification (Blind, 2004), concordance
from United Nations Statistics Division, and Indonesia Statistical Bureau.
Table 1: Concordance between ICS 6 Ed., ISIC Rev.4, and HS 2012
ICS 6 Ed. Label ISIC Rev.4 HS 2012 Label
65a Agriculture 01a,02a,03a,12bc 01b,03b,06-
08c,10c,13c,14c,24b
Animal & animal products;
vegetable products; tobacco
& manufacture
73a Mining and
minerals
07 a*c,08 a*c 26c,25c Salt, sulphur, earth & stone,
lime & cement; ores slag &
ash
75a Petroleum
technologies
06c,05c,19b 27b Mineral fuels, oils, waxes &
bituminous sub
67a Food technology 10 a*b,11 a*b 16-22bc foodstuffs
59a Textile and
leather
technology
13a*b,15 a*b 50-
60bc,63c,65c,41-
43bc,64c
Textiles
61a Clothing industry 14 a*b 61b,62c Apparel & clothing
accessories
79a Wood
technology
16 a*b 44b,47c Wood & Wood Products
85a Paper
technology
17 a*b 48b Paper & paperboard,
articles of paper pulp
71a,87a Chemical
technology; paint
and colour
20 a*b 28b,29b,31-38bc Chemicals & Allied
Industries
83c Rubber and
plastic
22b 39c,40b Plastics / Rubbers
12. International Journal of Economics, Commerce and Management, United Kingdom
Licensed under Creative Common Page 155
ANALYSIS AND FINDINGS
The first result related to a correlation coefficient of national standards development and the
adoption of the standard on the export value. The effectiveness of the implementation of
national standards will be shown from the correlation coefficient and significant value. In the
table below, we can see that a correlation coefficient value event is relatively small, but
increases from year to year (from the first year published or 0 years until 2 years), and still
remains significant (significant value 𝑟𝑠< 0,05). This means that the impact of the national
standards implementation on the export value becomes higher and higher.
Table 2: Summary of Correlation Value of National Standards and Adoption on Export Value
Export National standard Sig. (2-tailed) Adoption Sig. (2-tailed)
0 year after national standard published
Pearson correlation -0.065 0.319 0.228** 0.000
Spearman's rho corr. 0.165* 0.011 0.276** 0.000
1 year after national standard published
Pearson correlation -0.064 0.331 0.246** 0.000
Spearman's rho corr. 0.160* 0.014 0.270** 0.000
2 years after national standard published
Pearson correlation -0.063 0.337 0.280** 0.000
Spearman's rho corr. 0.154* 0.018 0.269** 0.000
**. Correlation is significant at the 0.01 level (2-tailed).
*. Correlation is significant at the 0.05 level (2-tailed).
Number of data, N = 234
Syntax: NONPAR CORR
/VARIABLES=X1 X2 Y
/PRINT=BOTH TWOTAIL NOSIG
/MISSING=LISTWISE.
In general, for a developing country like Indonesia, we find in this study whether national
standards development and adoption of standards will always have a positive impact on exports
when there is product information, even though there are differences in the specifications of
export products at destination countries.
Although there is a significant correlation overall, the data is often a mutually exclusive
influence between the positive and the negative; therefore, we need to look into more detail,
about how the national standards impact for each classification on exports? Do they have a
positive or a negative effect on international trade?
14. International Journal of Economics, Commerce and Management, United Kingdom
Licensed under Creative Common Page 157
Table 4: Model Summary of Linear Regression Models between Standard and Value of Exports
Model R R Square Adjusted R Square
Std. Error of the
Estimate
Dimension 0
1 .963a .927 .921 12.03576
2 .976b .953 .945 10.05703
3 .986c .973 .965 7.98051
4 .993d .986 .981 5.95916
a. Predictors: (Constant), NS_61
b. Predictors: (Constant), NS_61, A_71,87
c. Predictors: (Constant), NS_61, A_71,87, A_65
d. Predictors: (Constant), NS_61, A_71,87, A_65, A_67
e. Dependent Variable: y (export)
Results from a statistic program in the figure above, shows that the determination coefficient in
the equation linear model above, represent the ability of independent variables to explain the
variance of the dependent variable in the model 4 (𝑅2
= 0.993) and model 3 (𝑅2
= 0.986), or the
square of the correlation coefficient between standards development and export value, better
than other models.
Variable coefficient (in beta), and partial correlation values, show the influence of
variables; does it a positive or negative effect? And based on the significant value, does it
indicate that the variable has a significant effect or not?
Table 5: Summary of Variable Coefficient and Partial Correlation by Regression Model (3 and 4)
Model 3 Model 4
Variable Beta In Sig. Partial
Corr
Variable Beta In Sig. Partial
Corr
NS_65 -.157c 0.57 -0.181 NS_65 .039d 0.86 0.059
NS_73 -.007c 0.93 -0.03 NS_73 -.025d 0.67 -0.147
NS_75 .020c 0.93 0.028 NS_75 -.025d 0.89 -0.048
NS_67 -.534c 0.05 -0.581 NS_67 -.146d 0.65 -0.156
NS_59 -.106c 0.85 -0.061 NS_59 -.213d 0.62 -0.171
NS_79 -.086c 0.77 -0.094 NS_79 -.051d 0.82 -0.079
NS_85 -.389c 0.24 -0.37 NS_85 .214d 0.54 0.209
NS_71,87 -.235c 0.6 -0.169 NS_71,87 -.027d 0.94 -0.027
NS_83 .457c 0.49 0.222 NS_83 .218d 0.67 0.146
NS_77 .070c 0.69 0.127 NS_77 .023d 0.87 0.058
NS_43 -.151c 0.37 -0.283 NS_43 .031d 0.84 0.071
NS_45 .080c 0.64 0.153 NS_45 -.005d 0.97 -0.014
NS_47 .227c 0.34 0.302 NS_47 .283d 0.1 0.526
NS_21,23,53 -.072c 0.75 -0.102 NS_21,23,53 .007d 0.97 0.014
NS_91,93 .036c 0.84 0.066 NS_91,93 .012d 0.93 0.031
NS_81 .091c 0.79 0.088 NS_81 .073d 0.77 0.099
NS_97 -.092c 0.83 -0.071 NS_97 -.065d 0.84 -0.070
A_73 .031c 0.84 0.064 A_73 -.095d 0.44 -0.262
16. International Journal of Economics, Commerce and Management, United Kingdom
Licensed under Creative Common Page 159
CONCLUSION
Several conclusions are drawn from this study of the correlation between the national standard
development, adoption of the standards, and export value: the national standards development
and standard implementation by the export value have a more increasing impact after the year
of publishing and for up to 2 years later.
Although overall these have significant impacts on the Indonesian trade, but seen from
the best linear regression model (model 4), it would seem like a positive effect only for product
sectors such as agriculture, paper technology, rubber and plastic industries, metallurgy, road
vehicle engineering, shipbuilding and marine structures, metals and non-metallic mineral
products, construction and civil engineering, and glass and ceramics industries. Additionally,
there is a negative impact for certain product sectors such as mining and minerals, petroleum
and related technologies, food technology, textile and leather technology, wood technology,
chemical technology and paint industries, railway engineering, and domestic and commercial
equipment.
In Indonesia, the growth rate of the standards development and adoption yield an impact
of 12.44% (from an average of around 12.746 billion US$ per year) on export growth from 2000
to 2014, while the growth of standard development contributed 14.42% positive impact and
adoption standards give smaller number. The positive impact of adoption would lead to reduce
the rate of export growth.
In this paper, the author investigates the adoption of the standards in Indonesia,
especially to the standards that have been existing for more than 7 years old. The author found
that the track record of adoption is still limited. No availability in digital form which make the user
have to check through all hard copied, inadequate access to those standard documents and
frequently published literature discussing adoption of the standard and use of standard are the
most barriers. With those conditions, the author could not provide a comprehensive analysis of
Indonesia national standard in all sectors to improve its export performance.
DISCUSSION
Although the implementations of national standards have an impact on trade, especially on
export value, it is still not clear until when a standard provides an increasing impact before
deciding whether to revise or replace with a new national standard. In general, a standard will
be revised every five years, whether this is effective or not.
National standards’ development on food technology has a negative effect on the value
of exports. There is currently a gap between the domestic product specifications and the export
markets; therefore, national standards development will more effectively support the export
18. International Journal of Economics, Commerce and Management, United Kingdom
Licensed under Creative Common Page 161
Maertens, M. & Swinnen, J. F. (2009). Trade, standards, and poverty: Evidence from Senegal. World
Development, 37, 161-178.
Marette, S. (2008). Standards and Labels. Economics Bulletin, 12, 1-7.
Marette, S. & Beghin, J. (2010). Are standards always protectionist? Review of International Economics,
18, 179-192.
Moenius, J. (2004). Information versus product adaptation: The role of standards in trade. Available at
SSRN 608022.
Moenius, J. (2006a). Do national standards hinder or promote trade in electrical products. Commended
Paper, IEC Centenary Challenge, http://www.iecchallenge.org/papers.
Moenius, J. (2006b). The good, the bad and the ambiguous: standards and trade in agricultural products.
IATRC Summer Symposium, 28-30.
Swann, G. (1996). P., P. Temple and M. Shurmer. Standards and Trade Performance: The British
Experience. Economic Journal, 10, 124-145.
Swann, G. P. 2010. International standards and trade.
Tampubolon, B. D. & Janitra, T. (2011). The effects of ISO 9000 standard on financial performance of
manufacturing companies listed in Indonesia stock exchange. Journal of standardization, 13, 7.
United Nations, D. O. E. A. S. A.-S. D. (2008). International Standard Industrial Classification of All
Economic Activities - Revision 4. New York: United Nations Publication.
Unnevehr, L. J. (2000). Food safety issues and fresh food product exports from LDCs. Agricultural
Economics, 23, 231-240.
Van Beers, C. & Van Den Bergh, J. C. (1997). An empirical multi‐country analysis of the impact of
environmental regulations on foreign trade flows. Kyklos, 50, 29-46.
Van Tongeren, F., Beghin, J. & Marette, S. (2009). A cost-benefit framework for the assessment of non-
tariff measures in agro-food trade.
Wilson, J. S., Tsunehiro, O. & Sewadeh, M. (2002). Dirty exports and environmental regulation: do
standards matter to trade?, World Bank Publications.