
Recommended
Recommended
More Related Content
What's hot
What's hot (20)
Similar to K3690100
Similar to K3690100 (20)
More from aijbm
Recently uploaded
Recently uploaded (20)
K3690100
- 1. American International Journal of Business Management (AIJBM) ISSN- 2379-106X, www.aijbm.com Volume 3, Issue 6 (June 2020), PP 90-100 * Corresponding Author: Michael F. Centino1 www.aijbm.com 90| Page The Current Status of Philippine Mango in the Global Value Chain Michael F. Centino1 , Mary Caroline N. Castaῆo2 , Jenny Beb F. Ebo3 1 The Graduate School, University of Santo Tomas and Associate Professor, College of Accountancy and Business Administration, San Carlos College Mabini St., San Carlos City, Pangasinan, Philippines 2420 2 Associate Professor, The Graduate School, University of Santo Tomas, Philippines 3 Associate Professor, Cavite State University, Philippines *Corresponding Author: Michael F. Centino1 ABSTRACT. To maintain the Philippines’ competitive edge in the trading of agricultural products, this study identifies the current status of the Philippines’ participation in the mango global value chain. The competitive edge of the Philippines in the global market has been recorded in the trading history. Its contribution to the economy is notable; however trading is limited to fresh mangoes. Likewise, the continuous decrease of area planted to mangoes contributed to its bounded participation in global value chain. Meanwhile, some countries in Asia emerged in the industry and further threatened the entrance of Philippine mango in the foreign market. This situation will be altered by strengthening the country’s global competitiveness, gross domestic product and implementing policies on remoteness of the country. The policy recommendations, if implemented, can guarantee strong integration of Philippine mangoes in the global chain, which will facilitate the flow of factor payments in the economy, thereby raising the standard of living of Philippine citizens and creating more social protection for the Philippine people. Keywords: Philippine Mango, Global Competitiveness, Global Value Chain I. INTRODUCTION The term “Global value chain” (GVCs) is often expressed as one of the features that shape the current swing of globalization however little is known on how to efficiently integrate it in the chain. The current situation of developing countries like the Philippines motivates these countries to search for efficient and effective ways to integrate “GVC” in the global economy. With barriers such as limited resources and policy challenges, developing countries are less competitive and can be left behind by neighbouring developed countries if they will not improve their respective social and economic outcomes. Trade statistics shows that mango as an agricultural crop also follows the integration in global value chain, for the past ten years mango trade shows an increasing trend from US$696 million in 2005 to US$2 billion in 2015 (UN Comtrade, 2016). This is also evident to its position regarded as the top five of the most cultivated fruits in the world. Yet in some countries, studies shows that trade is limited since majority of the produce is still locally consumed (FAO, 2016). In the Philippines, mango contributed to the achievement of the development goal of the country. Globally, the country had participated in the mango global market chain with an increasing exports of fresh and dried mangoes which is US$67.9 million or 2.6 percent share of the global market (UN Comtrade, 2018). The country has exported mangoes to Hong Kong (China), Japan, Singapore, Switzerland, UK and the USA. The increase in mango exports can also be attributed to the low tariff in exports, which allows Philippine mangoes to enter duty-free markets, as provided by the World Trade Organization and Japan. Likewise, locally, mangoes served as a major source of income to an estimate of 2.5 million farmers, ranked third after bananas and pineapples in terms of quantity and value of production, thus, providing major a source of income to an estimate of 2.5 million farmers (PCARRD DOST, 2017). With the Philippines strengths in mango production, the country is regarded as one of the leading producers and exporters of dried mangoes, with 85 percent of its total processed products was exported. However, the country’s participation in fresh mango export is often limited which is largely due to limited farm size. According to the Bureau of Agricultural Statistics Report (2016), the average area of farm planted with mangoes is 1.34 hectares. There are also other constraints that hinder the Philippines’ potential to improve its ranking. One of these problems is the inability to meet strict Sanitary and Phytosanitary (SPS) terms in markets. Similarly, productivity difficulties were experienced by the Philippine mango including erratic annual production and quality yields because of environmental aspects, pest and diseases and the high costs of inputs
- 2. The Current Status Of Philippine Mango In The Global Value Chain * Corresponding Author: Michael F. Centino1 www.aijbm.com 91| Page by the Philippine mango industry (PCARRD-DOST, 2011). Moreover, the industry also faced lack in technological development in order to survive environmental hazards, inadequate irrigation equipment, the lack of fertilization management and equipment and abuse in the use of pesticide (Briones et al., 2013; Buguis, 2014; Hambloch, 2015). Lastly, other significant challenges including lack of financial resources and infrastructure are considered as threat. Meanwhile, other significant mango exporters including Mexico, Peru, Brazil, India and Thailand emerged in the industry. These countries threatened the status of the country in the global trade. Mexico and Peru have placed considerable focus on developing and upgrading farming techniques and many of their farms are certified by and followed the standards set by GAPs. Concurrently, other countries like India have allocated additional budget for Research and Development to solved problems of low productivity and seasonality (R&D) like India. Literature Review There are four points that will be discussed in Literature Review. Definition of Global Value Chain According to the WTO (2011), the term “value chain” illustrates all of the activities that firms and workers do to produce goods or provide service from its conception to its end use and so on. This includes activities such as the design, production, marketing, distribution and support to the final consumer. All these activities was then organized with the so-called global value chains (GVCs), wherein the different stages in production process are located across different countries (OECD, 2019). Melle et.al (2007) describes “value chain” that includes all activities needed to produce a product from “conception”, thorough “production”, “transformations”, and “delivery” to final consumers and also needs to incorporate the proper final disposal after usage. It includes process and also players from suppliers of inputs to producers and processors to exporters and buyers engaged in the activities required to produce a product for its end use. Various researchers used the concept in different fields. One of the well-known business books authored by Michael Porter (1985) introduced the concept in constructing corporate strategy. According to him, for the firm to be globally competitive, it is necessary to focus on the entire system of activities like that of the chain in which activities must be organized collectively. While Kimura and Ando (2005) suggested that the value within the system which is the product of the firm’s effort was also the factor of the value distribution system that influenced the firm’s selection. The vertical participation of “GVC” relies on the hierarchical pattern that has an absolute and unidirectional control of the main company over its subsidiaries. Figure 1 shows the modes of organizing value chains and that the subsidiaries performance is carefully supervised and examined in line with their main company management strategies. Outsourcing options on the other hand, show that the relationship among clients (buyers) and subcontractors (service suppliers) have the same level of exercised powers. Figure 1: Modes of Organizing Value Chains, Kimura and Ando 2005
- 3. The Current Status Of Philippine Mango In The Global Value Chain * Corresponding Author: Michael F. Centino1 www.aijbm.com 92| Page Measurement of Global Value Chain While there are various studies conducted on analysing the global value chain, complexity of the measurements used has created difficulties on apprehending trade and creating policies. Traditional measurements used gross value of the exchange between partner countries and do not include producer’s contribution in understanding global value chains of commodities. Other literature used value-added of trade data. Chen et.al (2014) introduced the idea of integrating gross exports into the value added context. With the limitation of the conventional approach, some studies used “input-output” tables. Hummels et al. (2011) for instance introduced the concept of vertical specialization and used input-output tables to measure the intermediate inputs used to produce an exported good. Another study conducted by Daudin et al. (2006) constructed a multi-country input-output table from 70 countries to compute for the domestic value-added of exports. This also includes indices of vertical specialization and regionalization. Moreover, Bems and Johnson (2012) proposed the concept of “value-added” real effective exchange rate. These indicators were used to clear the external imbalances and use to evaluate the magnitude of prices. Moreover, Koopman et al. (2016) introduced the decomposition method of gross exports into various sources of value added. The method breaks down the gross export into local value added absorbed abroad, local value added first exported then returned back home, foreign value-added and pure double-counted terms. In terms of its categorization, Gereffi et al. (2015) discussed a GVC categorization that shows the relationship between contracting parties respective of their powers. Figure 2 shows the five variations of “GVC” governance. The boundary was represented by the rectangles and their size represents the “bargaining power” with respect to the other party. Moreover, the arrows illustrate the path and the degree of business integration in the partner’s activities. The right of the diagram shows that clients possess greater bargaining power than its left, and they are also interpreted as having the capability to exert a major influence over the distribution of value added. In this diagram they also considered the movement of the GVC configuration with parameters of “complexity of transactions”, “ability to codify transactions”, and “capabilities “in the supply base or the 3 C’s model. Figure 2:The classification of Global Value Chains, Gereffi, Humphrey & Sturgeon, 2015 Determinants of Global Value Chain Various studies pointed out different factors that contributed to the increasing integration to the global chain, these depends heavily on the economic and geographical status of each countries. In Asia for instance, food distribution systems relied on changes in urbanization, consumer preference and eating habits, infrastructure development and competition. This integration in the supply chains and networks provided chance for making added value. Moreover, branding lead to high consumer confidence and satisfaction in the
- 4. The Current Status Of Philippine Mango In The Global Value Chain * Corresponding Author: Michael F. Centino1 www.aijbm.com 93| Page buying of good and services. Likewise, chains helped in facing challenges by creating partnership, input provider, marketers and customer within the networks of chain (Chen and da Silva, 2005). Geography was also found out to be one of the determining factor of Global Value Chain. The center of production hubs in terms of trade includes the United States, Asia which includes China, Japan and Republic of Korea and one in Europe, Germany. According to Diakantoni (2017) on his study based on the UN Comtrade database, China is on the boundary and tends to trade with the “hub” that is nearest in geographic distance. Since African countries are far from the existing hubs, trade becomes difficult in these countries. Many developing countries are also far from the existing hubs that affects their integration in the chain. Figure 3 shows the interconnection and the center of production “hubs” in terms of trade. Figure 3: The three interrelated production hubs, Diakantoni et al., 2017 Moreover, flexibility and speed were factors that also contributed to the degree of integration. Shorter lead time, fast response to market change, and the demand-driven orientation greatly contributed to the manufacturing supply chain strategy. However, the degree of integration within the chain needs improvement because the functional level of the supply chains is not the desired level. There is a lack of values and integration on the vertical and horizontal members of the manufacturing industries, which hinder the best value chain. Working in “Silos culture” leads to lack of customer focus and top management commitments (Lemenge & Tripathi, 2011). Analysis of Global Value Chain There were also various approach used in the analysis of the global value chain integration. Some studies used qualitative approach like case analysis. In the study conducted by Sarah Mutonyi and Karin Beukel (2015) they explained in the study that “price fairness”, “price reliability”, and “relative price” are scope of price contentment that influence producers’ trust in the buyer. The study found out that trust is an important mediator factor which affects producer loyalty and price satisfaction. Kusnandar (2012) utilized case study method and the application of the triple helix model and causal loop diagram. The results of the study revealed that institutional innovation provides support to the farmers thereby reducing risk. It further opens the chance for the farmers to be included in the supply chain of the “export market”. Developing a scheme of information to determine the operation of the multi stakeholder participation in the supply chain and the improvement of policy simulator as a matter of upgrading the triple helix policy of Indonesia. However very limited studies used quantitative approach, the study of Muntonyi et al. (2016) which utilized the SEM model revealed that trust is important factor that influence producer’s loyalty. Relative price, reliability and price fairness are the identified scope that establish producer’s loyalty and trust in the supply chain. These findings are in relation to latest studies about trust and its role. Since the player’s perception involved in the chain changes overtime, it is recommended to rely on a design which is longitudinal. However,
- 5. The Current Status Of Philippine Mango In The Global Value Chain * Corresponding Author: Michael F. Centino1 www.aijbm.com 94| Page the model has established a low disparity in producer loyalty and trust with only 45 percent, therefore other factors needs to be addressed in this study. In China, Wang et al. (2017), utilized the Structural Equations Modelling in analysing the sustainable food supply chain management practices. Results suggest that “supply chain management practices” positively affects the environmental and social performance that leads to improvement of financial performance. Food safety insurance is in turn affected by sustainable performance. However, the model did not consider effect of other variables such as “moderator” and “control”. They recommended that new variables into the mechanism of Sustainable Supply Chain Management (SSCM) practices. Enterprises of different sizes are significantly different in SSCM and that its impact to sustainable performance may differ. SSCM included the internal and external management and its relationship was not included in the study. With the limitations of SEM specifically as applied in first-hand information, gravity model might be a necessary tool that will bridge the gaps in information. The “Gravity model” that predicts the bilateral trade flows based on the economic sizes and distance between two units. Since global value chain deals with trade this model is applicable to use. Trade volumes depend on an entire network structure of trade connections (Baldwin and Taglioni, 2011). The intermediate goods trade between two countries “ increases in the size and productivity of a third country and declines in each of the two countries trade costs to it ”. They call this relation “gravity” of a third country which finally contradicts the common theoretical literature of the final goods trade where third country “gravity”, or in traditional terms, lower multilateral resistance, decreases bilateral trade (Anderson and van Wincoop, 2003). The gravity model, in its standard form, is derived from a consumer expenditure system in which the price term is eliminated using the general equilibrium structure of the theoretical model. In Anderson and van Wincoop (2003), the demand for the products of i by entity j , derived by maximizing the CES utility function of the consumer j , is as follows: where Pi, is the supply price of i , tij the iceberg trade costs and Pj the consumer price index in j . The aggregate exports of i to all partners j are equal to the total output of i: The above market clearance condition is then used to eliminate the relative price term ( Pi ) in expenditure equation (1). The equilibrium prices are then: Hence, trade from i to j in equilibrium is: The above model relies on the assumption that the products exported from i to j are produced solely in i . In empirical gravity literature Xij , is measured as the gross exports of i to j , while Yi is measured on a value-added basis by the GDP of entity i . However, under vertical specialization, the origin of the value-added and the exporter of the goods are no longer the same and the volume of aggregate gross exports is much higher than the amount of domestic value-added due to the import content of exports or, in other words, intermediate goods imported and re-exported after being processed.
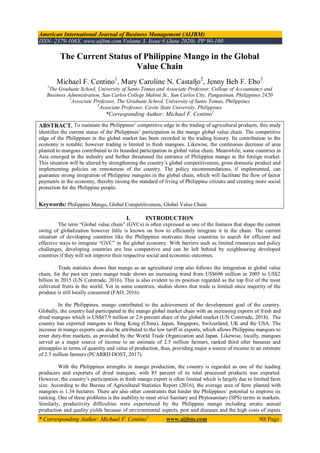
- 6. The Current Status Of Philippine Mango In The Global Value Chain * Corresponding Author: Michael F. Centino1 www.aijbm.com 95| Page II. METHOD The study used descriptive research design. It described the situation or status of the Philippines in the mango global value chain integration. Pangasinan in Luzon, Western and Central Visayas, Davao and Cotabato are the leading exporters of mango in the Philippines. These provinces come from four regions of the country namely, Region 1, 6, 7 and 11 and was chosen as the regions that are assumed to be involved in the mango global value chain. The data were gathered from the agencies Philippine Statistics Authority and UN Comtrade. Likewise, the leading importers of fresh and dried mangoes according to UN Comtrade (2016) are USA, Netherlands, China, Germany, Canada, Vietnam, Hong Kong, United Arab Emirate, Korea, Thailand, Singapore and Japan. Trade data of these countries were also used as basis of the analysis in this study. III. RESULTS AND DISCUSSION Status of the Philippines in the Global Trade of Mango According to the Department of Agriculture (2018), mango placed third as the most important fruit crop in the Philippines next to banana and pineapple. The mango fruit’s importance is due to the fact that it is the Philippine national fruit and one of the country’s top agricultural exports. The three well known variety of mango are all present in the Philippines, and these are Carabao, Pico and Katchamita (also known as Indian Mango). However, Carabao is the most dominant variety that is widely grown and is the sole exported variety. By 2017, the Philippines ranked ninth in exports of fresh and dried mangoes which is US$ 67.9 million or 2.6 percent share of the global market (UN Comtrade, 2018). Mexico is the country having the highest exports. This was followed by Netherlands, Thailand, Brazil, Peru, India, Spain and China. These countries compete with the Philippines in global market for mangoes. Figure 4 shows the leading exporters of fresh and dried mango by value in the world. Figure 4: Leading exporters of fresh and dried mango by value in the world, 2018 Source: UN Com Trade The Philippine mango industry consists of few large farms with over 20 hectares, a few hundreds of medium sized farms of 2 to 5 hectares, and 1.9M of very small farms with an average of 10 to 12 trees for a total equivalent area of 146,841 hectares planted with Carabao mango. With this condition of the mango farms, the operation of orchards was limited to corporate farms. While most of the small growers were involved in service contractors, contract-sprayers to spray and manage the fruiting of their trees which are unprofitable in most places. (PSA, 2018). 459.9 374.6 275.1 205.5 191.7 145.6 85.3 70.1 67.9 52.6 0 100 200 300 400 500 MEXICO NETHERLANDS THAILAND BRAZIL PERU INDIA SPAIN CHNA PHILIPPINES COTE D IVOIRE Exports in US$ (millions)
- 7. The Current Status Of Philippine Mango In The Global Value Chain * Corresponding Author: Michael F. Centino1 www.aijbm.com 96| Page Likewise, according to Philippine Statistics Authority, Philippines is lagging behind in the world market for mango. This is evident in its yield with having 4.1 mt/ha which is below the world average of 7.65 mt/ha and is far from Thailand’s with yield of 8.20 mt/ha. With this situation, mango yield must be improved in order to be competitive in the global market (PSA, 2018). Table 1 shows the mango production, area and yield of top 10 producing countries from 2010 to 2011. Table 1: Mango production, area and yield of top 10 producing countries, 2010-2011 Country Production (MT) Area harvested (ha) Yield (MT/ha) 2010 2011 2010 2011 2010 2011 WORLD 37,149,496 38,953,166 4,956,754 5,088,800 7.49 7.65 India 15,026,700 15,188,000 2,312,300 2,297,000 6.50 6.61 China, mainland 4,000,000 4,350,000 450,000 450,000 8.89 9.67 Thailand 2,550,595 2,600,000 311,048 317,000 8.20 8.20 Indonesia 1,287,287 2,131,139 131,674 208,280 9.78 10.23 Pakistan 1,845,528 1,888,449 173,731 172,008 10.62 10.98 Mexico 1,632,649 1,827,314 174,970 196,930 9.33 9.28 Brazil 1,189,651 1,249,521 75,179 76,383 15.82 16.36 Bangladesh 1,047,849 889,176 129,000 111,100 8.12 8.00 Nigeria 850,000 850,000 130,000 130,000 6.54 6.54 Philippines 843,508 800,551 197,816 195,401 4.26 4.10 Source: FAO Statistics Mango trees were cut down for being unproductive because of poor farming practices. Some farmers had adopted wrong planting distances, use chemicals which damaged the good microorganism and biodiversity of the soil. These suggests of increasing market demand of natural and organically grown mangoes which are free from toxic chemical residues which makes the farmers rethink of their farming system to meet market demands. Table 2 shows the top mango producing provinces such as Pangasinan, Zamboanga del Norte and Davao del Sur and Cebu were climate are well- suited for cultivation of mango. Table 2: Top Carabao mango producing provinces, Philippines, 2018 Rank Province Production (MT) 1 Pangasinan 121,142 2 Zamboanga Del Norte 47,489.02 3 Cebu 39,850 4 Davao Del Sur 38,974 5 Misamis Occidental 23,210 6 Iloilo 23,125 7 Ilocos Norte 20,993 8 Batangas 18,636 9 Nueva Viscaya 18,572 10 Isabela 17,381 Source: Philippine Statistics Authority, 2018 Philippine Mango in the Global Value Chain Since 1980, the Philippines notably participated in the mango global market with increasing exports in the 1990s. By 2017, the Philippines ranked fourth in exports of fresh and dried mangoes which is US$67.9 million or 10.08 percent share of the Asia’s export of mango (UN Comtrade, 2018). The country has exported mangoes to Hong Kong (China), Japan, Singapore, Switzerland, UK and the USA. The increase in mango
- 8. The Current Status Of Philippine Mango In The Global Value Chain * Corresponding Author: Michael F. Centino1 www.aijbm.com 97| Page exports can also be attributed to the low tariff in exports, which allows Philippine mangoes to enter duty-free markets, as provided by the World Trade Organization and Japan. Figure 5 below shows the leading exporters of fresh and dried mango by value in Asia, 2018. Figure 5: Leading Exporters of Fresh and Dried Mango by Value in Asia, 2018 However, the current situation of mango in the farming industry posts problem in terms of the area planted and volume of production. As shown in Figure 6, the land area planted with mangoes decreases at an average of 0.20% within the period of five years with an average farm size of 1.34 hectares. Correspondingly, volume of production decreases at an average of 1.78% in five years (Figure 7). Figure 6: Land Area Planted with Mango (in Hectares), Philippines, 2013-2018 Figure 7: Volume of Production (in Metric tons), Philippines, 2013 – 2018 Asia’s Export is US$ 673.5 million Decreases at an average of 0.20% in the last six years with an average farm size of 1.34 hectares Decreases at an average of 1.78% in the last six years with an average farm size of 1.34 hectares
- 9. The Current Status Of Philippine Mango In The Global Value Chain * Corresponding Author: Michael F. Centino1 www.aijbm.com 98| Page With the decrease of its volume of production, the share of mango to total exports declined, exhibiting a drastic fall (Figure 8). This explains the decreasing competitiveness of the Philippine mangoes in the world. Figure 8: Percentage Share of Mango to Total Philippine Export, in FOB value Million pesos (at constant) prices, 2013-2018 The country’s participation in the global value chain was limited in the production and processing stage of the chain. Thereby limiting its integration (Figure 9). This situation limits its participation in the trade of fresh and processed mangoes. Figure 9: Philippine Participation in the Mango Global Value Chain Majority of processed mango in dried, airtight and juice goes to US and puree goes to Hong Kong (Figure 10). Figure 10: Processed Mango Exports Value in US$ Millions, FOB, 2013-2017, By Type, By Export Destination Philippines
- 10. The Current Status Of Philippine Mango In The Global Value Chain * Corresponding Author: Michael F. Centino1 www.aijbm.com 99| Page IV. CONCLUSIONS AND POLICY RECOMMENDATIONS Based on the results of this study, the government’s concerned agencies need to take a look on the present situation of the Philippine mango specifically on its decreasing volume of production. There is a need to review policies to boost the agricultural production of mango in the country. Likewise, a need to strengthen research and development is also necessary to help increase the integration of mango in the global value chain. The present situation of mango in the international market shows its competitive edge in the market of fresh mango; however it has limited integration in the global chain. Therefore, the country must find ways how to increase its integration. The Philippines’ participation in mango global value chain is also limited to its exports of fresh and processed mango and was threatened by the decreasing pattern of its land area planted with mangoes. The Philippines for such was majority present and specialized in the primary goods that is the supply of fresh mangoes in the world that explains the similarity and small differences in the result of the two export values used in the analysis of global integration. This does not mean that the Philippines is not concerned in Global Value Chain Integration, but processing activities involved in the chain are mainly oriented to the supply of fresh mangoes to the foreign markets because of its low competitive nature. Since the Philippines is only present in the production stage and was limited to the final stage which is processed products, its global integration is threatened by its competitor countries. The concerned authorities must also take necessary action to help the mango farmers. As the results reveals, the Philippines participation is limited only in the production and processing stage of the chain. To integrate deeply, the country may invest to improve the quality and freshness of the Philippine mangoes. Invest also in buying machineries and equipment to be able to compete globally. They may also tap the available manpower and skills to integrate in distribution, marketing and sales. Investment in education and trainings might be the key factors necessary for the upgrade of the country’s status in global trading. The policy recommendations, if implemented, can guarantee strong integration of Philippine mangoes in the global chain, which will facilitate the flow of factor payments in the economy, thereby raising the standard of living of Philippine citizens and creating more social protection for the Philippine people. REFERENCES [1]. Anderson, J.E. Van Wincoop, E. (2013). Gravity with Gravitas: A Solution to the Border Puzzle. The American Economic Review, 931(1): 170-192 [2]. Bems, R., & Johnson, R. (2012). Value-Added Exchange Rates. NBER,Cambridge, MA. [3]. Briones, R. M., Turingan P.S & Rakotoarisoa, M.A. (2013). Market Structure and Distribution of Benefits from Agricultural Exports : The Case of the Philippine Mango Industry Food and Agriculture Organization of the United Nations. [4]. Chen, K. (2016). Innovations in Financing of Agri-Food Value Chains in China and India: Lessons and Policies for Inclusive Financing. [5]. Chen and da Silva (2005). Changes in Food Retailing in Asia Implications of Supermarket Procurement Practices for Farmers and Traditional Marketing Systems; FAO, Rome. [6]. Chen, X., L. Cheng, K.C. Fung, and L. Lau. (2004). The Estimation of Domestic Value-Added and Employment Induced by Exports: An Application to Chinese Exports to the United Tates. In China and Asia: Economic and Financial Interactions, edited by Y.W. Cheung and K.Y. Wong. New York: Routledge. [7]. Daudin, G.,C Rifflart and D. Schweisguth.(2006). Who Produces for Whom in the World Economy”? Document de travail No. 2009-18 Observatoire Francai des Conjonctures Economiques, Paris. [8]. Diakantoni, A., H. Escaith, M. Roberts and T. Verbeet.(2017). Accumulating Trade Costs and Competitiveness in Global Value Chains. World Trade Organization (WTO) Working Paper Economic Research and Statistics Division (ERSD) 20017-2, WTO, Geneva. [9]. Gereffi, G.,J. Humphrey and T. Sturgeon. 2015. The Governance of Global Value Chains. Review of International Political Economy. 12 (1) 78-104. [10]. Gujarati, D. (2011). Econometrics by Example. United States of America: Mcmillan Publisher Limited. [11]. Guilhoto, J. Siroen, J.M & Yucer, A., (2015). The Gravity Model, Global Value Chain and the Brazilian States. Documents de Travail UMR DIAL. [12]. Head, K. (2003). Gravity for Beginners. Mimeo University of british Coulumbia Vancouver, B.C. [13]. Hummels, D.,J.Ishii, and K.M. Yi.(2001). The Nature and Growrh of Verical Specialization in World Trade. Journal of International Economics 54 (1):75-96.
- 11. The Current Status Of Philippine Mango In The Global Value Chain * Corresponding Author: Michael F. Centino1 www.aijbm.com 100| Page [14]. Kimura, F. and M. Ando. 2015. Two dimensional Fragmentation in East Asia: Conceptual Framework and Emperics. International review of Economics and Finance 14(3):317-48. [15]. Koopman, R., Z. Wang and S. Wei and K.Zhu. (2016). Tracing Value-Added and Double Counting in Gross Export: Reply to the Comment by Bart Los, Marcel Timmer and Caaitzen J. de Vries. Draft Manuscript. [16]. Kusnandar, T. (2014). Effectiveness of a “whole chain” approach in linking farmers to market: A case of Pakistan mango market. UMK Procedia 1 (2014 ) 57 – 62 [17]. Lemenge, F., & Tripathi, S.K. (2011). Critical Issues in Realising Best-Value through Strategically Aligned Supply Chains: A Study of Selected Manufacturing Companies in Tanzania. Management Convergence Vol.1 No.2, 32-44. [18]. Mutonyi S. & Beukel. K. (2016). Price Satisfaction and Producer Loyalty: The Role Of Mediators In Business To Business Relationships In Kenyan Mango Supply Chain. British Food Journal (2016), Vol. 118 Issue: 5, pp.1067-1084 https://doi.org/10.1108/BFJ-09-2015-0319 [19]. Porter, M.E. (1985). Competitive Advantage, Creating and Sustaining Superior Perfromance. New York: Free Press. [20]. PSA. (2007-2018). Firm-Level Trade Data. Manila: Philippines Statistics Authority (PSA) [21]. UNComtrade. (2016). World Mango Exports by All Reporters and Partners, 2005-2015. Retrieved October 22,2018, from United Nations Statistics Division. [22]. Wang,J., Huili,Y. & Goh, M. (2017) Empirical study of sustainable food supply chain management practices in China. British Food Journal (2017), https://doi.org/10.1108/BFJ-09-2017-0525 [23]. WTO (World Trade Organization) and IDE-JETRO (Institute of Developing Economies-Japan External Trade Organization) 2011. Trade Patterns and Global Value Chains in East Asia: From trade in Goods to Trade in Tasks. Geneva: WTO. *Corresponding Author: Michael F. Centino1 1 The Graduate School, University of Santo Tomas and Associate Professor, College of Accountancy and Business Administration, San Carlos College Mabini St., San Carlos City, Pangasinan, Philippines 2420