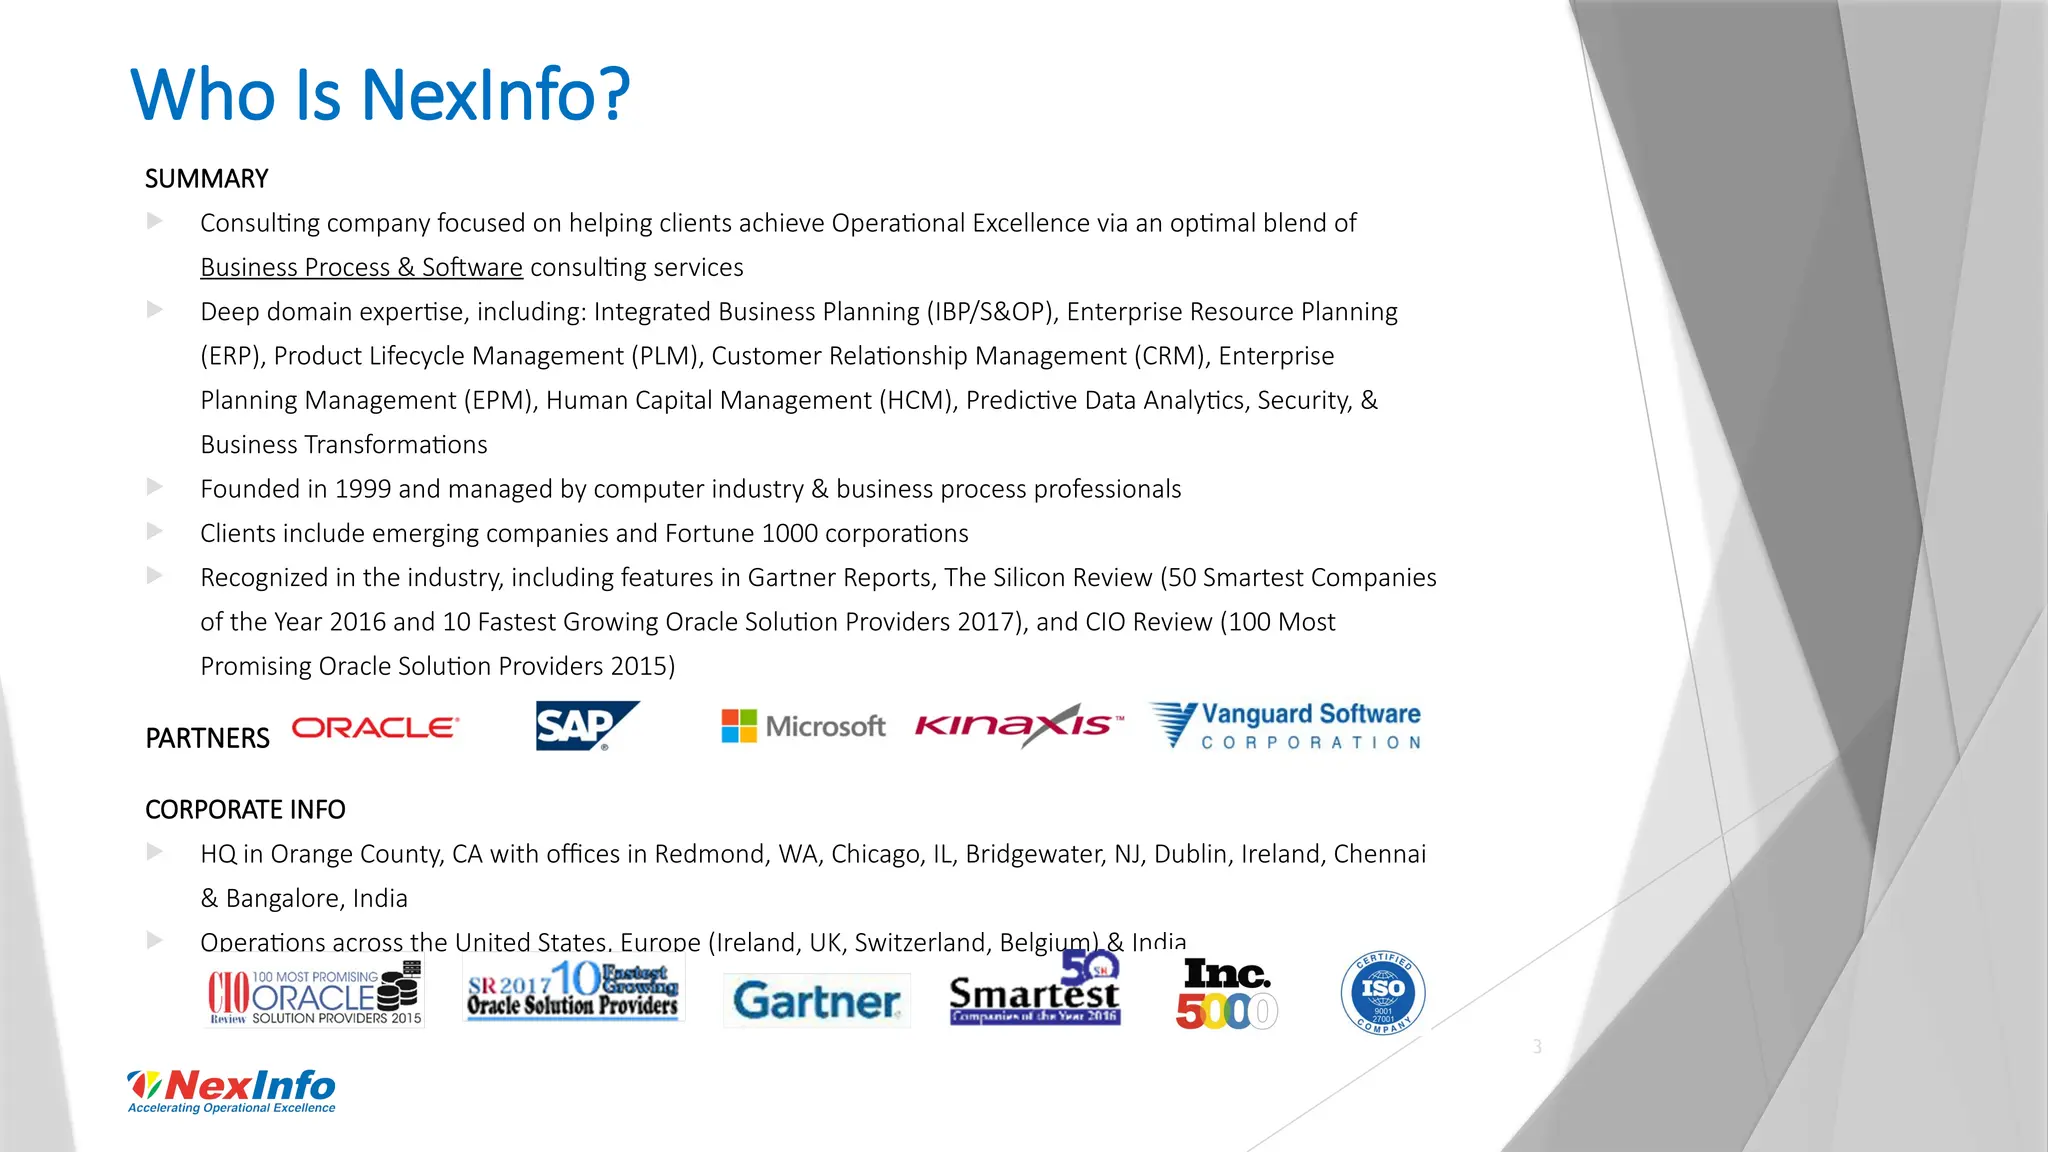
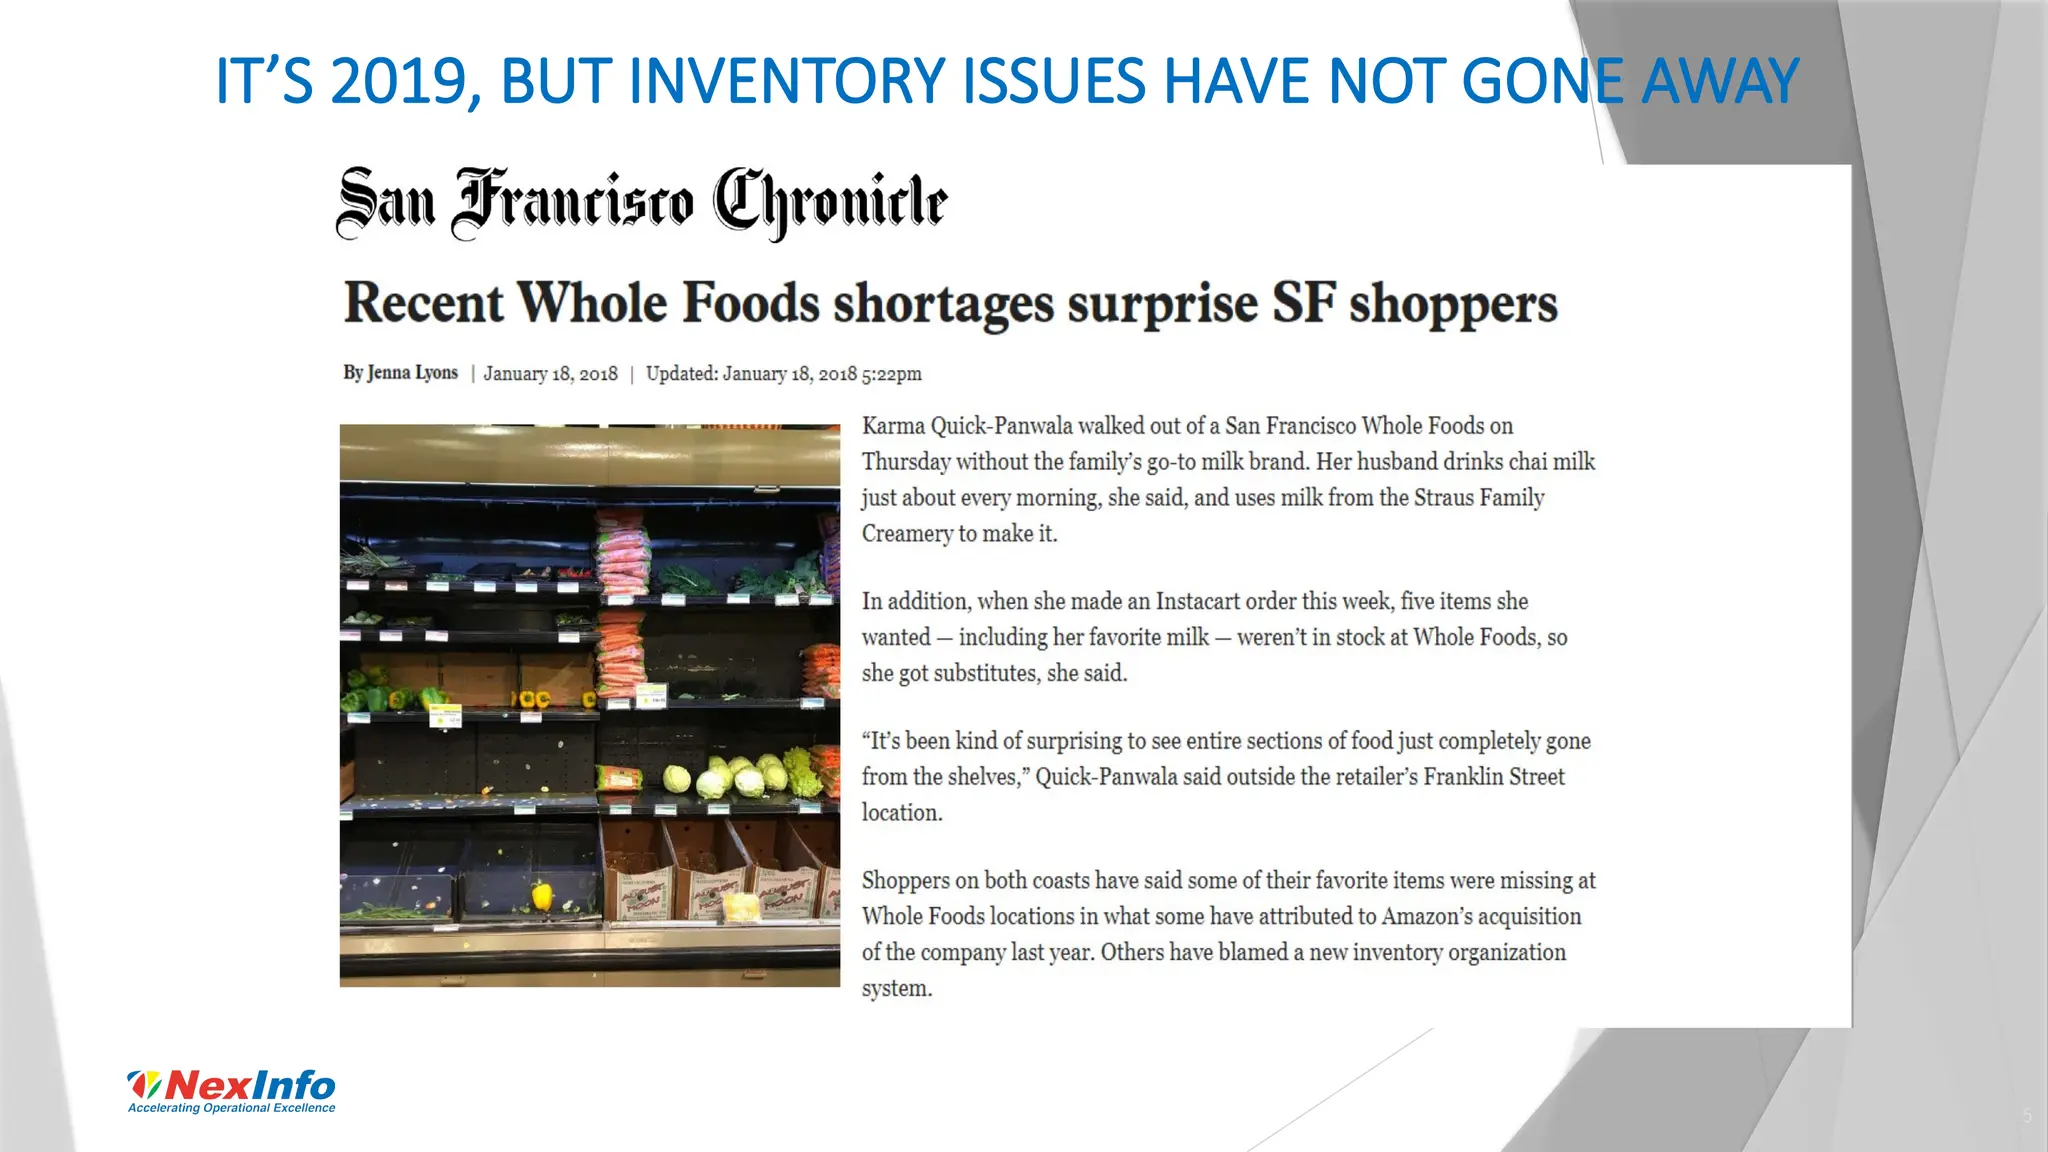
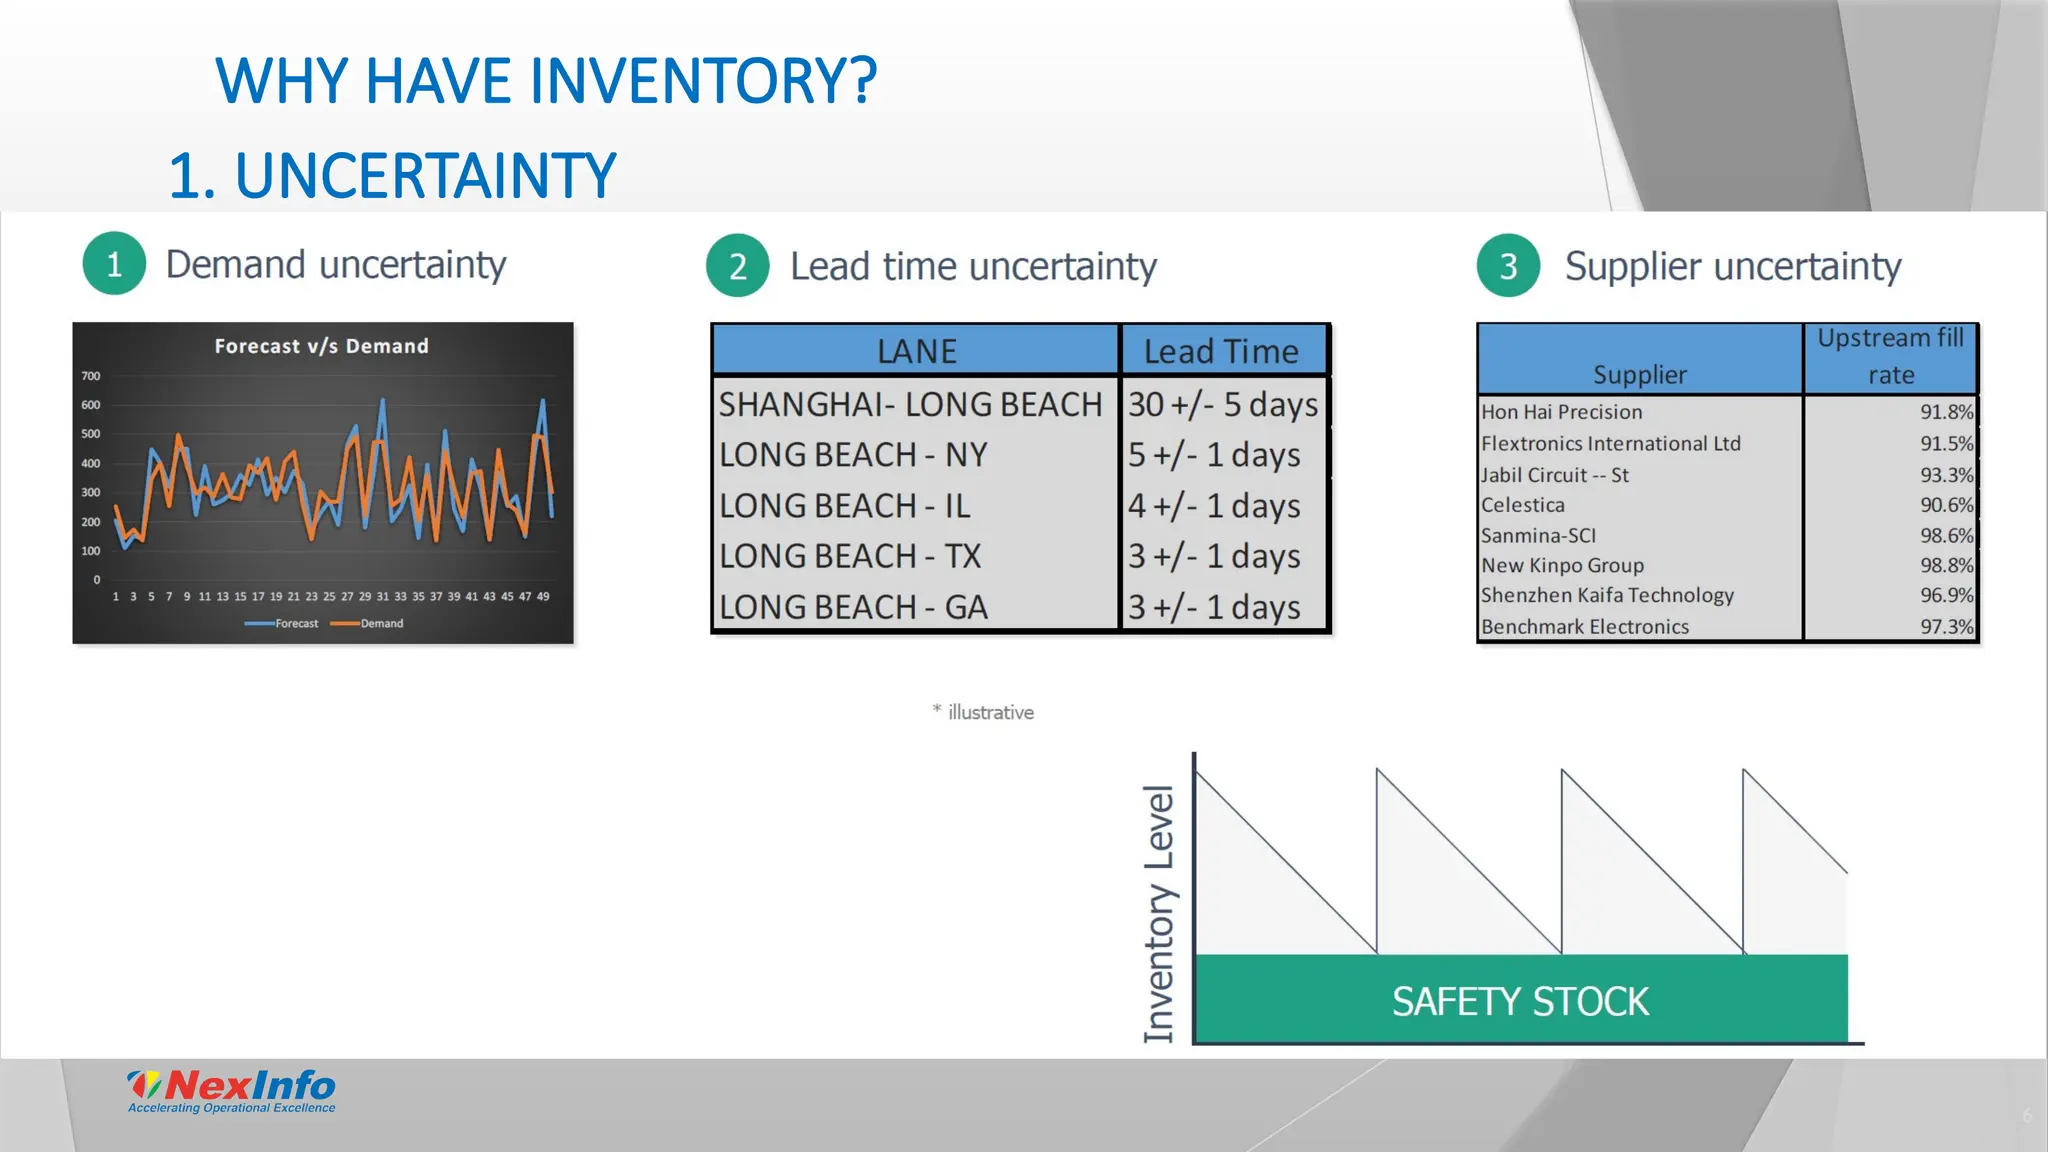
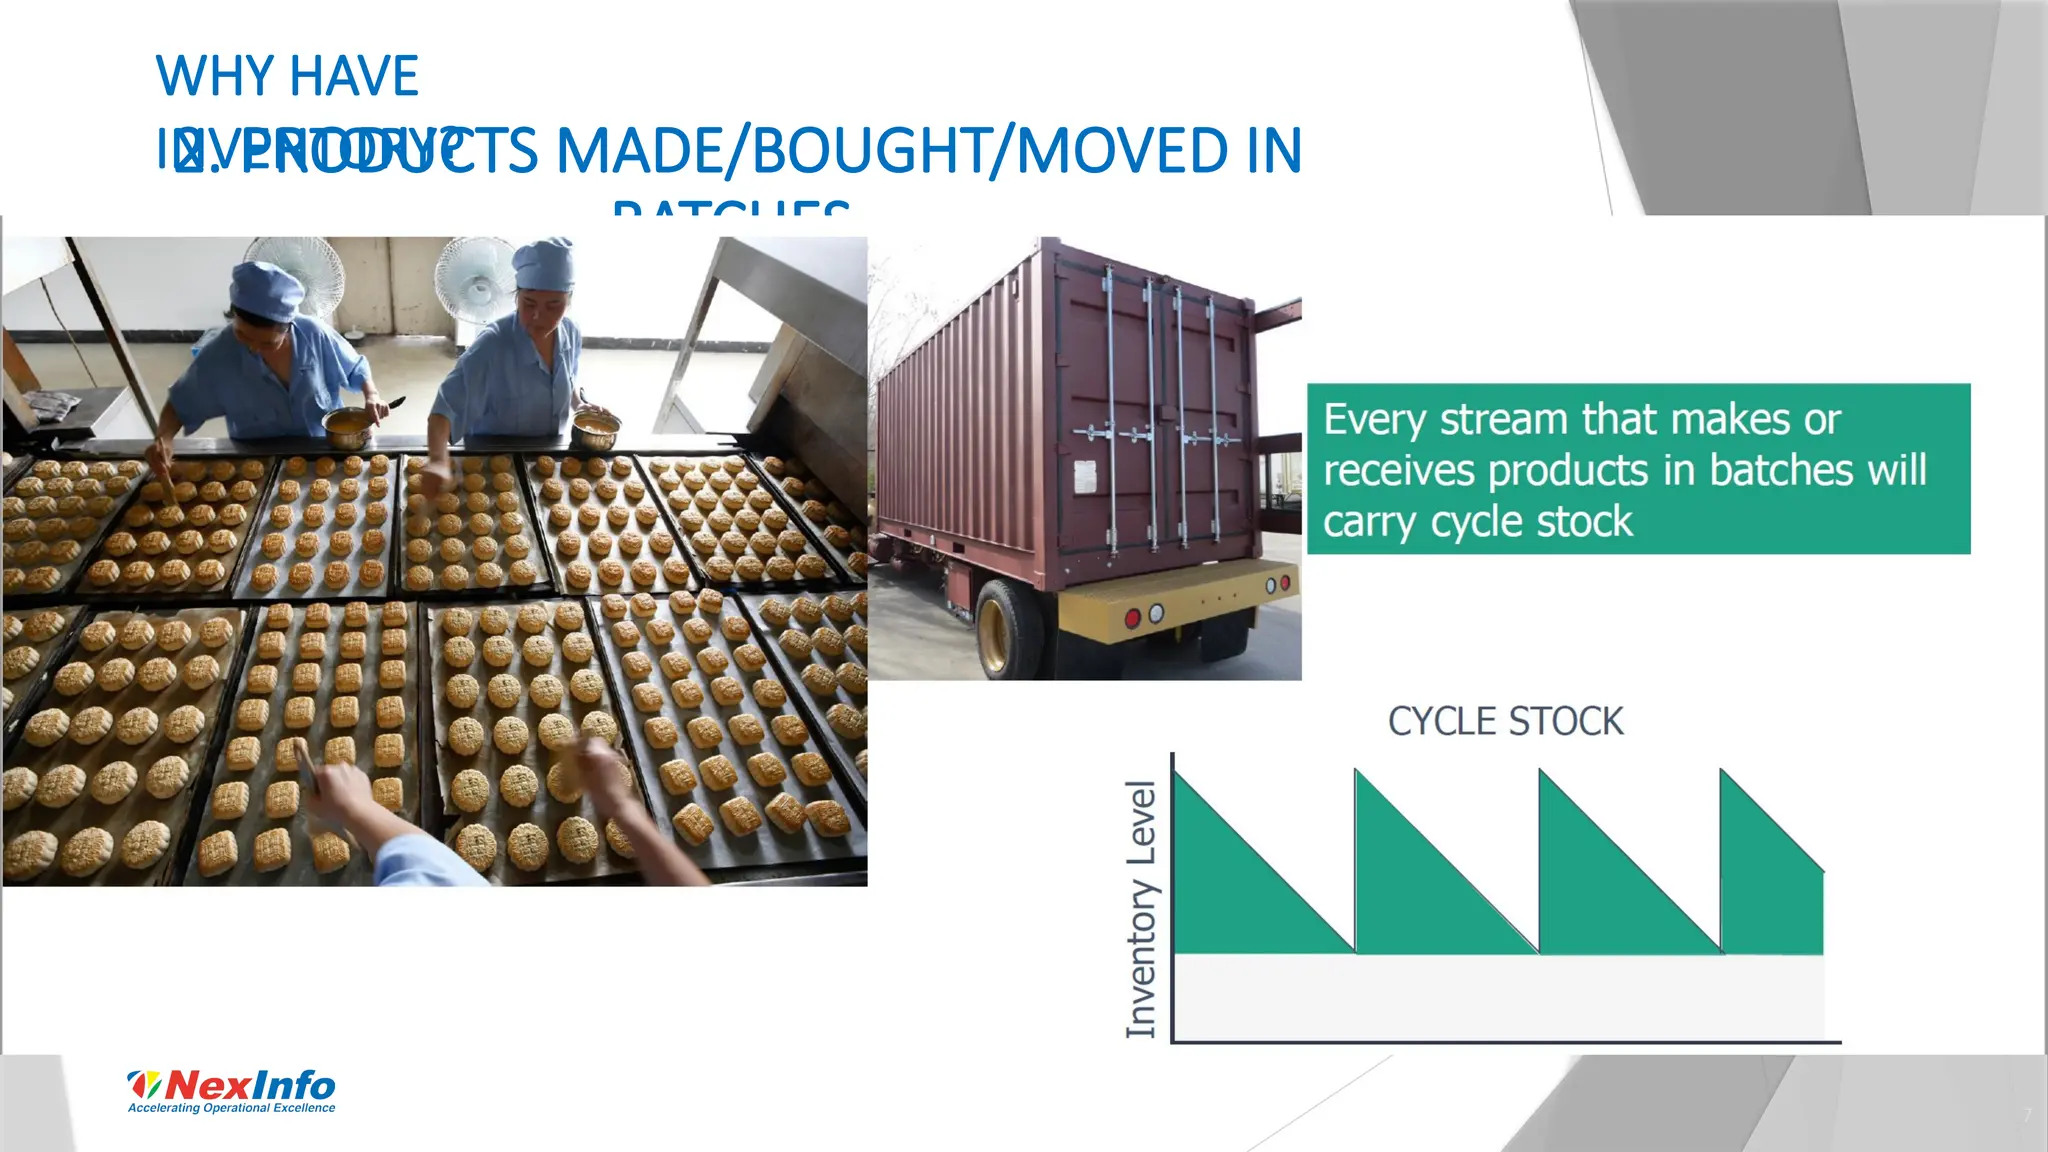
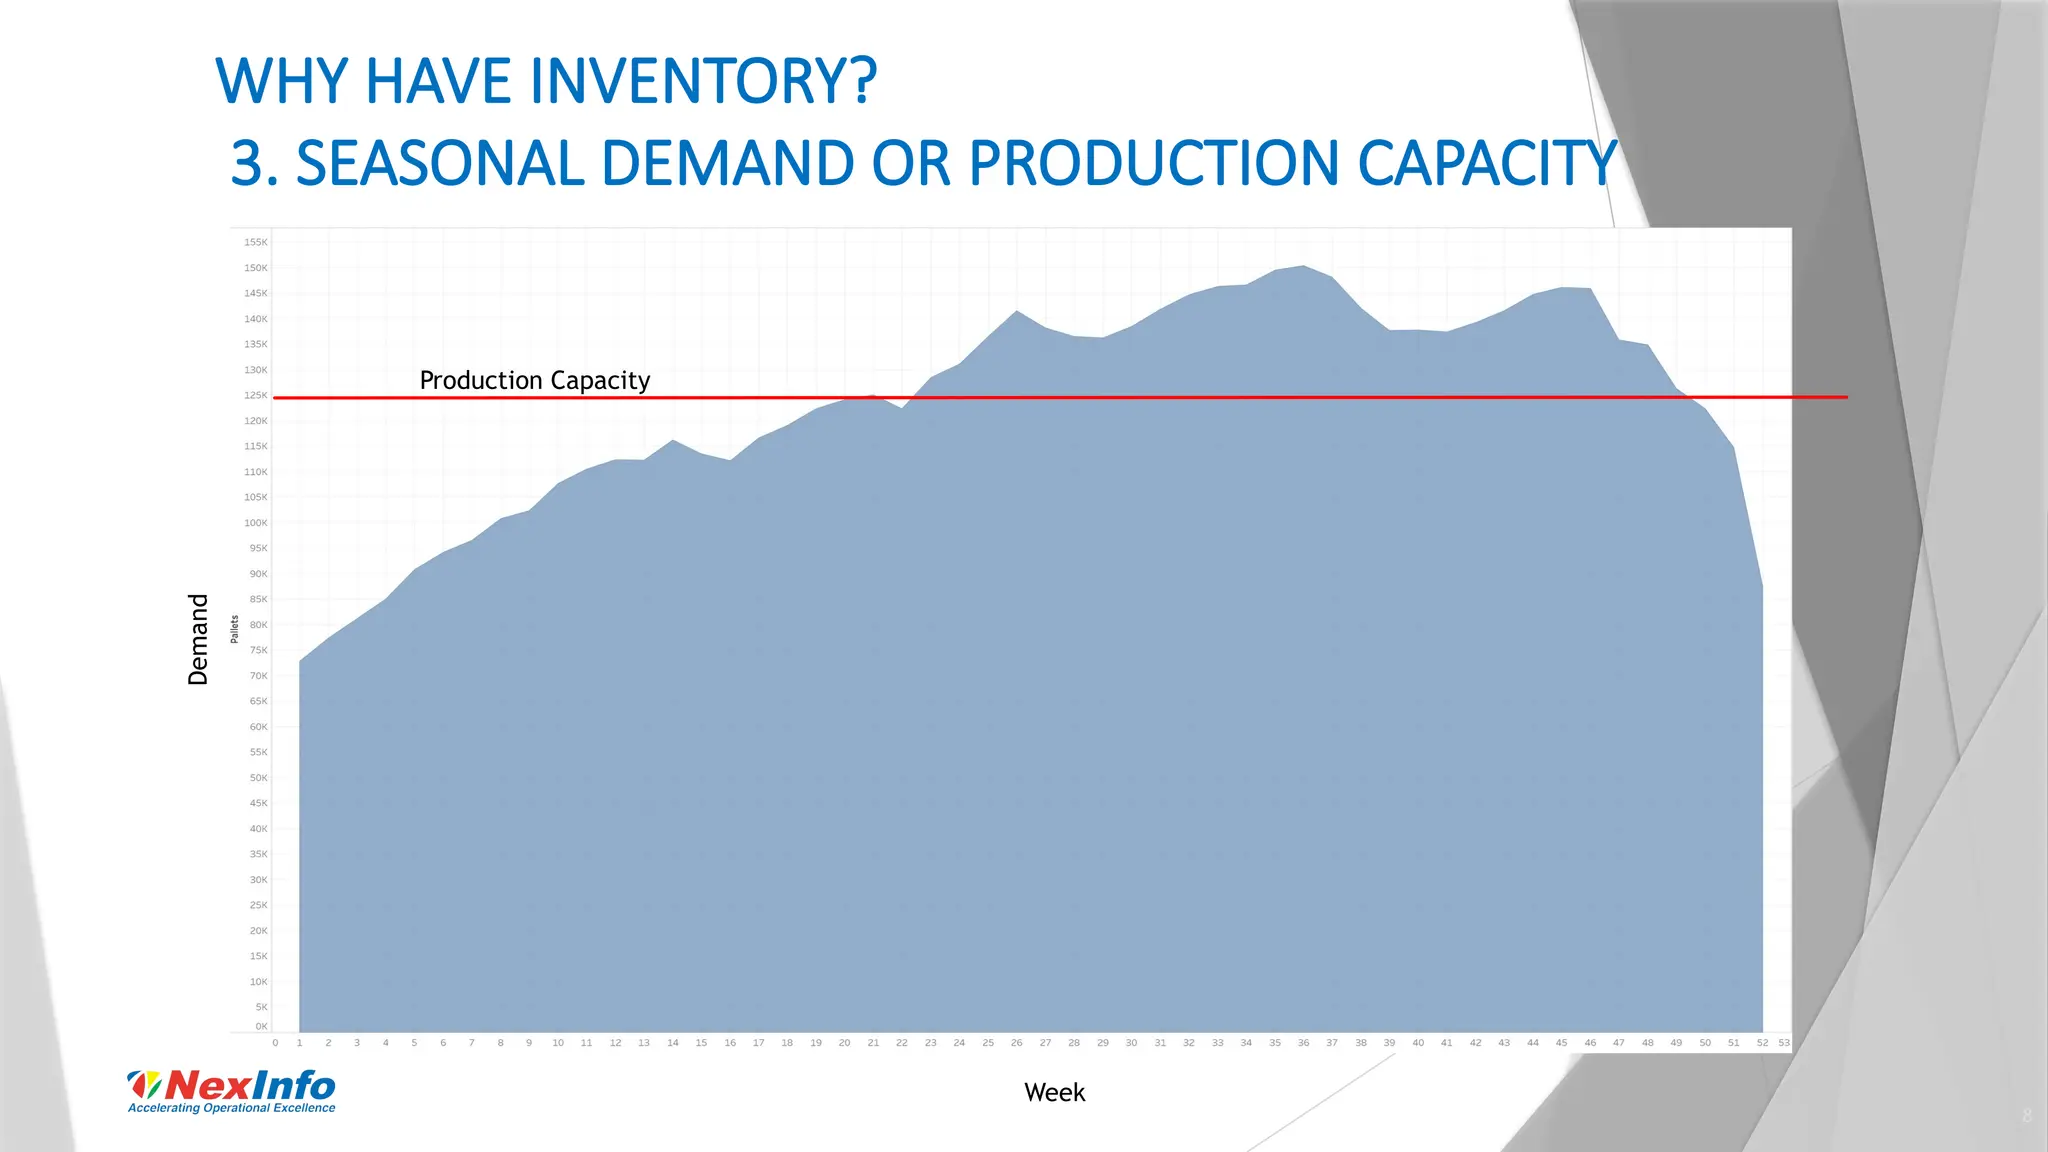
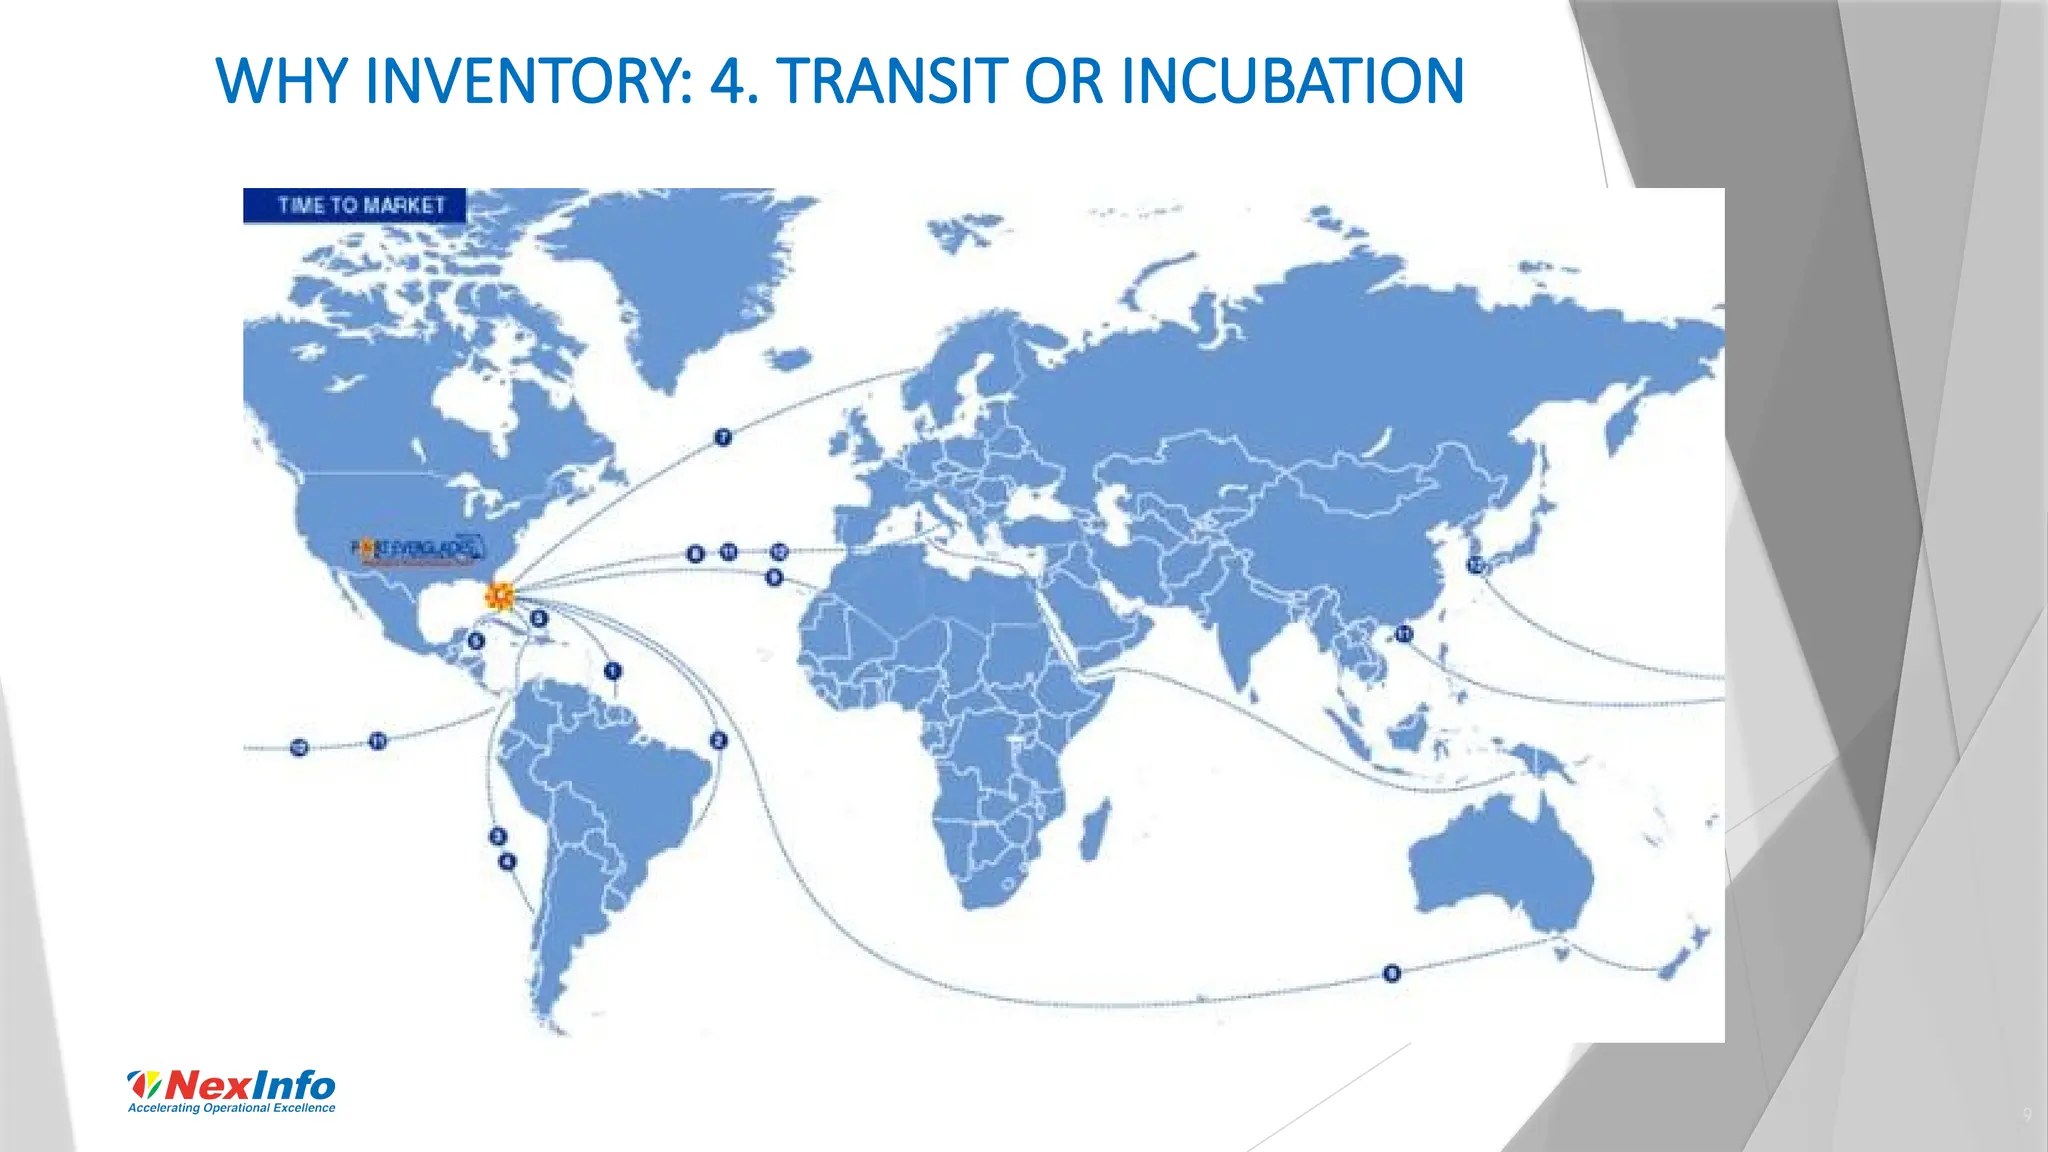
Inventory
Optimization &
Management
Presenter: Robert Wang
07/25/2019
@NexInfoSolution
2
Reminder Submitting Questions
3
Who Is NexInfo?
SUMMARY
 Consulting company focused on helping clients achieve Operational Excellence via an optimal blend of
Business Process & Software consulting services
 Deep domain expertise, including: Integrated Business Planning (IBP/S&OP), Enterprise Resource Planning
(ERP), Product Lifecycle Management (PLM), Customer Relationship Management (CRM), Enterprise
Planning Management (EPM), Human Capital Management (HCM), Predictive Data Analytics, Security, &
Business Transformations
 Founded in 1999 and managed by computer industry & business process professionals
 Clients include emerging companies and Fortune 1000 corporations
 Recognized in the industry, including features in Gartner Reports, The Silicon Review (50 Smartest Companies
of the Year 2016 and 10 Fastest Growing Oracle Solution Providers 2017), and CIO Review (100 Most
Promising Oracle Solution Providers 2015)
PARTNERS
CORPORATE INFO
 HQ in Orange County, CA with offices in Redmond, WA, Chicago, IL, Bridgewater, NJ, Dublin, Ireland, Chennai
& Bangalore, India
 Operations across the United States, Europe (Ireland, UK, Switzerland, Belgium) & India
Presenter
Information
 Name: Robert Wang
• Principal of Supply Chain Optimization, Nestle USA
• Adjunct Professor, Marshall School of Business at USC
 Experience:
In 2001, Robert joined the Business Analytics and Optimization Group at Nestle
USA. As a principal of the group, he is the mastermind behind many holistic
solutions for some very complex business problems. He specializes in using OR,
large-scale optimization, machine learning, statistics, visualization, and other
analytic techniques to solve business challenges. He has successfully lead the
design, development, and implementation of solutions for Supply Chain Network
Design, Inventory Optimization, Supply Planning, Deployment Planning, Network
Capacity Planning, Trade Optimization, and Transportation.
Robert also shares his expertise on campus as an Adjunct Professor at the
University of Southern California’s Marshall School of Business. Prior to joining
USC, Robert spent 7 years as a management consultant with Ernst & Young and
Deloitte & Touch.
5
IT’S 2019, BUT INVENTORY ISSUES HAVE NOT GONE AWAY
6
WHY HAVE INVENTORY?
1. UNCERTAINTY
7
WHY HAVE
INVENTORY?
2. PRODUCTS MADE/BOUGHT/MOVED IN
BATCHES
8
WHY HAVE INVENTORY?
3. SEASONAL DEMAND OR PRODUCTION CAPACITY
Demand
Week
Production Capacity
9
WHY INVENTORY: 4. TRANSIT OR INCUBATION
10
TYPES OF INVENTORY
 Safety
 Minimum required to maintain customer
service
 Cycle
 Created by production cycles due to
change-over cost
 Stock Build
 Due to limited production capacity
 Pipeline
 In-transit and quality hold
 Slack
 Unnecessary
11
INVENTORY MEASUREMENTS
 Relative Measure
 Relative to the demand
 Can be used to compare among companies
 Common Measurements
 Inventory Turns
 Weeks (Days) Cover
12
SAFETY STOCK
Safety Stock protects against uncertainty in demand and supply
 Uncertainty – demand forecast accuracy (FA), factory attainment,
lead time variance
 Risk – Customer service level
 Supply Chain Responsiveness (Also known as Replenishment Lead
Time) – planning time, frozen period, production, incubation,
transportation
 Note: longer the Replenishment Lead-Time (RLT), higher the
uncertainty
13
INVENTORY IMPACT OF CUSTOMER SERVICE
0
1
2
3
4
5
6
88% 90% 92% 94% 96% 98% 100%
Case-fill rate (up to 99.99%)
Safety
S
tock
W
eeks
C
over
Based on
• 67% forecast accuracy
• 30 day replenishment lead-time
• no supply uncertainty
Key Take-away:
Linear up to 98%, then exponential after
INVENTORY OVER TIME
01/23/2025
NexInfo
14
Inventory
Month
Safety
Pipeline
Build
Cycle
Max Inventory
Min Inventory
15
A DYNAMIC INVENTORY CALCULATOR
 Safety Stock
 Forecast Accuracy
 Replenishment Lead-Time
 Other Uncertainties
 Cycle Stock
 Product Cycle
 How do we know?
 Inventory Build
 Production Capacity
 How do we know?
 Pipeline Stock
 Transit / Incubation
 How do we know?
 Max Stock
 WSL
 Forecast Accuracy within WSL
Interactive Model:
InventoryCalculator
16
INVENTORY OPTIMIZATION PHASES
 Limited change to the current SC environment (short-term)
 No change on Forecast Accuracy (FA), Replenishment Lead-Time (RLT), Service Level Target
(SLT), etc.
 Use inventory model to calculate the right inventory level necessary to maintain the
current service level.
 Low hanging fruit: about 5%- 10% inventory reduction
 Optimize current SC environment (longer-term, continuous process)
 Improve FA
 Optimize Customer Service Level
 Right size production capacity
 Reduce RLT by Increasing production flexibility and shortening supplier response time
 Reducing Cycle and Build Inventory by optimizing production plan
 Improve production attainment
 Minimize production setup cost and time
 Savings opportunity: 10% to 30% reduction
17
OPTIMIZATION: CYCLE AND BUILD INVENTORY
 Minimize total costs impacted by production planning
 Inventory cost
 Production cost
 Costs of labor and over-time
 Setup or change-over cost
 Costs of shortage and freshness
 Master Production Scheduling Optimization (MPSO) Model
 Optimize production frequency and batch size for every product on a production line
 Production line capacity constrained
 Perform What-If analysis to optimize line capacity, over-time usage
 Evaluate options for production flexibility and capability
18
SERVICE LEVEL OPTIMIZATION
 This trade-off could be
different for every different
product and industry
 A good inventory optimization
software should have this
capability
 A Tableau Model
 Cost vs Fill Rate Dashboard
 Sales Lost Factor
 WACC
 A Story Behind
 A new inventory initiative given
from the top for COF 99.5%
 Use case: education
Service Level
Costs 90% 95% 100%
Cost of Lost
Sales
Cost of
Inventory
Combined
Costs
Optimal Service
Level for Lowest
Costs
19
OPTIMIZATION: NETWORK DESIGN
 Minimize Total Costs Impacted
 Transportation
 Inventory
 Fixed Distribution
 Handling
 Network Configuration
 Plant Direct
 DC
 Hub & Spoke
 Inventory Strategy
 Push
 Pull
20
OPTIMIZATION: SUPPLY CHAIN COLLABORATION
 Think out side of the box
 Walmart Case for Retail Business
 DOT Food Case for Food Service
 Background
 Distributor for Food Service Industry
 Has its own SC network
 Value proposition
 Collaboration Opportunity
 Benefit Sharing
21
NETWORK COLLABORATION
 Current State
 Future State
HUB/DC
Factory Spoke
Customer Store
MFG SC Network
Regional DC Forward DC
Customer SC Network
HUB/DC
MFG 1: FACTORY
Customer Store
Collaborative Network
Forward DC
MFG 2: FACTORY
MFG 3: FACTORY
Major
Inventor
y
Major
Inventor
y
Minor
Inventor
y
Minor
Inventor
y
Minor
Inventor
y
Minor
Inventory
Minor
Inventory
Major
Inventory
22
Q&A
23
Contact Us
HEADQUARTERS
615 W Civic Center Drive, Suite 350
Santa Ana, CA 92701
EMAIL
LetsTalk@nexinfo.com
TELEPHONE
(714) 277-3600
Bellevue, WA
Orange, CA
Santa Ana, CA
Bridgewater, NJ
Chicago, IL
Dublin,
Ireland
Chennai,
India
Bangalore,
India
24
Appendix

Mastering Inventory Optimization for Business Success – NexInfo

  • 1.
  • 2.
  • 3.
    3 Who Is NexInfo? SUMMARY Consulting company focused on helping clients achieve Operational Excellence via an optimal blend of Business Process & Software consulting services  Deep domain expertise, including: Integrated Business Planning (IBP/S&OP), Enterprise Resource Planning (ERP), Product Lifecycle Management (PLM), Customer Relationship Management (CRM), Enterprise Planning Management (EPM), Human Capital Management (HCM), Predictive Data Analytics, Security, & Business Transformations  Founded in 1999 and managed by computer industry & business process professionals  Clients include emerging companies and Fortune 1000 corporations  Recognized in the industry, including features in Gartner Reports, The Silicon Review (50 Smartest Companies of the Year 2016 and 10 Fastest Growing Oracle Solution Providers 2017), and CIO Review (100 Most Promising Oracle Solution Providers 2015) PARTNERS CORPORATE INFO  HQ in Orange County, CA with offices in Redmond, WA, Chicago, IL, Bridgewater, NJ, Dublin, Ireland, Chennai & Bangalore, India  Operations across the United States, Europe (Ireland, UK, Switzerland, Belgium) & India
  • 4.
    Presenter Information  Name: RobertWang • Principal of Supply Chain Optimization, Nestle USA • Adjunct Professor, Marshall School of Business at USC  Experience: In 2001, Robert joined the Business Analytics and Optimization Group at Nestle USA. As a principal of the group, he is the mastermind behind many holistic solutions for some very complex business problems. He specializes in using OR, large-scale optimization, machine learning, statistics, visualization, and other analytic techniques to solve business challenges. He has successfully lead the design, development, and implementation of solutions for Supply Chain Network Design, Inventory Optimization, Supply Planning, Deployment Planning, Network Capacity Planning, Trade Optimization, and Transportation. Robert also shares his expertise on campus as an Adjunct Professor at the University of Southern California’s Marshall School of Business. Prior to joining USC, Robert spent 7 years as a management consultant with Ernst & Young and Deloitte & Touch.
  • 5.
    5 IT’S 2019, BUTINVENTORY ISSUES HAVE NOT GONE AWAY
  • 6.
  • 7.
    7 WHY HAVE INVENTORY? 2. PRODUCTSMADE/BOUGHT/MOVED IN BATCHES
  • 8.
    8 WHY HAVE INVENTORY? 3.SEASONAL DEMAND OR PRODUCTION CAPACITY Demand Week Production Capacity
  • 9.
    9 WHY INVENTORY: 4.TRANSIT OR INCUBATION
  • 10.
    10 TYPES OF INVENTORY Safety  Minimum required to maintain customer service  Cycle  Created by production cycles due to change-over cost  Stock Build  Due to limited production capacity  Pipeline  In-transit and quality hold  Slack  Unnecessary
  • 11.
    11 INVENTORY MEASUREMENTS  RelativeMeasure  Relative to the demand  Can be used to compare among companies  Common Measurements  Inventory Turns  Weeks (Days) Cover
  • 12.
    12 SAFETY STOCK Safety Stockprotects against uncertainty in demand and supply  Uncertainty – demand forecast accuracy (FA), factory attainment, lead time variance  Risk – Customer service level  Supply Chain Responsiveness (Also known as Replenishment Lead Time) – planning time, frozen period, production, incubation, transportation  Note: longer the Replenishment Lead-Time (RLT), higher the uncertainty
  • 13.
    13 INVENTORY IMPACT OFCUSTOMER SERVICE 0 1 2 3 4 5 6 88% 90% 92% 94% 96% 98% 100% Case-fill rate (up to 99.99%) Safety S tock W eeks C over Based on • 67% forecast accuracy • 30 day replenishment lead-time • no supply uncertainty Key Take-away: Linear up to 98%, then exponential after
  • 14.
  • 15.
    15 A DYNAMIC INVENTORYCALCULATOR  Safety Stock  Forecast Accuracy  Replenishment Lead-Time  Other Uncertainties  Cycle Stock  Product Cycle  How do we know?  Inventory Build  Production Capacity  How do we know?  Pipeline Stock  Transit / Incubation  How do we know?  Max Stock  WSL  Forecast Accuracy within WSL Interactive Model: InventoryCalculator
  • 16.
    16 INVENTORY OPTIMIZATION PHASES Limited change to the current SC environment (short-term)  No change on Forecast Accuracy (FA), Replenishment Lead-Time (RLT), Service Level Target (SLT), etc.  Use inventory model to calculate the right inventory level necessary to maintain the current service level.  Low hanging fruit: about 5%- 10% inventory reduction  Optimize current SC environment (longer-term, continuous process)  Improve FA  Optimize Customer Service Level  Right size production capacity  Reduce RLT by Increasing production flexibility and shortening supplier response time  Reducing Cycle and Build Inventory by optimizing production plan  Improve production attainment  Minimize production setup cost and time  Savings opportunity: 10% to 30% reduction
  • 17.
    17 OPTIMIZATION: CYCLE ANDBUILD INVENTORY  Minimize total costs impacted by production planning  Inventory cost  Production cost  Costs of labor and over-time  Setup or change-over cost  Costs of shortage and freshness  Master Production Scheduling Optimization (MPSO) Model  Optimize production frequency and batch size for every product on a production line  Production line capacity constrained  Perform What-If analysis to optimize line capacity, over-time usage  Evaluate options for production flexibility and capability
  • 18.
    18 SERVICE LEVEL OPTIMIZATION This trade-off could be different for every different product and industry  A good inventory optimization software should have this capability  A Tableau Model  Cost vs Fill Rate Dashboard  Sales Lost Factor  WACC  A Story Behind  A new inventory initiative given from the top for COF 99.5%  Use case: education Service Level Costs 90% 95% 100% Cost of Lost Sales Cost of Inventory Combined Costs Optimal Service Level for Lowest Costs
  • 19.
    19 OPTIMIZATION: NETWORK DESIGN Minimize Total Costs Impacted  Transportation  Inventory  Fixed Distribution  Handling  Network Configuration  Plant Direct  DC  Hub & Spoke  Inventory Strategy  Push  Pull
  • 20.
    20 OPTIMIZATION: SUPPLY CHAINCOLLABORATION  Think out side of the box  Walmart Case for Retail Business  DOT Food Case for Food Service  Background  Distributor for Food Service Industry  Has its own SC network  Value proposition  Collaboration Opportunity  Benefit Sharing
  • 21.
    21 NETWORK COLLABORATION  CurrentState  Future State HUB/DC Factory Spoke Customer Store MFG SC Network Regional DC Forward DC Customer SC Network HUB/DC MFG 1: FACTORY Customer Store Collaborative Network Forward DC MFG 2: FACTORY MFG 3: FACTORY Major Inventor y Major Inventor y Minor Inventor y Minor Inventor y Minor Inventor y Minor Inventory Minor Inventory Major Inventory
  • 22.
  • 23.
    23 Contact Us HEADQUARTERS 615 WCivic Center Drive, Suite 350 Santa Ana, CA 92701 EMAIL LetsTalk@nexinfo.com TELEPHONE (714) 277-3600 Bellevue, WA Orange, CA Santa Ana, CA Bridgewater, NJ Chicago, IL Dublin, Ireland Chennai, India Bangalore, India
  • 24.

Editor's Notes

  • #3 We are company with a blend of Business Process & Software Consulting We follow the Level 1-2-3 methodology to arrive at a Future business process and get key stakeholder sign offs We are an Oracle Platinum Partner We implement Oracle Cloud (ALL Clouds – ERP (Financials), SCM, Sales, Service, Planning Central, WMS, HCM etc.) We are in the midst of 5 Cloud implementations – one going live next month – full footprint Expertise in on-premise software – EBS, VCP, JDE, Peoplesoft We are a 200 + people company with a Global Delivery Model – we deliver in the US, Europe and South America We have experience running 100 + TURNKEY TRANSFORMATION PROJECTS in the last 18 + years We have a lot of industry expertise – Pharmaceuticals, LifeSciences, High Technology, Discrete and Process manufacturing to name a few. We have been around since 1999, that’s 18 years. We have focused on supply chain and the technologies that goes around supply chain. Product life cycle management and the technologies that go enabling product life cycle management. And finally we have done a lot of compliance and IT government type of projects. We have been recognized by a few organizations including Silicon Review, CIO, Gartner-they were following us endlessly because we specialized in supply chain area. From a SW perspective, We deliver solutions in different software, Oracle EBS, VCP, JDE, PLM + Agile, Enovia, TeamCenter + SAP – ECC, BW and APO + Microsoft Sharepoint, Active Directory etc. We have a worldwide presence with operations and localized resources across US, in Ireland & United Kingdom (Europe), & India (Asia) We have a very large footprint in what we delivery – Forecasting, Demand Management, Manufacturing, Supply Planning, Collaboration, Product Lifecycle Management, etc. We typically run about 15 – 20 projects concurrently We are an organization with a dedicated sales team, a solution development team and a delivery team – that provides structure again.
  • #4 Share a personal story about my internship for inventory reduction project Take away learned from the session to your project immediately
  • #5 Key Points: With all the new technologies, Inventory issue is still around Companies in the rapid growth tend to ignore inventory management Reported on CNN last summer: Lowe had inventory issues that forced them to close stores
  • #6 Four Reasons drives 4 types of inventory, we will go over with each
  • #7 For economic scale reason, we always like to do things in batch: Order, Shipment, Production
  • #8 Seasonal nature of demand Limited production capacity
  • #9 Products produced off production may not be able to fulfill demand immediately: Incubation Transit
  • #10 To summarize: 4 types of business needs 4 types of inventory Anything beyond can be eliminated
  • #11 Measure Accountant Warehouse Manager Supply Chain Expert
  • #12 Uncertainty – Forecast Accuracy Risk Level – Service Target
  • #13 Service Level Target: Customer Service decision that impact SC Forecast Accuracy Impact SC
  • #14 Each type of Inventory has its own purpose, not to be mixed.
  • #15 Visualization Tool Parameters of your business environment Required inventory to support your business goal Play the sliders to visually see
  • #16 I will choose a few examples to discuss improvement projects
  • #17 Supply Planning is very complex planning activity Many constraints Many costs impacted
  • #19 Supply Chain network impact inventory Material flow Network Structure Safety Stock, Pipeline Stock Number of DCs where you hold safety stock: More DCs, harder to forecast, therefore more safety stock to carry Push vs Pull
  • #21  Demand Visibility Direct POS visibility to eliminate any possible Bull Whip Effect Collaborative Network Operators Large retailers like Walmart or Amazon 3 PL Providers Inventory: Stocking Locations reduced from 6 to 4 Much higher forecast accuracy Much less safety stock Transportation: Much High Payload Shorter Order Delivery Time
  • #26 Production resources are typically shared for a group of products. If inventory build cannot be avoid, what strategy can we have to minimize supply chain costs: FGS vs SFG Warehouse Shelf-Life: Long vs Short COGS: High vs Low Forecast Accuracy: High vs. Low
  • #30 Risk pulling Effect on Forecast Accuracy
  • #31 Raw and Pack Inventory Management - It falls into this category