Downloaded 10 times


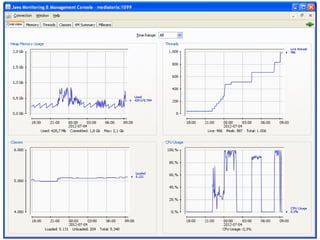

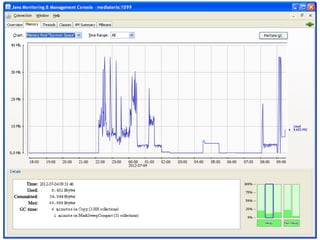
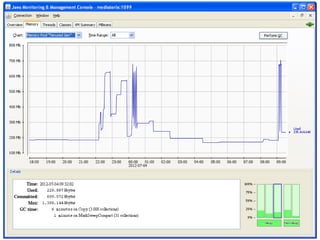
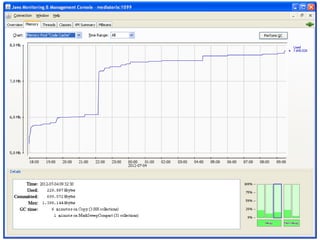
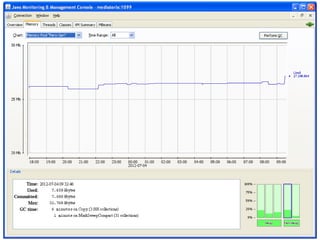

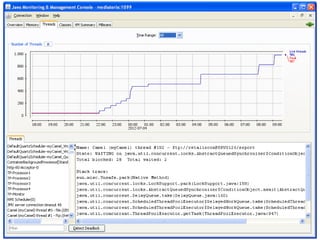
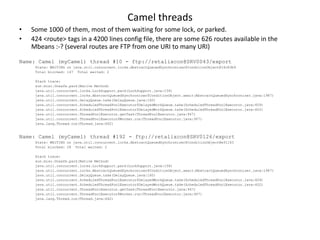
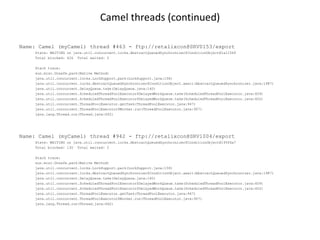
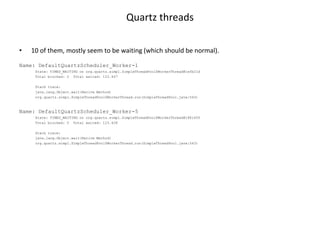

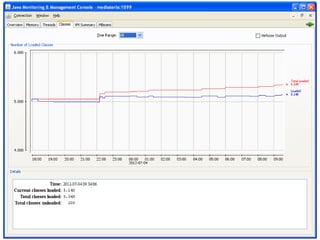
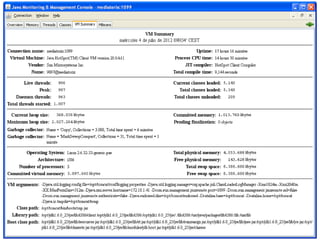
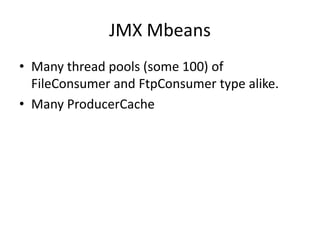
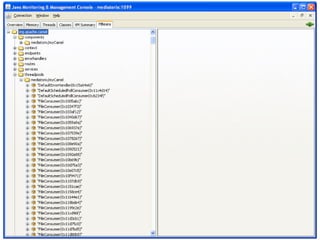
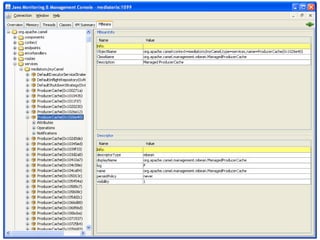
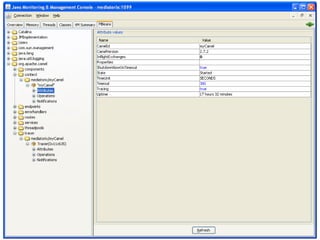

This document contains screenshots and data from JMX monitoring of a Camel server experiencing performance issues. It shows there are around 1000 Camel threads, most waiting on locks or parked. The configuration file contains 424 routes but the MBeans show 626 available routes. The screenshots also show details on specific stalled Camel and Quartz threads, as well as numerous thread pools and ProducerCache instances that could be related to the performance problems.


![Accumulo Summit 2015: Zookeeper, Accumulo, and You [Internals]](https://cdn.slidesharecdn.com/ss_thumbnails/zookeeperaccumuloandyou-150501220518-conversion-gate02-thumbnail.jpg?width=640&height=640&fit=bounds)