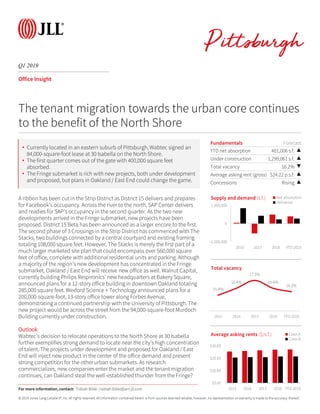
- The first quarter saw 401,006 square feet of net absorption in the Pittsburgh market. Vacancy rates decreased to 16.2% while average asking rents increased.
- In the Fringe submarket, two new developments delivered - District 15 for Facebook and SAP Center for SAP. Additional projects are under development or proposed in this submarket and in Oakland/East End.
- Wabtec's decision to relocate operations to North Shore exemplifies strong demand to locate near the city's talent pool. New projects in Oakland/East End could increase competition for other urban submarkets.
The Pittsburgh office market had quite the summer in 2018. More tenants flock to the urban core, 420 Boulevard of the Allies sold, and District Fifteen is fully leased before delivering.
2019 ended the decade on high notes, as Pittsburgh gets its first VC-funded tech unicorn and the former Civic Arena site gets an anchor tenant for the tower.
Outlook
While not as robust as 2018, the market is expected to
maintain its momentum over the course of 2019. Although
market conditions are increasingly becoming landlord
favourable, the market remains quite competitive. Large
occupiers seeking space in the Central area are now looking
to new developments to satisfy their needs as there are very
few large contiguous blocks of available space left in the
market. In the Financial Core, only six options for tenants
seeking 50,000+ sf of space remain. Despite the
disappearance of large available space options and the
significant downward pressure on vacancy rates, landlords
have only marginally increased rent expectations at
approximately 2% annually. A slight year-over-year increase in
average net asking rates is anticipated as a result of Class
AAA deliveries; however, the range of rates is not expected to
change
JLL Grand Rapids Office Insight & Statistics - Q3 2018Harrison West
Overall vacancy in the Grand Rapids metro is currently 10.2 percent, down 2.1 percent year-over-year. Asking rents downtown seem to have leveled off this year, consistently hovering around $20.00 per-square-foot each quarter and currently sitting at $20.45 per-square-foot. There are 174,000 square feet of office space under construction, most of which is in the Warner Building development, set to deliver in early 2019.
Pittsburgh industrial market vacancy rates are declining and asking rents are increasing. New speculative construction reveals a healthy investor appetite in a growing market.
JLL West Michigan Industrial Insight & Statistics - Q1 2020Harrison West
While West Michigan market has seen historically low vacancy figures and impressive rent growth the past few years, we should expect things to slow in Q2 as the effects of the COVID-19 pandemic begin to take hold. Market fundamentals remain stable; however, given the current uncertainty, we expect leasing and sales activity to slow considerably in the near term as occupiers evaluate their current and future space needs.
We are pleased to share the second quarter office research reports for Cincinnati. Below you will find a link to the reports as well as a summary of the key themes examined in the second quarter research.
New development is multiplying in the Fringe and Oakland / East End submarket. Demand from the technology industry continues to brew. However, leasing activity has not yet brought absorption back to positive.
JLL Detroit Office Insight & Statistics - Q4 2019Harrison West
2019 marked another year of positive growth for the Detroit office market. Vacancies fell 1.6 percent year-over-year, while rent growth flattened. In the fourth quarter, London-based WPP grabbed headlines with its announcement to lease nine floors of the vacant Marquette Building at 243 W. Congress Street, investing over $19.2 million and adding 1,000 jobs downtown.
JLL Grand Rapids Office Insight & Statistics - Q1 2018Harrison West
After a few years of steady growth, rents seems to have plateaued, while vacancies have stabilized. Conditions are likely to remain steady until the new Class A supply begins to deliver. The west side remains a hot market for both leasing and development activity, and we expect to see some tenants leaving downtown to explore opportunities in cheaper, trendier submarkets.
JLL Detroit Office Insight & Statistics - Q3 2018Harrison West
Conditions in Detroit’s office market remain stable, even amidst a slight uptick in vacancy the past two quarters. Current total vacancy in the urban and suburban submarkets are 15.7 percent and 22.3 percent, respectively. Asking rents market-wide have increased 1.0 percent in the past three months, currently at $19.65 per-square-foot. Detroit’s office market saw more positive headlines in the third quarter on the heels of Ford’s Michigan Central Station announcement. Cadillac made public their intention to move back to the Detroit area after almost four years in Manhattan and Chemical Bank announced plans to construct a 250,000-square-foot headquarters in downtown Detroit.
With robotics getting all of the attention and an already well-established healthcare industry, Pittsburgh is ready for an increase in life science activity.
JLL Detroit Office Insight & Statistics - Q4 2017Harrison West
Total vacancy fell to 18.5 percent across the metro, while average asking rents rose to $19.18. In total, 885,582 square feet of office space was absorbed in 2017. Multiple significant lease transactions took place in the fourth quarter, perhaps most notably Google’s announcement to move from Birmingham to a 17,000-square-foot space at the office component of the new Little Caesars Arena
The third quarter saw the delivery of the downtown streetcar and the GE Global Operations Center at the banks, both projects were two of Cincinnati’s most highly anticipated deliveries in years. Developers continued to cautiously move forward with planned projects as they look to land large users for preleasing before they begin construction.
JLL Grand Rapids Office Insight & Statistics - Q3 2019Harrison West
While rent growth has leveled off in the Grand Rapids office market, vacancies compressed further in the third quarter. Average asking rents are $18.74 per square foot across the market, while market-wide vacancy currently sits at 8.5 percent, down 1.7 percent over the same period. The high-profile Warner Building development delivered fully-leased in August, adding 118,000 square feet to the downtown Class A inventory.
JLL Detroit Office Insight & Statistics – Q2 2016Aaron Moore
The quagmire persists – high demand and not enough supply. CBD vacancy rates for the second quarter were 14.5 percent as office construction has come to a virtual halt.
JLL Detroit Office Insight & Statistics - Q4 2018Harrison West
The fourth quarter of 2018 was highlighted by yet another high-profile groundbreaking, as Bedrock began work on the Monroe Blocks development, a mixed-use project totaling over 1.4 million square feet that will bring approximately 847,000 square feet to the CBD office inventory. Market-wide, total vacancy fell by 60 basis points to 20.2 percent as 149,007 square feet was absorbed, while average asking rents rose by 1.0 percent up to $19.85 per square foot.
JLL Detroit Office Insight & Statistics - Q1 2019Harrison West
Over 202,000 square feet of space was absorbed in the first quarter, with notable transactions taking place in the city and the suburbs. Chicago-based Coyote Logistics made headlines with the announcement of a 58,000-square-foot lease at Bedrock’s Assembly Building at 1700 West Fort Street, bringing 500 new jobs to the burgeoning Corktown neighborhood. Google announced plans to expand their 29,000-square-foot office at Little Caesars arena.
JLL Detroit Office Insight & Statistics - Q1 2018Harrison West
2018 is poised to be another great year of growth for Detroit’s office market. With transformational developments underway like the Hudson’s site downtown, and others in the pipeline like the Monroe Block and the to-be-determined jail site development, the buzz downtown is palpable.
JLL Grand Rapids Office Insight & Statistics - Q2 2019Harrison West
Market-wide vacancies fell to 9.3 percent, as just over 81,000 square feet of space was absorbed. Average asking rents came in at $19.18 per-square-foot, a 6.4 percent increase year-over-year, with Downtown’s Class A market leading all submarkets with an average asking rent of $22.80 per-square-foot...
JLL Detroit Office Insight & Statistics - Q2 2019Harrison West
The second quarter in the Detroit office market brought a decrease in vacancy and continued rent growth. Total vacancy across the market is currently at 18.5 percent, while average asking rents are $19.85 per square foot, representing a 2.1 percent increase year-over-year...
Colliers St. Louis 1Q20 Industrial Market SnapshotColliersSTL
Healthy Start but Impact of COVID-19 Remains to be Seen
The St. Louis industrial market started 2020 strong with positive absorption, a healthy construction pipeline and a historically low vacancy rate. However, it is unclear what impact COVID-19 shutdown will have on the industrial sector. Nevertheless, the supply chain, especially for consumer goods, is working hard to keep up with demand. Until the stay-at-home orders have ceased and governments and companies figure out how to best operate in this environment, commercial real estate experts are working with occupiers and building owners to ensure that they can continue to operate when possible and be able to bounce back when able.
Pittsburgh is going into the fourth quarter with positive absorption. The market's unique position as a central distribution hub and hub to a petrochemical facility will continue to drive activity.
JLL Cincinnati Industrial Outlook - Q3 2016Ross Bratcher
Construction activity continued to trend smaller as buildings of less than 300,000 square feet accounted for the majority of projects in the development pipeline. Class B leasing activity outpaced Class A in the third quarter as Class B landlords increase tenant improvement packages to become more competitive. Two speculative projects commenced in the Airport submarket combining for a total of 415,800 square feet.
JLL Detroit Office Insight & Statistics - Q3 2019Harrison West
As we look ahead to the end of 2019, we can expect the stable conditions in the Detroit office market to remain. Downtown’s Class A vacancy remains extremely tight outside of the Renaissance Center and will likely stay that way until new inventory is added to the market.
Leasing activity slowly recovers to pre-pandemic levels. While the market continues to feel the impact from COVID, Duolingo expands 38,000 s.f. at Liberty East at Pittsburgh’s highest recorded rental rate, suggesting that there is still an appetite for new construction within the urban core
There was a slowing of Industrial leasing activity for the summer, but as Amazon proposes to expand their footprint, they have introduced a new type of warehouse to the region.
The Pittsburgh market has felt the effects of COVID in other property types, but industrial continues to move forward due to e-commerce and distribution demand.
Industrial developers and investors are in touch with the pulse of the industrial marketplace and are taking aggressive steps to meet the potential increase in demand for modern, Class A space.
Pittsburgh's industrial market was strong and steady going into the new decade. The COVID-19 outbreak caused a pause in development, but Pittsburgh is positioned to rebound.
Rixos Tersane Istanbul Residences Brochure_May2024_ENG.pdfListing Turkey
Tersane Suites Residences is a luxurious real estate project located in the heart of Istanbul, next to the beautiful Golden Horn. This unique development offers hotel concept residences with Rixos management, making it the perfect choice for both homeowners and investors.
The Tersane Suites Residences offers a wide range of options, from studio apartments to spacious four-bedroom units, all designed to the highest standard. The suites are finished with high-quality materials and feature modern, open-plan living spaces, fully-equipped kitchens, and large balconies with stunning views of the city and sea.
One of the standout features of Tersane Suites Residences is the Rixos management, which provides a truly exclusive and upscale living experience. Residents will have access to a range of luxury amenities, including a fitness center, spa, and indoor and outdoor swimming pools. Plus, the on-site restaurants and cafes provide a taste of the local and international cuisine.
The Tersane Suites Residences also offers a great opportunity for investors, as it provides a rental guarantee program. This means that investors can enjoy a steady income stream, with the peace of mind that their property is being managed by a reputable and experienced team.
The location of Tersane Suites Residences is also unbeatable, with easy access to the city’s main transportation links and within close proximity to the historic center, making it the perfect base for exploring all that Istanbul has to offer.
Investing In The US As A Canadian… And How To Do It RIGHT!! (feat. Erwin Szet...Volition Properties
=== Investing In The US As A Canadian… And How To Do It RIGHT!! (feat. Erwin Szeto) ===
Ever been curious about Real Estate Investing in the US?? At Volition, for the past 14 years, we have been focused on helping investors invest in over $250M of real estate and generate $100M of wealth in the Toronto market, but we are always open to learning more about other business models and learning from other investors.
The US has always been an intriguing market to invest in. But the US is a big place… if you’re interested in investing in the US, you probably have a lot of questions, like:
☑️ Specifically WHERE should you invest?
☑️ What are the best markets to invest in and why?
☑️ How much are property prices there?
☑️ What are the returns like?
☑️ What is cashflow like?
☑️ Compared to investing in Toronto or other cities in Ontario, what are the benefits / tradeoffs?
☑️ What ownership structure should I use?
☑️ What are the tax implications?
☑️ Can I get financing?
☑️ What are tenants like?
Enter Erwin Szeto, a longtime friend of Volition. Since 2005, Erwin Szeto and his team have navigated the challenging landscape of being landlords in Ontario. Now, they are shifting their focus and guiding their clients' investments toward the more landlord-friendly environment of the USA. This decision comes after assisting Canadian clients in transacting over $440,000,000 in income properties. Faced with issues like affordability constraints, tenant-friendly laws, rent control, and rental licensing in Canada, Erwin sees a clear opportunity in the U.S. Here, there is a significant influx of investments leading to the creation of high-paying manufacturing jobs. Erwin and his clients are poised to capitalize on these opportunities where landlord rights are stronger and there is no rent control.
To facilitate this transition, Erwin has partnered with and become a client of SHARE, a one-stop-shop U.S. Asset Manager. Founded by Canadians for Canadians, SHARE enables as passive an ownership experience as possible for landlords in the U.S., while still maintaining direct, 100% ownership.
Erwin is “Making Real Estate Investing Great Again”!!
Website: https://www.infinitywealth.ca/
Facebook: https://www.facebook.com/iwinrealestate and https://www.facebook.com/ErwinSzetoOfficial
Podcast: https://www.truthaboutrealestateinvesting.ca/
Instagram: https://www.instagram.com/iwinrealestate/ and https://www.instagram.com/erwinszeto/
One FNG by Group 108 Sector 142 Noida Construction UpdateOne FNG
One FNG by Group 108 is launching a new commercial project in Sector 142 Noida. Office space and high street retail shops on the FNG and Noida Expressway. For more information visit the website https://www.onefng.com/
Sense Levent Kagithane Catalog - Listing TurkeyListing Turkey
Sense Levent offers a luxurious living experience in the heart of Istanbul’s vibrant Levent district.
This cutting-edge development seamlessly integrates modern design with natural elements, featuring live evergreen plants maintained by an advanced irrigation system, ensuring lush greenery year-round.
The building’s elegant ceramic balconies are both stylish and durable, enhancing the overall aesthetic and functionality. Residents can enjoy the 700m Sky Lounge, which provides breathtaking views of Istanbul and a perfect space to relax and unwind.
Sense Levent promotes a healthy and active lifestyle with a full gym, swimming pool, sauna, and steam room, all available in the building. The interiors are crafted with high-quality materials, ensuring a luxurious and inviting living space.
Designed with young professionals in mind, Sense Levent features 1+1 and 2+1 units with smart floor plans and balconies. The project promises high investment returns, with an expected annual return of 6.5-7%, significantly above Istanbul’s average ROI.
Located in the rapidly growing and highly desirable Levent area, the development benefits from ongoing urban regeneration projects. Its prime location offers proximity to shopping malls, municipal buildings, universities, and public transportation, adding immense value to your investment.
Early investors can take advantage of discounted units during the construction phase, with an expected capital appreciation of +45% USD upon completion. Property Turkey provides comprehensive rental management services, ensuring a seamless and profitable investment experience.
Additionally, robust legal support and significant tax advantages are available through Property Turkey’s licensed Real Estate Investment Fund. Levent is a dynamic urban hub, ideal for young professionals with its numerous corporate headquarters and shopping malls.
Sense Levent is more than just a residence; it’s a place where dreams and opportunities come to life. Contact us today to secure your place in this exclusive development and experience the best of Istanbul living. Sense Levent: Sense the Opportunity. Live the Dream.
https://listingturkey.com/property/sense-levent/
Elegant Evergreen Homes - Luxury Apartments Redefining Comfort in Yelahanka, ...JagadishKR1
Experience unmatched luxury at Elegant Evergreen Homes, offering exquisite 2, 3, and 4 BHK apartments in the serene locality of Yelahanka, Bangalore. These meticulously crafted homes blend modern design with timeless elegance, providing a harmonious living environment. Enjoy top-tier amenities and a prime location, making Elegant Evergreen Homes the ideal choice for discerning homeowners.
Referans Bahcesehir which is being constructed, in the center of the most regional destination as Bahçeşehir, shines out with its central location and unique landscape including social facilities such as a fitness center, sauna, sports facilities, children’s playground and recreational areas.
Not only drawing attention for immediate surroundings including commercial centers and private schools but also providing the easily accessible location with closeness to Tem Highway and connection roads, ongoing construction of 3rd Bridge Connection roads and Metro Projects
Bahcesehir is a rising value in the great city of Istanbul… Located at a new transportation junction in the northwest of the City… Located at such a spot that the access roads for the 3rd bridge and for the 3rd Airport will reach the region in 2016. The Marmaray and the Subway will extend all the way to Referans Bahcesehir respectively in 2018 and 2019.
465 flats and 34 stores are designed with an outstanding approach and arranged with a unique perspective offering the following options: 1 plus 1, 2 plus 1, 3 plus 1, 3.5 plus 1, 4 plus 1, and 4.5 plus 1. It is planned so as to safeguard you and your loved ones based upon a modern, technological safety approach. As you experience the joy and luxury here, you will be content and feet at ease.
It is worth seeing both inside and outside with heart-warming cafes, tasty restaurants and elegant stores… And it is ready to offer a vivacious social life with a warm and cozy space design.
A folding swimming pool and indoor swimming pools, playgrounds, Turkish bath, sauna… It has them all. Everything you need for your well-being and for having a pleasant time will be at your service. You simply need to align the rhythm of life with the rhythm of Referans Bahcesehir.
https://listingturkey.com/property/referans-bahcesehir/
The SVN® organization shares a portion of their new weekly listings via their SVN Live® Weekly Property Broadcast. Visit https://svn.com/svn-live/ if you would like to attend our weekly call, which we open up to the brokerage community.
Omaxe Sports City Dwarka stands out as a premier residential and recreational destination, offering a blend of luxury and sports-centric living. Located in the thriving area of Dwarka, this project by Omaxe Limited is designed to cater to modern lifestyle needs while promoting a healthy, active living environment.
Green Homes, Islamabad Presentation .pdfticktoktips
Green Homes Islamabad offers beautifully designed 5, 8, and 10 Marla homes near the airport and motorway. Enjoy luxury, convenience, and high rental returns in a prime location.
Keep Your Home Naturally Cool and Warm Out Change in Seasons
Vinra Construction is a private limited company registered under the ROC. The management has an experience of over 15 years of understanding the needs and delivering apt solutions to the end users We are providing turnkey solutions in construction fields. like Construction, Interior Designing Facility Management, Plantation Management, etc..
Vinra Construction Tech Enabled Company for Eco-Friendly Home Construction
Contact With Vinra for a Greener Future >>> Call us @ 888 4898 765
Torun Center Residences Istanbul - Listing TurkeyListing Turkey
THERE IS LIFE IN ITS CENTER!
The most energetic spot of the city that will add utterly different pleasures to your life, with a park that will make Istanbul breathe, delighting indoor and outdoor bistros, cafes, restaurants, the brand-new Food Hall concept, where dozens of unique tastes are served together, market area, cinema, theater, fitness club, SPA and event venue...
All the pleasures that will enrich your lives are awaiting you on the most beautiful side of the city, at Torun Center Residences. In Mecidiyeköy, where the heart of Istanbul beats, business, life and entertainment opportunities are located at the exact center, at Torun Center, the most beautiful side of the city.
Penthouse apartments and different styles of flats from 1 + 1 to 4 + 1, from 100 to 425 square meters in a 42-story residence tower, have been designed for those who want to live in the center of magnificence. Torun Center is the redefinition of a better life with specially landscaped floor gardens, apartment options with private balconies, and automatic glass systems equipped with Trickle Ventilation that offers clean air comfort.
Business and life in the same place
Excellent service
Torun Center has many delightful details, from a swimming pool to sunbathing and resting terrace. With 24/7 concierge services, 24/7 security, valet, technical service, closed-circuit camera system (CCTV), central heating and cooling system, it makes your life easier.
Delightful details
The two-story Torun Center Lounge, with its indoor and outdoor seating areas, children's playroom, private dining and TV lounge, promises unforgettable memories to you and your loved ones with its unique Istanbul view.
Neighboring to the most pleasant square of Istanbul
A few steps from the Torun Center Residences, you can reach the city's most modern city square and open the doors of a quality city life. Torun Center Residences brings together on the same project the long-awaited city life for Istanbul and gourmet restaurants, cafes, gym and SPA, and state-of-the-art cinema and Artı Stage, hosting the most famous plays of the season.
Located at the intersection of alternative public transportation options such as the metro and Metrobus, Torun Center comes to the fore as the most accessible office for both sides of Istanbul. With a central location and rich transportation lines, Torun Center offices make life easier for employees and increase productivity.
The KA Housing - Catalogue - Listing TurkeyListing Turkey
Welcome to KA Housing, a distinguished real estate development nestled in the heart of Eyüpsultan, one of Istanbul’s most promising districts.
Just 10 minutes from the bustling city center, Eyüpsultan offers a serene escape with the convenience of urban living. The direct metro line ensures seamless connectivity to all parts of Istanbul, making it an ideal location for residents who seek both tranquility and vibrancy.
KA Housing boasts unparalleled accessibility, with proximity to Istanbul Airport only 30 minutes away, facilitating easy international travel. Effortless city access is guaranteed by direct metro and transportation links to Istanbul’s cultural and commercial hubs. Quick access to key metro lines connects you to every corner of the city within minutes, making commuting and exploring the city hassle-free.
The development offers luxurious living spaces with a range of unit layouts from 1+1 to 4+1, designed with meticulous attention to detail. Each unit features balconies or terraces, providing stunning vistas of Istanbul and enhancing the living experience. High-quality materials and superior craftsmanship ensure durability and elegance, while sound-proof insulation and high ceilings (2.95 m) offer comfort and sophistication.
Residents of KA Housing enjoy exclusive on-site amenities, including a state-of-the-art gym, outdoor swimming pool, yoga area, and walking paths. Entertainment options abound with a private cinema, children’s playground, and a variety of dining options including a café and restaurant. Security and convenience are paramount with 24/7 security, a dedicated carpark garage, and an IP intercom system.
KA Housing represents a prime investment opportunity with limited availability in a high-demand area, ensuring enduring value and potential for lucrative returns. Homes in this development provide exceptional value without compromising on quality, offering affordable luxury for discerning buyers. The construction is of the highest quality, built to the latest seismic and disaster resistance standards, ensuring safety and resilience.
The community and surroundings of KA Housing are enriched by close proximity to prestigious universities such as Haliç University, Bilgi University, and Istanbul Ticaret University, making it an ideal location for students and academics. The development is adjacent to the Alibeyköy stream leading into the Halic waters, offering serene natural escapes amidst lush greenery. Residents can enjoy the cultural richness of the area, surrounded by historical and cultural landmarks that blend leisure, nature, and culture seamlessly.
https://listingturkey.com/property/the-ka-housing/
Need MCA leads? No sweat! MCAs are great for small biz funding. Learn how to snag top-notch leads: businesses needing cash, with repayment ability, decision-makers, and accurate contacts. Use content, social ads, lead platforms, partnerships, and capture processes for quality leads.
https://www.leadgeneration.media/blog/b/streamline-your-mca-sales-process-with-pre-qualified-leads
Presentation to Windust Meadows HOA Board of Directors June 4, 2024: Focus o...Joseph Lewis Aguirre
Presentation to Windust Meadows HOA Board of Directors June 4, 2024: Focus on Public Safety as Job #1, Engagement, Wealth of HOA, Branding, Communication, Culture, Civic Responsibility
Urbanrise Paradise on Earth - Unveiling Unprecedented Luxury in Exquisite Vil...JagadishKR1
Immerse yourself in the epitome of luxury living at Urbanrise Paradise on Earth. These opulent 4 BHK villas, nestled off the prestigious Kanakapura Road in Bangalore, redefine elegance and sophistication. With meticulous craftsmanship, breathtaking design, and unparalleled amenities, Urbanrise Paradise on Earth offers a sanctuary where every moment is infused with luxury and serenity. Experience a life of grandeur and indulgence at this exclusive residential enclave.
500 acres of brilliance await you here at Riverview City which offers modern living, effortless convenience, and a beautiful natural setting. It is a mega township by Magarpatta City in Loni Kalbhor, Pune. Enjoy easy access to work, schools, and fun while experiencing a perfect work-life balance.
Visit - magarpattacity.developerprojects.in