- Vacancy in Detroit's office market increased slightly in the past two quarters but conditions remain stable, with current vacancy rates of 15.7% in urban areas and 22.3% in suburbs.
- Automakers made headlines again in Q3 as Cadillac announced moving back to Detroit after four years in New York, while multiple office buildings hit the market for sale downtown.
- Rent growth continued across the metro area despite a bump in vacancy, as large available spaces in the suburbs may be backfilled by year's end.
JLL Detroit Office Insight & Statistics - Q4 2019Harrison West
2019 marked another year of positive growth for the Detroit office market. Vacancies fell 1.6 percent year-over-year, while rent growth flattened. In the fourth quarter, London-based WPP grabbed headlines with its announcement to lease nine floors of the vacant Marquette Building at 243 W. Congress Street, investing over $19.2 million and adding 1,000 jobs downtown.
JLL Detroit Office Insight & Statistics - Q1 2019Harrison West
Over 202,000 square feet of space was absorbed in the first quarter, with notable transactions taking place in the city and the suburbs. Chicago-based Coyote Logistics made headlines with the announcement of a 58,000-square-foot lease at Bedrock’s Assembly Building at 1700 West Fort Street, bringing 500 new jobs to the burgeoning Corktown neighborhood. Google announced plans to expand their 29,000-square-foot office at Little Caesars arena.
JLL Detroit Office Insight & Statistics - Q3 2019Harrison West
As we look ahead to the end of 2019, we can expect the stable conditions in the Detroit office market to remain. Downtown’s Class A vacancy remains extremely tight outside of the Renaissance Center and will likely stay that way until new inventory is added to the market.
JLL Detroit Office Insight & Statistics - Q4 2018Harrison West
The fourth quarter of 2018 was highlighted by yet another high-profile groundbreaking, as Bedrock began work on the Monroe Blocks development, a mixed-use project totaling over 1.4 million square feet that will bring approximately 847,000 square feet to the CBD office inventory. Market-wide, total vacancy fell by 60 basis points to 20.2 percent as 149,007 square feet was absorbed, while average asking rents rose by 1.0 percent up to $19.85 per square foot.
JLL Detroit Office Insight & Statistics - Q4 2017Harrison West
Total vacancy fell to 18.5 percent across the metro, while average asking rents rose to $19.18. In total, 885,582 square feet of office space was absorbed in 2017. Multiple significant lease transactions took place in the fourth quarter, perhaps most notably Google’s announcement to move from Birmingham to a 17,000-square-foot space at the office component of the new Little Caesars Arena
JLL Detroit Office Insight & Statistics - Q3 2017Harrison West
As conditions continue to improve in Detroit, we will see sustained rent growth and dropping vacancies. Looking ahead - we can prepare to see cranes amongst the downtown skyline, as Bedrock readies to break ground on the Hudson’s development on Woodward in December.
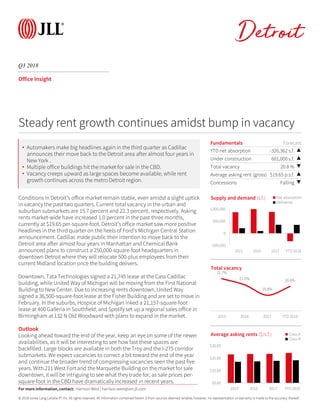
JLL Detroit Office Insight & Statistics - Q1 2018Harrison West
2018 is poised to be another great year of growth for Detroit’s office market. With transformational developments underway like the Hudson’s site downtown, and others in the pipeline like the Monroe Block and the to-be-determined jail site development, the buzz downtown is palpable.
JLL Detroit Office Insight & Statistics - Q2 2017Harrison West
As fundamentals continue to improve in Detroit’s office market, we will see rent growth and continued development activity. Downtown, expect to see increased mixed-use projects along Woodward, while in the suburbs build-to-suit projects will remain prevalent.
JLL Detroit Office Insight & Statistics - Q4 2019Harrison West
2019 marked another year of positive growth for the Detroit office market. Vacancies fell 1.6 percent year-over-year, while rent growth flattened. In the fourth quarter, London-based WPP grabbed headlines with its announcement to lease nine floors of the vacant Marquette Building at 243 W. Congress Street, investing over $19.2 million and adding 1,000 jobs downtown.
JLL Detroit Office Insight & Statistics - Q1 2019Harrison West
Over 202,000 square feet of space was absorbed in the first quarter, with notable transactions taking place in the city and the suburbs. Chicago-based Coyote Logistics made headlines with the announcement of a 58,000-square-foot lease at Bedrock’s Assembly Building at 1700 West Fort Street, bringing 500 new jobs to the burgeoning Corktown neighborhood. Google announced plans to expand their 29,000-square-foot office at Little Caesars arena.
JLL Detroit Office Insight & Statistics - Q3 2019Harrison West
As we look ahead to the end of 2019, we can expect the stable conditions in the Detroit office market to remain. Downtown’s Class A vacancy remains extremely tight outside of the Renaissance Center and will likely stay that way until new inventory is added to the market.
JLL Detroit Office Insight & Statistics - Q4 2018Harrison West
The fourth quarter of 2018 was highlighted by yet another high-profile groundbreaking, as Bedrock began work on the Monroe Blocks development, a mixed-use project totaling over 1.4 million square feet that will bring approximately 847,000 square feet to the CBD office inventory. Market-wide, total vacancy fell by 60 basis points to 20.2 percent as 149,007 square feet was absorbed, while average asking rents rose by 1.0 percent up to $19.85 per square foot.
JLL Detroit Office Insight & Statistics - Q4 2017Harrison West
Total vacancy fell to 18.5 percent across the metro, while average asking rents rose to $19.18. In total, 885,582 square feet of office space was absorbed in 2017. Multiple significant lease transactions took place in the fourth quarter, perhaps most notably Google’s announcement to move from Birmingham to a 17,000-square-foot space at the office component of the new Little Caesars Arena
JLL Detroit Office Insight & Statistics - Q3 2017Harrison West
As conditions continue to improve in Detroit, we will see sustained rent growth and dropping vacancies. Looking ahead - we can prepare to see cranes amongst the downtown skyline, as Bedrock readies to break ground on the Hudson’s development on Woodward in December.
JLL Detroit Office Insight & Statistics - Q1 2018Harrison West
2018 is poised to be another great year of growth for Detroit’s office market. With transformational developments underway like the Hudson’s site downtown, and others in the pipeline like the Monroe Block and the to-be-determined jail site development, the buzz downtown is palpable.
JLL Detroit Office Insight & Statistics - Q2 2017Harrison West
As fundamentals continue to improve in Detroit’s office market, we will see rent growth and continued development activity. Downtown, expect to see increased mixed-use projects along Woodward, while in the suburbs build-to-suit projects will remain prevalent.
JLL Grand Rapids Office Insight & Statistics - Q1 2019Harrison West
Looking ahead, we expect conditions to remain stable. Both vacancy and rent growth have leveled off over the past several quarters. Moving forward, construction figures will increase as Studio Park’s office component breaks ground and development along the East Paris Corridor increases.
JLL Downtown Chicago Office Market Update - Q3 2016Hailey Harrington
Chicago's shifting supply and demand. River North Inventory increases 4.2 million square feet of new product as tech tenant demand driving conversions to office due to limited supply.
Cushman & Wakefield's Canadian Office Statistical Summary Q4 2018Guy Masse
Q4 2018
Canadian Office Statistical Summary
Driven by buoyant demand from technology companies, extremely tight CBD markets in both Vancouver and Toronto got even tighter over the final quarter of the year, helping drive the National CBD vacancy rate to 8.7% - its lowest point since Q3 2015!
KEY HIGHLIGHTS
• Canadian CBD Class A markets saw absorption of 3.6 msf in 2018, with a fourth quarter contribution of 1.5 msf. This is the strongest premium space growth since 2011.
• The arrival and partial occupancy of Stantec Tower helped drive Q4 2018 absorption in Edmonton’s downtown market to above 800,000 sf, with a final year-end 2018 tally of 1.2 msf.
• Although Calgary continues to see modest momentum in its CBD market, Suburban markets had a strong year with absorption reaching 337,000 sf. This drove vacancy to 16.9% from 19.4% one-year-ago.
• Vacancy in Downtown Toronto reached an incredibly tight 1.9% in Q4, a vacancy rate not seen in over 35 years. Conditions are expected to remain extremely tight until late 2020 when the first in a 10.7 msf wave of new developments will begin to hit the downtown market.
• Downtown Vancouver, another hot market driven by technology growth, saw its vacancy decline to 2.3% in Q4; its lowest point since Q2 2008. Like Toronto, little relief for tenants is not anticipated until the next wave of downtown new supply begins to arrive in late 2020.
The third quarter saw the delivery of the downtown streetcar and the GE Global Operations Center at the banks, both projects were two of Cincinnati’s most highly anticipated deliveries in years. Developers continued to cautiously move forward with planned projects as they look to land large users for preleasing before they begin construction.
We are pleased to share the second quarter office research reports for Cincinnati. Below you will find a link to the reports as well as a summary of the key themes examined in the second quarter research.
2019 ended the decade on high notes, as Pittsburgh gets its first VC-funded tech unicorn and the former Civic Arena site gets an anchor tenant for the tower.
The financial results of the 2016/17 football season are the most impressive ever recorded in our Annual Review of Football Finance, with the 27th edition reflecting a new era of improved profitability and financial stability for football clubs.
JLL Detroit Office Insight & Statistics - Q2 2019Harrison West
The second quarter in the Detroit office market brought a decrease in vacancy and continued rent growth. Total vacancy across the market is currently at 18.5 percent, while average asking rents are $19.85 per square foot, representing a 2.1 percent increase year-over-year...
JLL Detroit Office Insight & Statistics – Q2 2016Aaron Moore
The quagmire persists – high demand and not enough supply. CBD vacancy rates for the second quarter were 14.5 percent as office construction has come to a virtual halt.
The Pittsburgh office market had quite the summer in 2018. More tenants flock to the urban core, 420 Boulevard of the Allies sold, and District Fifteen is fully leased before delivering.
JLL Pittsburgh Office Outlook - Q4 2015Andrew Batson
JLL's Pittsburgh Office Outlook identifies the top trends driving the local real estate market. The report also includes an analysis of market statistics, leasing activity, notable sales transactions and economic conditions.
JLL just released the Q1 Chicago Suburbs Office Outlook. The report has some great insight into recent market activity and provides a forecast for the year ahead.
Avrupa Konutlari Yenimahalle - Listing TurkeyListing Turkey
Welcome to Avrupa Konutları Yenimahalle, where luxury living meets unparalleled convenience in the heart of Istanbul. Developed by Artaş Holding, one of Turkey’s leading construction companies, this prestigious residential project offers a contemporary lifestyle experience like no other.
https://listingturkey.com/property/avrupa-konutlari-yenimahalle/
MC Heights-Best Construction Company in jhanglaraibfatim009
MC Heights stands as the epitome of excellence in construction within Jhang. With a commitment to unparalleled quality and innovative design, MC Heights redefines urban living in the heart of Jhang. Offering luxurious residential spaces, cutting-edge commercial complexes, and vibrant community areas, MC Heights caters to the diverse needs of modern lifestyles. Our dedication to superior craftsmanship and customer satisfaction ensures that every aspect of MC Heights exceeds expectations, making it the premier choice for those seeking unparalleled sophistication and comfort in Jhang.
Lixin Azarmehr, a Los Angeles-based real estate development trailblazer, co-founded JL Real Estate Development (JL RED) in 2015 and serves as its CEO. Her expertise has propelled the firm to specialize in luxury residential and mixed-use commercial projects, with a portfolio that features upscale retail spaces and sophisticated care facilities.
Rixos Tersane Istanbul Residences Brochure_May2024_ENG.pdfListing Turkey
Tersane Suites Residences is a luxurious real estate project located in the heart of Istanbul, next to the beautiful Golden Horn. This unique development offers hotel concept residences with Rixos management, making it the perfect choice for both homeowners and investors.
The Tersane Suites Residences offers a wide range of options, from studio apartments to spacious four-bedroom units, all designed to the highest standard. The suites are finished with high-quality materials and feature modern, open-plan living spaces, fully-equipped kitchens, and large balconies with stunning views of the city and sea.
One of the standout features of Tersane Suites Residences is the Rixos management, which provides a truly exclusive and upscale living experience. Residents will have access to a range of luxury amenities, including a fitness center, spa, and indoor and outdoor swimming pools. Plus, the on-site restaurants and cafes provide a taste of the local and international cuisine.
The Tersane Suites Residences also offers a great opportunity for investors, as it provides a rental guarantee program. This means that investors can enjoy a steady income stream, with the peace of mind that their property is being managed by a reputable and experienced team.
The location of Tersane Suites Residences is also unbeatable, with easy access to the city’s main transportation links and within close proximity to the historic center, making it the perfect base for exploring all that Istanbul has to offer.
Need MCA leads? No sweat! MCAs are great for small biz funding. Learn how to snag top-notch leads: businesses needing cash, with repayment ability, decision-makers, and accurate contacts. Use content, social ads, lead platforms, partnerships, and capture processes for quality leads.
https://www.leadgeneration.media/blog/b/streamline-your-mca-sales-process-with-pre-qualified-leads
Presentation to Windust Meadows HOA Board of Directors June 4, 2024: Focus o...Joseph Lewis Aguirre
Presentation to Windust Meadows HOA Board of Directors June 4, 2024: Focus on Public Safety as Job #1, Engagement, Wealth of HOA, Branding, Communication, Culture, Civic Responsibility
BricknBolt Understanding Load-Bearing Walls and Their Structural Support in H...BrickAndBolt
Load-bearing walls are the backbone of any home construction, providing crucial structural support that carries the weight of the house above. For companies like Brick and Bolt Mysore and Bricknbolt Faridabad, understanding and properly implementing these elements are key to constructing safe and durable buildings.
One FNG by Group 108 Sector 142 Noida Construction UpdateOne FNG
One FNG by Group 108 is launching a new commercial project in Sector 142 Noida. Office space and high street retail shops on the FNG and Noida Expressway. For more information visit the website https://www.onefng.com/
Scanning tenants in NYC requires a thorough and compliant approach to ensure you find reliable renters. For a positive rental experience, consider hiring a property management service. Belgium Management LLC specializes in NYC rental property management and tenant relationship management. We prioritize tenant satisfaction, making us a trusted name in New York property management. Our dedicated team ensures tenants feel valued and supported throughout their lease.
Brigade Insignia offers meticulously designed apartments with modern architecture and premium finishes. The project features spacious 3,3.5,4 and 5 BHK units, each thoughtfully planned to provide maximum comfort, natural light, and ventilation.
https://www.newprojectbangalore.com/brigade-insignia-yelahanka-bangalore.html
Oeiras Tech City, Developed by RE Capital and REIG, Will Become Lisbon's Futu...Newman George Leech
Oeiras Tech City, a historic development in the Oeiras municipality of Lisbon, is acquired by RE Capital and REIG. It is located on a 93,000-square-meter plot of land and combines co-living, business, and residential areas. It highlights ESG principles and is close to Tagus Park, which improves the urban landscape of Lisbon.
Referans Bahcesehir which is being constructed, in the center of the most regional destination as Bahçeşehir, shines out with its central location and unique landscape including social facilities such as a fitness center, sauna, sports facilities, children’s playground and recreational areas.
Not only drawing attention for immediate surroundings including commercial centers and private schools but also providing the easily accessible location with closeness to Tem Highway and connection roads, ongoing construction of 3rd Bridge Connection roads and Metro Projects
Bahcesehir is a rising value in the great city of Istanbul… Located at a new transportation junction in the northwest of the City… Located at such a spot that the access roads for the 3rd bridge and for the 3rd Airport will reach the region in 2016. The Marmaray and the Subway will extend all the way to Referans Bahcesehir respectively in 2018 and 2019.
465 flats and 34 stores are designed with an outstanding approach and arranged with a unique perspective offering the following options: 1 plus 1, 2 plus 1, 3 plus 1, 3.5 plus 1, 4 plus 1, and 4.5 plus 1. It is planned so as to safeguard you and your loved ones based upon a modern, technological safety approach. As you experience the joy and luxury here, you will be content and feet at ease.
It is worth seeing both inside and outside with heart-warming cafes, tasty restaurants and elegant stores… And it is ready to offer a vivacious social life with a warm and cozy space design.
A folding swimming pool and indoor swimming pools, playgrounds, Turkish bath, sauna… It has them all. Everything you need for your well-being and for having a pleasant time will be at your service. You simply need to align the rhythm of life with the rhythm of Referans Bahcesehir.
https://listingturkey.com/property/referans-bahcesehir/
Investing In The US As A Canadian… And How To Do It RIGHT!! (feat. Erwin Szet...Volition Properties
=== Investing In The US As A Canadian… And How To Do It RIGHT!! (feat. Erwin Szeto) ===
Ever been curious about Real Estate Investing in the US?? At Volition, for the past 14 years, we have been focused on helping investors invest in over $250M of real estate and generate $100M of wealth in the Toronto market, but we are always open to learning more about other business models and learning from other investors.
The US has always been an intriguing market to invest in. But the US is a big place… if you’re interested in investing in the US, you probably have a lot of questions, like:
☑️ Specifically WHERE should you invest?
☑️ What are the best markets to invest in and why?
☑️ How much are property prices there?
☑️ What are the returns like?
☑️ What is cashflow like?
☑️ Compared to investing in Toronto or other cities in Ontario, what are the benefits / tradeoffs?
☑️ What ownership structure should I use?
☑️ What are the tax implications?
☑️ Can I get financing?
☑️ What are tenants like?
Enter Erwin Szeto, a longtime friend of Volition. Since 2005, Erwin Szeto and his team have navigated the challenging landscape of being landlords in Ontario. Now, they are shifting their focus and guiding their clients' investments toward the more landlord-friendly environment of the USA. This decision comes after assisting Canadian clients in transacting over $440,000,000 in income properties. Faced with issues like affordability constraints, tenant-friendly laws, rent control, and rental licensing in Canada, Erwin sees a clear opportunity in the U.S. Here, there is a significant influx of investments leading to the creation of high-paying manufacturing jobs. Erwin and his clients are poised to capitalize on these opportunities where landlord rights are stronger and there is no rent control.
To facilitate this transition, Erwin has partnered with and become a client of SHARE, a one-stop-shop U.S. Asset Manager. Founded by Canadians for Canadians, SHARE enables as passive an ownership experience as possible for landlords in the U.S., while still maintaining direct, 100% ownership.
Erwin is “Making Real Estate Investing Great Again”!!
Website: https://www.infinitywealth.ca/
Facebook: https://www.facebook.com/iwinrealestate and https://www.facebook.com/ErwinSzetoOfficial
Podcast: https://www.truthaboutrealestateinvesting.ca/
Instagram: https://www.instagram.com/iwinrealestate/ and https://www.instagram.com/erwinszeto/
Elegant Evergreen Homes - Luxury Apartments Redefining Comfort in Yelahanka, ...JagadishKR1
Experience unmatched luxury at Elegant Evergreen Homes, offering exquisite 2, 3, and 4 BHK apartments in the serene locality of Yelahanka, Bangalore. These meticulously crafted homes blend modern design with timeless elegance, providing a harmonious living environment. Enjoy top-tier amenities and a prime location, making Elegant Evergreen Homes the ideal choice for discerning homeowners.
Green Homes, Islamabad Presentation .pdfticktoktips
Green Homes Islamabad offers beautifully designed 5, 8, and 10 Marla homes near the airport and motorway. Enjoy luxury, convenience, and high rental returns in a prime location.
500 acres of brilliance await you here at Riverview City which offers modern living, effortless convenience, and a beautiful natural setting. It is a mega township by Magarpatta City in Loni Kalbhor, Pune. Enjoy easy access to work, schools, and fun while experiencing a perfect work-life balance.
Visit - magarpattacity.developerprojects.in
Flat available for sale
Location- Tupudana, Ranchi
Savitri enclave
Area- 3BHK
Rate- 4000/sq.ft.
Super Build Up Area-1629 sq.ft.
Build-up area-1253 sq.ft.
Rate- 65lakh16k(approx)
Floor available- Flat available in all floor(G+12)
Balcony- 2
Washroom- 2
Parking - CAR PARKING
Amenities- Joggers track,temple, children's park,gym,banquet hall (5 Lakh)
Possession year (Handover year)- Dec 2025
Outside View from the apartment and flat balcony is very beautiful.
For more information contact AASHIYANA STAR PROPERTIES
7766900371
Omaxe Sports City Dwarka stands out as a premier residential and recreational destination, offering a blend of luxury and sports-centric living. Located in the thriving area of Dwarka, this project by Omaxe Limited is designed to cater to modern lifestyle needs while promoting a healthy, active living environment.