SlideShare a Scribd company logo
© 2020 Jones Lang LaSalle IP, Inc. All rights reserved. All information contained herein is from sources deemed reliable; however, no representation or warranty is made to the accuracy thereof.
Q1 2020
West Michigan
Industrial Insight
On the heels of a strong 2019, the West Michigan industrial market saw
929,431 square feet of positive net absorption in the first quarter. A large share
of this absorption figure was due to the delivery of Amazon's new distribution
center in Gaines Township. In early March, after investing $150 million,
Amazon opened its 855,000-square-foot distribution center, owned by
Seefried Industrial Properties. Market-wide average asking rents were $3.79
per-square-foot in Q1, an increase of 10.8 percent year-over-year. On the
leasing front, Pratt & Whitney, an aerospace manufacturer, signed a 62,500-
square foot lease at 7010-7062 Grand Haven Road in Norton Shores, while
Keystone Manufacturing signed a lease for 28,500 square feet in Kalamazoo.
A consistent theme of the past 12 months has been expansion and
improvement activity in the industrial space. This continued in the first
quarter with auto supplier Gentex announcing a $9.5 million, 36,000-square-
foot expansion set to complete in October, Hudsonville Ice Cream
announcing a 9.8 million, 40,000-square-foot warehouse upgrade, and
pharmaceutical giant Perrigo expanding in Holland with a $13.6 million,
66,000-square-foot warehousing facility. A few notable sales in the first quarter
include 14444 168th Avenue in Grand Haven, which sold for $5.0 million, or
approximately $175-per-square-foot, and 3470 Roger B. Chaffee Memorial
Drive Southeast, which sold for $3.2 million, or $29-per-square foot.
Outlook
While West Michigan market has seen historically low vacancy figures and
impressive rent growth the past few years, we should expect things to slow in
Q2 as the effects of the COVID-19 pandemic begin to take hold. Market
fundamentals remain stable; however, given the current uncertainty, we
expect leasing and sales activity to slow considerably in the near term as
occupiers evaluate their current and future space needs.
Fundamentals Forecast
YTD net absorption 929,431 s.f. ▲
Under construction 522,324 s.f. ▲
Total vacancy 3.9% ▼
Sublease vacancy 811,742 s.f. ▶
Direct asking rent $3.79 p.s.f. ▲
Sublease asking rent $4.28 p.s.f. ▶
Concessions Falling ▼
0
2,000,000
4,000,000
6,000,000
2016 2017 2018 2019 YTD 2020
Supply and demand (s.f.) Net absorption
Deliveries
New construction and expansion activity highlight Q1
0%
5%
10%
15%
2006 2008 2010 2012 2014 2016 2018 2020
Total vacancy
For more information, contact: Harrison West| harrison.west@am.jll.com
• Amazon opened its 855,000-square-foot distribution center, owned by
Seefried Industrial Properties.
• Expansion and improvement activity in the industrial space remained a
consistent theme across west Michigan in Q1.
• Market-wide average asking rents were $3.79 per-square-foot in Q1, an
increase of 10.8 percent year-over-year.
$0
$5
2006 2008 2010 2012 2014 2016 2018 2020
Average asking rent ($ p.s.f.) Direct
Sublease
Given the health, policy, economic and financial disruption unfolding from the COVID-19
outbreak, resulting real estate market shifts will not be fully reflected in Q1 2020 statistical
indicators. It is too early to provide a quantitative assessment or forecast of the ultimate market
impact of COVID-19. Our analysis focusses on Q1 market activity and how the market is
positioned moving forward. We will be continually monitoring market movements as the
situation evolves. Please feel free to contact us if we can assist.
The property set was updated to reflect the latest market dynamics, including the removal of functionally obsolete properties and the addition of recently completed developments.
© 2020 Jones Lang LaSalle IP, Inc. All rights reserved. All information contained herein is from sources deemed reliable; however, no representation or warranty is made to the accuracy thereof.
Q1 2020
West Michigan
Industrial Statistics
For more information, contact: Harrison West| harrison.west@am.jll.com
The property set was updated to reflect the latest market dynamics, including the removal of functionally obsolete properties and the addition of recently completed developments.
Inventory (s.f.)
Quarterly total
net absorption
(s.f.)
YTD total net
absorption (s.f.)
YTD total net
absorption (%
of stock)
Total
availability
(%)
Average
total asking
rent ($
p.s.f.)
Quarterly
Completions
(s.f.)
YTD
Completions
(s.f.)
Under
construction (s.f.)
Market Totals
Warehouse & Distribution 108,941,866 913,200 913,200 0.8% 4.8% $4.01 1,025,000 1,025,000 142,324
Manufacturing 131,218,878 16,231 16,231 0.0% 3.2% $3.58 0 0 380,000
Totals 240,160,744 929,431 929,431 0.4% 3.9% $3.79 1,025,000 1,025,000 522,324
Flex/R&D 11,638,043 37,372 37,372 0.3% 10.6% $7.33 0 0 485,000
Northeast Grand Rapids
Warehouse & Distribution 7,011,332 0 0 0.0% 0.0% $0.00 0 0 0
Manufacturing 7,955,299 0 0 0.0% 0.2% $5.24 0 0 0
Totals 14,966,631 0 0 0.0% 0.1% $5.24 0 0 0
Flex/R&D 296,671 4,165 4,165 1.4% 0.0% NA 0 0 0
Northwest Grand Rapids
Warehouse & Distribution 9,198,576 57,852 57,852 0.6% 3.8% $4.30 0 0 0
Manufacturing 12,444,775 72,351 72,351 0.6% 5.3% $2.55 0 0 300,000
Totals 21,643,351 130,203 130,203 0.6% 4.7% $3.27 0 0 300,000
Flex/R&D 1,237,570 0 0 0.0% 2.7% NA 0 0 0
Southeast Grand Rapids
Warehouse & Distribution 33,490,968 844,174 844,174 2.5% 3.7% $4.07 850,000 850,000 0
Manufacturing 28,820,151 8,674 8,674 0.0% 6.3% $3.28 0 0 0
Totals 62,311,119 852,848 852,848 1.4% 4.9% $3.67 850,000 850,000 0
Flex/R&D 3,528,847 -23,229 -23,229 -0.7% 7.8% $8.87 0 0 0
Southwest Grand Rapids
Warehouse & Distribution 14,533,323 -38,978 -38,978 -0.3% 7.2% $3.36 0 0 119,000
Manufacturing 28,278,821 40,606 40,606 0.1% 1.2% $4.14 0 0 0
Totals 42,812,144 1,628 1,628 0.0% 3.2% $3.61 0 0 119,000
Flex/R&D 888,834 -650 -650 -0.1% 4.1% $7.63 0 0 0
Southwest Michigan
Warehouse & Distribution 22,165,884 -99,858 -99,858 -0.5% 5.3% $4.09 0 0 0
Manufacturing 24,121,321 -105,400 -105,400 -0.4% 1.2% $6.94 0 0 0
Totals 46,287,205 -205,258 -205,258 -0.4% 3.2% $5.07 0 0 0
Flex/R&D 3,562,445 -42,958 -42,958 -1.2% 10.9% $7.24 0 0 485,000
West Shore
Warehouse & Distribution 22,541,783 150,010 150,010 0.7% 6.4% $4.06 175,000 175,000 23,324
Manufacturing 29,598,511 0 0 0.0% 3.7% $3.61 0 0 80,000
Totals 52,140,294 150,010 150,010 0.3% 4.9% $3.81 175,000 175,000 103,324
Flex/R&D 2,123,676 100,044 100,044 4.7% 23.6% $7.56 0 0 0

More Related Content

What's hot

JLL Pittsburgh Industrial Insight & Statistics - Q1 2020
JLL Pittsburgh Industrial Insight & Statistics - Q1 2020JLL Pittsburgh Industrial Insight & Statistics - Q1 2020
JLL Pittsburgh Industrial Insight & Statistics - Q1 2020
Tobiah Bilski
 
JLL Pittsburgh Industrial Insight & Statistics - Q3 2017
JLL Pittsburgh Industrial Insight & Statistics - Q3 2017JLL Pittsburgh Industrial Insight & Statistics - Q3 2017
JLL Pittsburgh Industrial Insight & Statistics - Q3 2017
Tobiah Bilski
 
JLL Cincinnati Industrial Outlook Q1 2021
JLL Cincinnati Industrial Outlook Q1 2021JLL Cincinnati Industrial Outlook Q1 2021
JLL Cincinnati Industrial Outlook Q1 2021
Abby Armbruster
 
JLL Pittsburgh Industrial Insight & Statistics - Q4 2021
JLL Pittsburgh Industrial Insight & Statistics - Q4 2021JLL Pittsburgh Industrial Insight & Statistics - Q4 2021
JLL Pittsburgh Industrial Insight & Statistics - Q4 2021
Tobiah Bilski
 
JLL Detroit Industrial Insight & Statistics - Q2 2017
JLL Detroit Industrial Insight & Statistics - Q2 2017JLL Detroit Industrial Insight & Statistics - Q2 2017
JLL Detroit Industrial Insight & Statistics - Q2 2017
Harrison West
 
JLL Cincinnati Industrial Outlook Q4 2020
JLL Cincinnati Industrial Outlook Q4 2020JLL Cincinnati Industrial Outlook Q4 2020
JLL Cincinnati Industrial Outlook Q4 2020
Abby Armbruster
 
JLL Detroit Industrial Insight & Statistics - Q4 2019
JLL Detroit Industrial Insight & Statistics - Q4 2019JLL Detroit Industrial Insight & Statistics - Q4 2019
JLL Detroit Industrial Insight & Statistics - Q4 2019
Harrison West
 
JLL Pittsburgh Office Insight & Statistics - Q1 2020
JLL Pittsburgh Office Insight & Statistics - Q1 2020JLL Pittsburgh Office Insight & Statistics - Q1 2020
JLL Pittsburgh Office Insight & Statistics - Q1 2020
Tobiah Bilski
 
JLL West Michigan Industrial Insight & Statistics - Q2 2019
JLL West Michigan Industrial Insight & Statistics - Q2 2019JLL West Michigan Industrial Insight & Statistics - Q2 2019
JLL West Michigan Industrial Insight & Statistics - Q2 2019
Harrison West
 
JLL Cincinnati Industrial Outlook Q3 2020
JLL Cincinnati Industrial Outlook Q3 2020JLL Cincinnati Industrial Outlook Q3 2020
JLL Cincinnati Industrial Outlook Q3 2020
Abby Armbruster
 
JLL - Tampa Bay 2018 Q2 Industrial Outlook
JLL - Tampa Bay 2018 Q2 Industrial OutlookJLL - Tampa Bay 2018 Q2 Industrial Outlook
JLL - Tampa Bay 2018 Q2 Industrial Outlook
Kyle Koller
 
JLL Pittsburgh Industrial Insight & Statistics - Q4 2019
JLL Pittsburgh Industrial Insight & Statistics - Q4 2019JLL Pittsburgh Industrial Insight & Statistics - Q4 2019
JLL Pittsburgh Industrial Insight & Statistics - Q4 2019
Tobiah Bilski
 
JLL Pittsburgh Office Outlook - Q4 2015
JLL Pittsburgh Office Outlook - Q4 2015JLL Pittsburgh Office Outlook - Q4 2015
JLL Pittsburgh Office Outlook - Q4 2015
Andrew Batson
 
JLL Pittsburgh Office Insight & Statistics - Q2 2021
JLL Pittsburgh Office Insight & Statistics - Q2 2021JLL Pittsburgh Office Insight & Statistics - Q2 2021
JLL Pittsburgh Office Insight & Statistics - Q2 2021
Tobiah Bilski
 
St. Louis Industrial Outlook Q3 2016
St. Louis Industrial Outlook Q3 2016St. Louis Industrial Outlook Q3 2016
St. Louis Industrial Outlook Q3 2016
Blaise Tomazic
 
JLL Cleveland Industrial Outlook: Q3 2018
JLL Cleveland Industrial Outlook: Q3 2018JLL Cleveland Industrial Outlook: Q3 2018
JLL Cleveland Industrial Outlook: Q3 2018
Andrew Batson
 
JLL West Michigan Industrial Insight & Statistics - Q4 2019
JLL West Michigan Industrial Insight & Statistics - Q4 2019JLL West Michigan Industrial Insight & Statistics - Q4 2019
JLL West Michigan Industrial Insight & Statistics - Q4 2019
Harrison West
 
JLL West Michigan Industrial Insight & Statistics - Q3 2019
JLL West Michigan Industrial Insight & Statistics - Q3 2019JLL West Michigan Industrial Insight & Statistics - Q3 2019
JLL West Michigan Industrial Insight & Statistics - Q3 2019
Harrison West
 
JLL Grand Rapids Office Insight & Statistics - Q1 2018
JLL Grand Rapids Office Insight & Statistics - Q1 2018JLL Grand Rapids Office Insight & Statistics - Q1 2018
JLL Grand Rapids Office Insight & Statistics - Q1 2018
Harrison West
 
JLL Columbus Industrial Outlook - Q4 2020
JLL Columbus Industrial Outlook - Q4 2020JLL Columbus Industrial Outlook - Q4 2020
JLL Columbus Industrial Outlook - Q4 2020
Emma Gresky
 

What's hot (20)

JLL Pittsburgh Industrial Insight & Statistics - Q1 2020
JLL Pittsburgh Industrial Insight & Statistics - Q1 2020JLL Pittsburgh Industrial Insight & Statistics - Q1 2020
JLL Pittsburgh Industrial Insight & Statistics - Q1 2020
 
JLL Pittsburgh Industrial Insight & Statistics - Q3 2017
JLL Pittsburgh Industrial Insight & Statistics - Q3 2017JLL Pittsburgh Industrial Insight & Statistics - Q3 2017
JLL Pittsburgh Industrial Insight & Statistics - Q3 2017
 
JLL Cincinnati Industrial Outlook Q1 2021
JLL Cincinnati Industrial Outlook Q1 2021JLL Cincinnati Industrial Outlook Q1 2021
JLL Cincinnati Industrial Outlook Q1 2021
 
JLL Pittsburgh Industrial Insight & Statistics - Q4 2021
JLL Pittsburgh Industrial Insight & Statistics - Q4 2021JLL Pittsburgh Industrial Insight & Statistics - Q4 2021
JLL Pittsburgh Industrial Insight & Statistics - Q4 2021
 
JLL Detroit Industrial Insight & Statistics - Q2 2017
JLL Detroit Industrial Insight & Statistics - Q2 2017JLL Detroit Industrial Insight & Statistics - Q2 2017
JLL Detroit Industrial Insight & Statistics - Q2 2017
 
JLL Cincinnati Industrial Outlook Q4 2020
JLL Cincinnati Industrial Outlook Q4 2020JLL Cincinnati Industrial Outlook Q4 2020
JLL Cincinnati Industrial Outlook Q4 2020
 
JLL Detroit Industrial Insight & Statistics - Q4 2019
JLL Detroit Industrial Insight & Statistics - Q4 2019JLL Detroit Industrial Insight & Statistics - Q4 2019
JLL Detroit Industrial Insight & Statistics - Q4 2019
 
JLL Pittsburgh Office Insight & Statistics - Q1 2020
JLL Pittsburgh Office Insight & Statistics - Q1 2020JLL Pittsburgh Office Insight & Statistics - Q1 2020
JLL Pittsburgh Office Insight & Statistics - Q1 2020
 
JLL West Michigan Industrial Insight & Statistics - Q2 2019
JLL West Michigan Industrial Insight & Statistics - Q2 2019JLL West Michigan Industrial Insight & Statistics - Q2 2019
JLL West Michigan Industrial Insight & Statistics - Q2 2019
 
JLL Cincinnati Industrial Outlook Q3 2020
JLL Cincinnati Industrial Outlook Q3 2020JLL Cincinnati Industrial Outlook Q3 2020
JLL Cincinnati Industrial Outlook Q3 2020
 
JLL - Tampa Bay 2018 Q2 Industrial Outlook
JLL - Tampa Bay 2018 Q2 Industrial OutlookJLL - Tampa Bay 2018 Q2 Industrial Outlook
JLL - Tampa Bay 2018 Q2 Industrial Outlook
 
JLL Pittsburgh Industrial Insight & Statistics - Q4 2019
JLL Pittsburgh Industrial Insight & Statistics - Q4 2019JLL Pittsburgh Industrial Insight & Statistics - Q4 2019
JLL Pittsburgh Industrial Insight & Statistics - Q4 2019
 
JLL Pittsburgh Office Outlook - Q4 2015
JLL Pittsburgh Office Outlook - Q4 2015JLL Pittsburgh Office Outlook - Q4 2015
JLL Pittsburgh Office Outlook - Q4 2015
 
JLL Pittsburgh Office Insight & Statistics - Q2 2021
JLL Pittsburgh Office Insight & Statistics - Q2 2021JLL Pittsburgh Office Insight & Statistics - Q2 2021
JLL Pittsburgh Office Insight & Statistics - Q2 2021
 
St. Louis Industrial Outlook Q3 2016
St. Louis Industrial Outlook Q3 2016St. Louis Industrial Outlook Q3 2016
St. Louis Industrial Outlook Q3 2016
 
JLL Cleveland Industrial Outlook: Q3 2018
JLL Cleveland Industrial Outlook: Q3 2018JLL Cleveland Industrial Outlook: Q3 2018
JLL Cleveland Industrial Outlook: Q3 2018
 
JLL West Michigan Industrial Insight & Statistics - Q4 2019
JLL West Michigan Industrial Insight & Statistics - Q4 2019JLL West Michigan Industrial Insight & Statistics - Q4 2019
JLL West Michigan Industrial Insight & Statistics - Q4 2019
 
JLL West Michigan Industrial Insight & Statistics - Q3 2019
JLL West Michigan Industrial Insight & Statistics - Q3 2019JLL West Michigan Industrial Insight & Statistics - Q3 2019
JLL West Michigan Industrial Insight & Statistics - Q3 2019
 
JLL Grand Rapids Office Insight & Statistics - Q1 2018
JLL Grand Rapids Office Insight & Statistics - Q1 2018JLL Grand Rapids Office Insight & Statistics - Q1 2018
JLL Grand Rapids Office Insight & Statistics - Q1 2018
 
JLL Columbus Industrial Outlook - Q4 2020
JLL Columbus Industrial Outlook - Q4 2020JLL Columbus Industrial Outlook - Q4 2020
JLL Columbus Industrial Outlook - Q4 2020
 

Similar to JLL West Michigan Industrial Insight & Statistics - Q1 2020

Jll cincinnati industrial outlook q1 2017
Jll cincinnati industrial outlook   q1 2017Jll cincinnati industrial outlook   q1 2017
Jll cincinnati industrial outlook q1 2017
Abby Armbruster
 
JLL Cincinnati Industrial Outlook Q3 2017
JLL Cincinnati Industrial Outlook  Q3 2017JLL Cincinnati Industrial Outlook  Q3 2017
JLL Cincinnati Industrial Outlook Q3 2017
Abby Armbruster
 
JLL Cleveland Industrial Outlook: Q4 2017
JLL Cleveland Industrial Outlook: Q4 2017JLL Cleveland Industrial Outlook: Q4 2017
JLL Cleveland Industrial Outlook: Q4 2017
Andrew Batson
 
JLL Detroit Industrial Insight & Statistics - Q1 2017
JLL Detroit Industrial Insight & Statistics - Q1 2017JLL Detroit Industrial Insight & Statistics - Q1 2017
JLL Detroit Industrial Insight & Statistics - Q1 2017
Harrison West
 
JLL Detroit Industrial Insight & Statistics - Q2 2016
JLL Detroit Industrial Insight & Statistics - Q2 2016JLL Detroit Industrial Insight & Statistics - Q2 2016
JLL Detroit Industrial Insight & Statistics - Q2 2016
Aaron Moore
 
JLL Pittsburgh Industrial Insight & Statistics - Q2 2019
JLL Pittsburgh Industrial Insight & Statistics - Q2 2019JLL Pittsburgh Industrial Insight & Statistics - Q2 2019
JLL Pittsburgh Industrial Insight & Statistics - Q2 2019
Tobiah Bilski
 
JLL Cincinnati Industrial Outlook Q4 2017
JLL Cincinnati Industrial Outlook Q4 2017JLL Cincinnati Industrial Outlook Q4 2017
JLL Cincinnati Industrial Outlook Q4 2017
Abby Armbruster
 
JLL Cleveland Industrial Outlook: Q4 2018
JLL Cleveland Industrial Outlook: Q4 2018JLL Cleveland Industrial Outlook: Q4 2018
JLL Cleveland Industrial Outlook: Q4 2018
Andrew Batson
 
JLL Cleveland Industrial Outlook: Q4 2018
JLL Cleveland Industrial Outlook: Q4 2018JLL Cleveland Industrial Outlook: Q4 2018
JLL Cleveland Industrial Outlook: Q4 2018
Andrew Batson
 
JLL Pittsburgh Industrial Insight & Statistics - Q1 2019
JLL Pittsburgh Industrial Insight & Statistics - Q1 2019JLL Pittsburgh Industrial Insight & Statistics - Q1 2019
JLL Pittsburgh Industrial Insight & Statistics - Q1 2019
Tobiah Bilski
 
JLL West Michigan Industrial Insight & Statistics - Q1 2018
JLL West Michigan Industrial Insight & Statistics - Q1 2018JLL West Michigan Industrial Insight & Statistics - Q1 2018
JLL West Michigan Industrial Insight & Statistics - Q1 2018
Harrison West
 
JLL Pittsburgh Office Insight & Statistics - Q4 2018
JLL Pittsburgh Office Insight & Statistics - Q4 2018JLL Pittsburgh Office Insight & Statistics - Q4 2018
JLL Pittsburgh Office Insight & Statistics - Q4 2018
Tobiah Bilski
 
JLL St. Louis Industrial Outlook Q3 2019
JLL St. Louis Industrial Outlook Q3 2019JLL St. Louis Industrial Outlook Q3 2019
JLL St. Louis Industrial Outlook Q3 2019
AndrewThompson315
 
JLL Pittsburgh Office Insight & Statistics - Q2 2020
JLL Pittsburgh Office Insight & Statistics - Q2 2020JLL Pittsburgh Office Insight & Statistics - Q2 2020
JLL Pittsburgh Office Insight & Statistics - Q2 2020
Tobiah Bilski
 
JLL Detroit Industrial Insight & Statistics - Q4 2017
JLL Detroit Industrial Insight & Statistics - Q4 2017JLL Detroit Industrial Insight & Statistics - Q4 2017
JLL Detroit Industrial Insight & Statistics - Q4 2017
Harrison West
 
JLL Cleveland Industrial Outlook: Q2 2020
JLL Cleveland Industrial Outlook: Q2 2020JLL Cleveland Industrial Outlook: Q2 2020
JLL Cleveland Industrial Outlook: Q2 2020
Andrew Batson
 
JLL Pittsburgh Industrial Insight & Statistics - Q1 2018
JLL Pittsburgh Industrial Insight & Statistics - Q1 2018JLL Pittsburgh Industrial Insight & Statistics - Q1 2018
JLL Pittsburgh Industrial Insight & Statistics - Q1 2018
Tobiah Bilski
 
St. Louis Industrial Outlook Q3 2016
St. Louis Industrial Outlook Q3 2016St. Louis Industrial Outlook Q3 2016
St. Louis Industrial Outlook Q3 2016
Blaise Tomazic
 
JLL Pittsburgh Industrial Insight & Statistics - Q4 2020
JLL Pittsburgh Industrial Insight & Statistics - Q4 2020JLL Pittsburgh Industrial Insight & Statistics - Q4 2020
JLL Pittsburgh Industrial Insight & Statistics - Q4 2020
Tobiah Bilski
 
St. louis Q4 2019 Industrial Outlook
St. louis Q4 2019 Industrial OutlookSt. louis Q4 2019 Industrial Outlook
St. louis Q4 2019 Industrial Outlook
AndrewThompson315
 

Similar to JLL West Michigan Industrial Insight & Statistics - Q1 2020 (20)

Jll cincinnati industrial outlook q1 2017
Jll cincinnati industrial outlook   q1 2017Jll cincinnati industrial outlook   q1 2017
Jll cincinnati industrial outlook q1 2017
 
JLL Cincinnati Industrial Outlook Q3 2017
JLL Cincinnati Industrial Outlook  Q3 2017JLL Cincinnati Industrial Outlook  Q3 2017
JLL Cincinnati Industrial Outlook Q3 2017
 
JLL Cleveland Industrial Outlook: Q4 2017
JLL Cleveland Industrial Outlook: Q4 2017JLL Cleveland Industrial Outlook: Q4 2017
JLL Cleveland Industrial Outlook: Q4 2017
 
JLL Detroit Industrial Insight & Statistics - Q1 2017
JLL Detroit Industrial Insight & Statistics - Q1 2017JLL Detroit Industrial Insight & Statistics - Q1 2017
JLL Detroit Industrial Insight & Statistics - Q1 2017
 
JLL Detroit Industrial Insight & Statistics - Q2 2016
JLL Detroit Industrial Insight & Statistics - Q2 2016JLL Detroit Industrial Insight & Statistics - Q2 2016
JLL Detroit Industrial Insight & Statistics - Q2 2016
 
JLL Pittsburgh Industrial Insight & Statistics - Q2 2019
JLL Pittsburgh Industrial Insight & Statistics - Q2 2019JLL Pittsburgh Industrial Insight & Statistics - Q2 2019
JLL Pittsburgh Industrial Insight & Statistics - Q2 2019
 
JLL Cincinnati Industrial Outlook Q4 2017
JLL Cincinnati Industrial Outlook Q4 2017JLL Cincinnati Industrial Outlook Q4 2017
JLL Cincinnati Industrial Outlook Q4 2017
 
JLL Cleveland Industrial Outlook: Q4 2018
JLL Cleveland Industrial Outlook: Q4 2018JLL Cleveland Industrial Outlook: Q4 2018
JLL Cleveland Industrial Outlook: Q4 2018
 
JLL Cleveland Industrial Outlook: Q4 2018
JLL Cleveland Industrial Outlook: Q4 2018JLL Cleveland Industrial Outlook: Q4 2018
JLL Cleveland Industrial Outlook: Q4 2018
 
JLL Pittsburgh Industrial Insight & Statistics - Q1 2019
JLL Pittsburgh Industrial Insight & Statistics - Q1 2019JLL Pittsburgh Industrial Insight & Statistics - Q1 2019
JLL Pittsburgh Industrial Insight & Statistics - Q1 2019
 
JLL West Michigan Industrial Insight & Statistics - Q1 2018
JLL West Michigan Industrial Insight & Statistics - Q1 2018JLL West Michigan Industrial Insight & Statistics - Q1 2018
JLL West Michigan Industrial Insight & Statistics - Q1 2018
 
JLL Pittsburgh Office Insight & Statistics - Q4 2018
JLL Pittsburgh Office Insight & Statistics - Q4 2018JLL Pittsburgh Office Insight & Statistics - Q4 2018
JLL Pittsburgh Office Insight & Statistics - Q4 2018
 
JLL St. Louis Industrial Outlook Q3 2019
JLL St. Louis Industrial Outlook Q3 2019JLL St. Louis Industrial Outlook Q3 2019
JLL St. Louis Industrial Outlook Q3 2019
 
JLL Pittsburgh Office Insight & Statistics - Q2 2020
JLL Pittsburgh Office Insight & Statistics - Q2 2020JLL Pittsburgh Office Insight & Statistics - Q2 2020
JLL Pittsburgh Office Insight & Statistics - Q2 2020
 
JLL Detroit Industrial Insight & Statistics - Q4 2017
JLL Detroit Industrial Insight & Statistics - Q4 2017JLL Detroit Industrial Insight & Statistics - Q4 2017
JLL Detroit Industrial Insight & Statistics - Q4 2017
 
JLL Cleveland Industrial Outlook: Q2 2020
JLL Cleveland Industrial Outlook: Q2 2020JLL Cleveland Industrial Outlook: Q2 2020
JLL Cleveland Industrial Outlook: Q2 2020
 
JLL Pittsburgh Industrial Insight & Statistics - Q1 2018
JLL Pittsburgh Industrial Insight & Statistics - Q1 2018JLL Pittsburgh Industrial Insight & Statistics - Q1 2018
JLL Pittsburgh Industrial Insight & Statistics - Q1 2018
 
St. Louis Industrial Outlook Q3 2016
St. Louis Industrial Outlook Q3 2016St. Louis Industrial Outlook Q3 2016
St. Louis Industrial Outlook Q3 2016
 
JLL Pittsburgh Industrial Insight & Statistics - Q4 2020
JLL Pittsburgh Industrial Insight & Statistics - Q4 2020JLL Pittsburgh Industrial Insight & Statistics - Q4 2020
JLL Pittsburgh Industrial Insight & Statistics - Q4 2020
 
St. louis Q4 2019 Industrial Outlook
St. louis Q4 2019 Industrial OutlookSt. louis Q4 2019 Industrial Outlook
St. louis Q4 2019 Industrial Outlook
 

Recently uploaded

One20 North Vancouver Floor Plans by Three Shores Development.
One20 North Vancouver Floor Plans by Three Shores Development.One20 North Vancouver Floor Plans by Three Shores Development.
One20 North Vancouver Floor Plans by Three Shores Development.
VickyAulakh1
 
Simpolo Company Profile & Corporate Logo
Simpolo Company Profile & Corporate LogoSimpolo Company Profile & Corporate Logo
Simpolo Company Profile & Corporate Logo
simpolosparkteam
 
Brigade Insignia at Yelahanka Brochure.pdf
Brigade Insignia at Yelahanka Brochure.pdfBrigade Insignia at Yelahanka Brochure.pdf
Brigade Insignia at Yelahanka Brochure.pdf
SachinChauhan191
 
Green Homes, Islamabad Presentation .pdf
Green Homes, Islamabad Presentation .pdfGreen Homes, Islamabad Presentation .pdf
Green Homes, Islamabad Presentation .pdf
ticktoktips
 
Oeiras Tech City, Developed by RE Capital and REIG, Will Become Lisbon's Futu...
Oeiras Tech City, Developed by RE Capital and REIG, Will Become Lisbon's Futu...Oeiras Tech City, Developed by RE Capital and REIG, Will Become Lisbon's Futu...
Oeiras Tech City, Developed by RE Capital and REIG, Will Become Lisbon's Futu...
Newman George Leech
 
One FNG by Group 108 Sector 142 Noida Construction Update
One FNG by Group 108 Sector 142 Noida Construction UpdateOne FNG by Group 108 Sector 142 Noida Construction Update
One FNG by Group 108 Sector 142 Noida Construction Update
One FNG
 
BricknBolt Understanding Load-Bearing Walls and Their Structural Support in H...
BricknBolt Understanding Load-Bearing Walls and Their Structural Support in H...BricknBolt Understanding Load-Bearing Walls and Their Structural Support in H...
BricknBolt Understanding Load-Bearing Walls and Their Structural Support in H...
BrickAndBolt
 
Investing In The US As A Canadian… And How To Do It RIGHT!! (feat. Erwin Szet...
Investing In The US As A Canadian… And How To Do It RIGHT!! (feat. Erwin Szet...Investing In The US As A Canadian… And How To Do It RIGHT!! (feat. Erwin Szet...
Investing In The US As A Canadian… And How To Do It RIGHT!! (feat. Erwin Szet...
Volition Properties
 
Urbanrise Paradise on Earth - Unveiling Unprecedented Luxury in Exquisite Vil...
Urbanrise Paradise on Earth - Unveiling Unprecedented Luxury in Exquisite Vil...Urbanrise Paradise on Earth - Unveiling Unprecedented Luxury in Exquisite Vil...
Urbanrise Paradise on Earth - Unveiling Unprecedented Luxury in Exquisite Vil...
JagadishKR1
 
Rixos Tersane Istanbul Residences Brochure_May2024_ENG.pdf
Rixos Tersane Istanbul Residences Brochure_May2024_ENG.pdfRixos Tersane Istanbul Residences Brochure_May2024_ENG.pdf
Rixos Tersane Istanbul Residences Brochure_May2024_ENG.pdf
Listing Turkey
 
Architectural & Interior design portfolio.pdf
Architectural & Interior design portfolio.pdfArchitectural & Interior design portfolio.pdf
Architectural & Interior design portfolio.pdf
susantebinum
 
SVN Live 6.3.24 Weekly Property Broadcast
SVN Live 6.3.24 Weekly Property BroadcastSVN Live 6.3.24 Weekly Property Broadcast
SVN Live 6.3.24 Weekly Property Broadcast
SVN International Corp.
 
How to Scan Tenants in NYC - You Should Know!
How to Scan Tenants in NYC - You Should Know!How to Scan Tenants in NYC - You Should Know!
How to Scan Tenants in NYC - You Should Know!
BelgiumManagement
 
Elegant Evergreen Homes - Luxury Apartments Redefining Comfort in Yelahanka, ...
Elegant Evergreen Homes - Luxury Apartments Redefining Comfort in Yelahanka, ...Elegant Evergreen Homes - Luxury Apartments Redefining Comfort in Yelahanka, ...
Elegant Evergreen Homes - Luxury Apartments Redefining Comfort in Yelahanka, ...
JagadishKR1
 
How to keep your Home naturally Cool and Warm
How to keep your Home naturally Cool and WarmHow to keep your Home naturally Cool and Warm
How to keep your Home naturally Cool and Warm
Vinra Construction
 
Riverview City Loni Kalbhor Pune Brochure
Riverview City Loni Kalbhor Pune BrochureRiverview City Loni Kalbhor Pune Brochure
Riverview City Loni Kalbhor Pune Brochure
kishor21012022
 
2BHK-3BHK NEW FLAT FOR SALE IN TUPUDANA,RANCHI.
2BHK-3BHK NEW FLAT FOR SALE IN TUPUDANA,RANCHI.2BHK-3BHK NEW FLAT FOR SALE IN TUPUDANA,RANCHI.
2BHK-3BHK NEW FLAT FOR SALE IN TUPUDANA,RANCHI.
aashiyanastardevelop
 
MC Heights-Best Construction Company in jhang
MC Heights-Best Construction Company in jhangMC Heights-Best Construction Company in jhang
MC Heights-Best Construction Company in jhang
laraibfatim009
 
Avrupa Konutlari Yenimahalle - Listing Turkey
Avrupa Konutlari Yenimahalle - Listing TurkeyAvrupa Konutlari Yenimahalle - Listing Turkey
Avrupa Konutlari Yenimahalle - Listing Turkey
Listing Turkey
 
Biography and career about Lixin Azarmehr
Biography and career about Lixin AzarmehrBiography and career about Lixin Azarmehr
Biography and career about Lixin Azarmehr
Lixin Azarmehr
 

Recently uploaded (20)

One20 North Vancouver Floor Plans by Three Shores Development.
One20 North Vancouver Floor Plans by Three Shores Development.One20 North Vancouver Floor Plans by Three Shores Development.
One20 North Vancouver Floor Plans by Three Shores Development.
 
Simpolo Company Profile & Corporate Logo
Simpolo Company Profile & Corporate LogoSimpolo Company Profile & Corporate Logo
Simpolo Company Profile & Corporate Logo
 
Brigade Insignia at Yelahanka Brochure.pdf
Brigade Insignia at Yelahanka Brochure.pdfBrigade Insignia at Yelahanka Brochure.pdf
Brigade Insignia at Yelahanka Brochure.pdf
 
Green Homes, Islamabad Presentation .pdf
Green Homes, Islamabad Presentation .pdfGreen Homes, Islamabad Presentation .pdf
Green Homes, Islamabad Presentation .pdf
 
Oeiras Tech City, Developed by RE Capital and REIG, Will Become Lisbon's Futu...
Oeiras Tech City, Developed by RE Capital and REIG, Will Become Lisbon's Futu...Oeiras Tech City, Developed by RE Capital and REIG, Will Become Lisbon's Futu...
Oeiras Tech City, Developed by RE Capital and REIG, Will Become Lisbon's Futu...
 
One FNG by Group 108 Sector 142 Noida Construction Update
One FNG by Group 108 Sector 142 Noida Construction UpdateOne FNG by Group 108 Sector 142 Noida Construction Update
One FNG by Group 108 Sector 142 Noida Construction Update
 
BricknBolt Understanding Load-Bearing Walls and Their Structural Support in H...
BricknBolt Understanding Load-Bearing Walls and Their Structural Support in H...BricknBolt Understanding Load-Bearing Walls and Their Structural Support in H...
BricknBolt Understanding Load-Bearing Walls and Their Structural Support in H...
 
Investing In The US As A Canadian… And How To Do It RIGHT!! (feat. Erwin Szet...
Investing In The US As A Canadian… And How To Do It RIGHT!! (feat. Erwin Szet...Investing In The US As A Canadian… And How To Do It RIGHT!! (feat. Erwin Szet...
Investing In The US As A Canadian… And How To Do It RIGHT!! (feat. Erwin Szet...
 
Urbanrise Paradise on Earth - Unveiling Unprecedented Luxury in Exquisite Vil...
Urbanrise Paradise on Earth - Unveiling Unprecedented Luxury in Exquisite Vil...Urbanrise Paradise on Earth - Unveiling Unprecedented Luxury in Exquisite Vil...
Urbanrise Paradise on Earth - Unveiling Unprecedented Luxury in Exquisite Vil...
 
Rixos Tersane Istanbul Residences Brochure_May2024_ENG.pdf
Rixos Tersane Istanbul Residences Brochure_May2024_ENG.pdfRixos Tersane Istanbul Residences Brochure_May2024_ENG.pdf
Rixos Tersane Istanbul Residences Brochure_May2024_ENG.pdf
 
Architectural & Interior design portfolio.pdf
Architectural & Interior design portfolio.pdfArchitectural & Interior design portfolio.pdf
Architectural & Interior design portfolio.pdf
 
SVN Live 6.3.24 Weekly Property Broadcast
SVN Live 6.3.24 Weekly Property BroadcastSVN Live 6.3.24 Weekly Property Broadcast
SVN Live 6.3.24 Weekly Property Broadcast
 
How to Scan Tenants in NYC - You Should Know!
How to Scan Tenants in NYC - You Should Know!How to Scan Tenants in NYC - You Should Know!
How to Scan Tenants in NYC - You Should Know!
 
Elegant Evergreen Homes - Luxury Apartments Redefining Comfort in Yelahanka, ...
Elegant Evergreen Homes - Luxury Apartments Redefining Comfort in Yelahanka, ...Elegant Evergreen Homes - Luxury Apartments Redefining Comfort in Yelahanka, ...
Elegant Evergreen Homes - Luxury Apartments Redefining Comfort in Yelahanka, ...
 
How to keep your Home naturally Cool and Warm
How to keep your Home naturally Cool and WarmHow to keep your Home naturally Cool and Warm
How to keep your Home naturally Cool and Warm
 
Riverview City Loni Kalbhor Pune Brochure
Riverview City Loni Kalbhor Pune BrochureRiverview City Loni Kalbhor Pune Brochure
Riverview City Loni Kalbhor Pune Brochure
 
2BHK-3BHK NEW FLAT FOR SALE IN TUPUDANA,RANCHI.
2BHK-3BHK NEW FLAT FOR SALE IN TUPUDANA,RANCHI.2BHK-3BHK NEW FLAT FOR SALE IN TUPUDANA,RANCHI.
2BHK-3BHK NEW FLAT FOR SALE IN TUPUDANA,RANCHI.
 
MC Heights-Best Construction Company in jhang
MC Heights-Best Construction Company in jhangMC Heights-Best Construction Company in jhang
MC Heights-Best Construction Company in jhang
 
Avrupa Konutlari Yenimahalle - Listing Turkey
Avrupa Konutlari Yenimahalle - Listing TurkeyAvrupa Konutlari Yenimahalle - Listing Turkey
Avrupa Konutlari Yenimahalle - Listing Turkey
 
Biography and career about Lixin Azarmehr
Biography and career about Lixin AzarmehrBiography and career about Lixin Azarmehr
Biography and career about Lixin Azarmehr
 

JLL West Michigan Industrial Insight & Statistics - Q1 2020

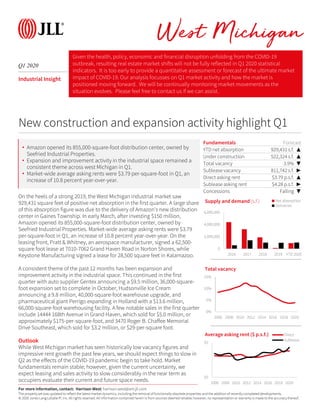
  • 1. © 2020 Jones Lang LaSalle IP, Inc. All rights reserved. All information contained herein is from sources deemed reliable; however, no representation or warranty is made to the accuracy thereof. Q1 2020 West Michigan Industrial Insight On the heels of a strong 2019, the West Michigan industrial market saw 929,431 square feet of positive net absorption in the first quarter. A large share of this absorption figure was due to the delivery of Amazon's new distribution center in Gaines Township. In early March, after investing $150 million, Amazon opened its 855,000-square-foot distribution center, owned by Seefried Industrial Properties. Market-wide average asking rents were $3.79 per-square-foot in Q1, an increase of 10.8 percent year-over-year. On the leasing front, Pratt & Whitney, an aerospace manufacturer, signed a 62,500- square foot lease at 7010-7062 Grand Haven Road in Norton Shores, while Keystone Manufacturing signed a lease for 28,500 square feet in Kalamazoo. A consistent theme of the past 12 months has been expansion and improvement activity in the industrial space. This continued in the first quarter with auto supplier Gentex announcing a $9.5 million, 36,000-square- foot expansion set to complete in October, Hudsonville Ice Cream announcing a 9.8 million, 40,000-square-foot warehouse upgrade, and pharmaceutical giant Perrigo expanding in Holland with a $13.6 million, 66,000-square-foot warehousing facility. A few notable sales in the first quarter include 14444 168th Avenue in Grand Haven, which sold for $5.0 million, or approximately $175-per-square-foot, and 3470 Roger B. Chaffee Memorial Drive Southeast, which sold for $3.2 million, or $29-per-square foot. Outlook While West Michigan market has seen historically low vacancy figures and impressive rent growth the past few years, we should expect things to slow in Q2 as the effects of the COVID-19 pandemic begin to take hold. Market fundamentals remain stable; however, given the current uncertainty, we expect leasing and sales activity to slow considerably in the near term as occupiers evaluate their current and future space needs. Fundamentals Forecast YTD net absorption 929,431 s.f. ▲ Under construction 522,324 s.f. ▲ Total vacancy 3.9% ▼ Sublease vacancy 811,742 s.f. ▶ Direct asking rent $3.79 p.s.f. ▲ Sublease asking rent $4.28 p.s.f. ▶ Concessions Falling ▼ 0 2,000,000 4,000,000 6,000,000 2016 2017 2018 2019 YTD 2020 Supply and demand (s.f.) Net absorption Deliveries New construction and expansion activity highlight Q1 0% 5% 10% 15% 2006 2008 2010 2012 2014 2016 2018 2020 Total vacancy For more information, contact: Harrison West| harrison.west@am.jll.com • Amazon opened its 855,000-square-foot distribution center, owned by Seefried Industrial Properties. • Expansion and improvement activity in the industrial space remained a consistent theme across west Michigan in Q1. • Market-wide average asking rents were $3.79 per-square-foot in Q1, an increase of 10.8 percent year-over-year. $0 $5 2006 2008 2010 2012 2014 2016 2018 2020 Average asking rent ($ p.s.f.) Direct Sublease Given the health, policy, economic and financial disruption unfolding from the COVID-19 outbreak, resulting real estate market shifts will not be fully reflected in Q1 2020 statistical indicators. It is too early to provide a quantitative assessment or forecast of the ultimate market impact of COVID-19. Our analysis focusses on Q1 market activity and how the market is positioned moving forward. We will be continually monitoring market movements as the situation evolves. Please feel free to contact us if we can assist. The property set was updated to reflect the latest market dynamics, including the removal of functionally obsolete properties and the addition of recently completed developments.
  • 2. © 2020 Jones Lang LaSalle IP, Inc. All rights reserved. All information contained herein is from sources deemed reliable; however, no representation or warranty is made to the accuracy thereof. Q1 2020 West Michigan Industrial Statistics For more information, contact: Harrison West| harrison.west@am.jll.com The property set was updated to reflect the latest market dynamics, including the removal of functionally obsolete properties and the addition of recently completed developments. Inventory (s.f.) Quarterly total net absorption (s.f.) YTD total net absorption (s.f.) YTD total net absorption (% of stock) Total availability (%) Average total asking rent ($ p.s.f.) Quarterly Completions (s.f.) YTD Completions (s.f.) Under construction (s.f.) Market Totals Warehouse & Distribution 108,941,866 913,200 913,200 0.8% 4.8% $4.01 1,025,000 1,025,000 142,324 Manufacturing 131,218,878 16,231 16,231 0.0% 3.2% $3.58 0 0 380,000 Totals 240,160,744 929,431 929,431 0.4% 3.9% $3.79 1,025,000 1,025,000 522,324 Flex/R&D 11,638,043 37,372 37,372 0.3% 10.6% $7.33 0 0 485,000 Northeast Grand Rapids Warehouse & Distribution 7,011,332 0 0 0.0% 0.0% $0.00 0 0 0 Manufacturing 7,955,299 0 0 0.0% 0.2% $5.24 0 0 0 Totals 14,966,631 0 0 0.0% 0.1% $5.24 0 0 0 Flex/R&D 296,671 4,165 4,165 1.4% 0.0% NA 0 0 0 Northwest Grand Rapids Warehouse & Distribution 9,198,576 57,852 57,852 0.6% 3.8% $4.30 0 0 0 Manufacturing 12,444,775 72,351 72,351 0.6% 5.3% $2.55 0 0 300,000 Totals 21,643,351 130,203 130,203 0.6% 4.7% $3.27 0 0 300,000 Flex/R&D 1,237,570 0 0 0.0% 2.7% NA 0 0 0 Southeast Grand Rapids Warehouse & Distribution 33,490,968 844,174 844,174 2.5% 3.7% $4.07 850,000 850,000 0 Manufacturing 28,820,151 8,674 8,674 0.0% 6.3% $3.28 0 0 0 Totals 62,311,119 852,848 852,848 1.4% 4.9% $3.67 850,000 850,000 0 Flex/R&D 3,528,847 -23,229 -23,229 -0.7% 7.8% $8.87 0 0 0 Southwest Grand Rapids Warehouse & Distribution 14,533,323 -38,978 -38,978 -0.3% 7.2% $3.36 0 0 119,000 Manufacturing 28,278,821 40,606 40,606 0.1% 1.2% $4.14 0 0 0 Totals 42,812,144 1,628 1,628 0.0% 3.2% $3.61 0 0 119,000 Flex/R&D 888,834 -650 -650 -0.1% 4.1% $7.63 0 0 0 Southwest Michigan Warehouse & Distribution 22,165,884 -99,858 -99,858 -0.5% 5.3% $4.09 0 0 0 Manufacturing 24,121,321 -105,400 -105,400 -0.4% 1.2% $6.94 0 0 0 Totals 46,287,205 -205,258 -205,258 -0.4% 3.2% $5.07 0 0 0 Flex/R&D 3,562,445 -42,958 -42,958 -1.2% 10.9% $7.24 0 0 485,000 West Shore Warehouse & Distribution 22,541,783 150,010 150,010 0.7% 6.4% $4.06 175,000 175,000 23,324 Manufacturing 29,598,511 0 0 0.0% 3.7% $3.61 0 0 80,000 Totals 52,140,294 150,010 150,010 0.3% 4.9% $3.81 175,000 175,000 103,324 Flex/R&D 2,123,676 100,044 100,044 4.7% 23.6% $7.56 0 0 0