JLL Detroit Office Insight & Statistics - Q1 2019Harrison West
Over 202,000 square feet of space was absorbed in the first quarter, with notable transactions taking place in the city and the suburbs. Chicago-based Coyote Logistics made headlines with the announcement of a 58,000-square-foot lease at Bedrock’s Assembly Building at 1700 West Fort Street, bringing 500 new jobs to the burgeoning Corktown neighborhood. Google announced plans to expand their 29,000-square-foot office at Little Caesars arena.
JLL Detroit Office Insight & Statistics - Q3 2017Harrison West
As conditions continue to improve in Detroit, we will see sustained rent growth and dropping vacancies. Looking ahead - we can prepare to see cranes amongst the downtown skyline, as Bedrock readies to break ground on the Hudson’s development on Woodward in December.
JLL Detroit Office Insight & Statistics - Q1 2018Harrison West
2018 is poised to be another great year of growth for Detroit’s office market. With transformational developments underway like the Hudson’s site downtown, and others in the pipeline like the Monroe Block and the to-be-determined jail site development, the buzz downtown is palpable.
JLL Detroit Office Insight & Statistics – Q2 2016Aaron Moore
The quagmire persists – high demand and not enough supply. CBD vacancy rates for the second quarter were 14.5 percent as office construction has come to a virtual halt.
JLL Detroit Office Insight & Statistics - Q4 2018Harrison West
The fourth quarter of 2018 was highlighted by yet another high-profile groundbreaking, as Bedrock began work on the Monroe Blocks development, a mixed-use project totaling over 1.4 million square feet that will bring approximately 847,000 square feet to the CBD office inventory. Market-wide, total vacancy fell by 60 basis points to 20.2 percent as 149,007 square feet was absorbed, while average asking rents rose by 1.0 percent up to $19.85 per square foot.
JLL Detroit Office Insight & Statistics - Q3 2019Harrison West
As we look ahead to the end of 2019, we can expect the stable conditions in the Detroit office market to remain. Downtown’s Class A vacancy remains extremely tight outside of the Renaissance Center and will likely stay that way until new inventory is added to the market.
We are pleased to share the second quarter office research reports for Cincinnati. Below you will find a link to the reports as well as a summary of the key themes examined in the second quarter research.
JLL Detroit Office Insight & Statistics - Q2 2017Harrison West
As fundamentals continue to improve in Detroit’s office market, we will see rent growth and continued development activity. Downtown, expect to see increased mixed-use projects along Woodward, while in the suburbs build-to-suit projects will remain prevalent.
Vacancy across the region is down 180 basis points from the third quarter of last year. Much of the gains have come in Class B properties, which have absorbed three times more square footage in 2016 than Class A properties. Find out more in our Q3 Office Outlook.
JLL Grand Rapids Office Insight & Statistics - Q2 2018Harrison West
The second quarter showed continued positive trends in the Grand Rapids office market. Total vacancy fell to 10.0 percent as nearly 190,000 square feet of space has been absorbed so far in 2018. Rent growth has slowed this year with current average asking rents coming in at $18.02.
JLL Grand Rapids Office Insight & Statistics - Q4 2019Harrison West
The fourth quarter was a continuation of the stable conditions in the Grand Rapids office market. Both rent growth and vacancies remained relatively flat year-over-year, and most of the quarter’s leasing activity was made up of transactions under 10,000 square feet.
JLL Grand Rapids Office Insight & Statistics - Q1 2019Harrison West
Looking ahead, we expect conditions to remain stable. Both vacancy and rent growth have leveled off over the past several quarters. Moving forward, construction figures will increase as Studio Park’s office component breaks ground and development along the East Paris Corridor increases.
Leasing activity slowly recovers to pre-pandemic levels. While the market continues to feel the impact from COVID, Duolingo expands 38,000 s.f. at Liberty East at Pittsburgh’s highest recorded rental rate, suggesting that there is still an appetite for new construction within the urban core
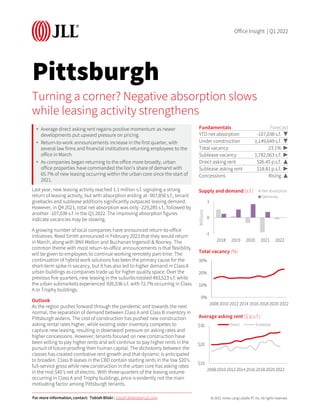
Uncertainty looms as sublease space availability
and vacancy reach record highs
• Available sublease space has surpassed 2.1 million s.f., making up
about 14% of all available space for lease in Pittsburgh’s inventory.
• Q2 marked the 7th consecutive quarter of rising vacancy rates.
• The majority of year-to-date new leasing activity has been equally
divided among the highest performing submarkets: CBD, Fringe, and
Northern 1-79/ Cranberry.
JLL Detroit Office Insight & Statistics - Q2 2019Harrison West
The second quarter in the Detroit office market brought a decrease in vacancy and continued rent growth. Total vacancy across the market is currently at 18.5 percent, while average asking rents are $19.85 per square foot, representing a 2.1 percent increase year-over-year...
JLL Detroit Office Insight & Statistics - Q3 2018Harrison West
Conditions in Detroit’s office market remain stable, even amidst a slight uptick in vacancy the past two quarters. Current total vacancy in the urban and suburban submarkets are 15.7 percent and 22.3 percent, respectively. Asking rents market-wide have increased 1.0 percent in the past three months, currently at $19.65 per-square-foot. Detroit’s office market saw more positive headlines in the third quarter on the heels of Ford’s Michigan Central Station announcement. Cadillac made public their intention to move back to the Detroit area after almost four years in Manhattan and Chemical Bank announced plans to construct a 250,000-square-foot headquarters in downtown Detroit.
New development is multiplying in the Fringe and Oakland / East End submarket. Demand from the technology industry continues to brew. However, leasing activity has not yet brought absorption back to positive.
The third quarter saw the delivery of the downtown streetcar and the GE Global Operations Center at the banks, both projects were two of Cincinnati’s most highly anticipated deliveries in years. Developers continued to cautiously move forward with planned projects as they look to land large users for preleasing before they begin construction.
Industrial developers and investors are in touch with the pulse of the industrial marketplace and are taking aggressive steps to meet the potential increase in demand for modern, Class A space.
As we anticipated in the first quarter, leasing activity from the previous year has brought further reduction in the vacancy rate. With several large lease expansions commencing from Centene, Nestlé Purina, Clarkson Eye Care, and Varsity Tutors, total vacancy is below 14.0 percent for the first time since 2008. Find out more in our Q2 2016 Office Outlook
JLL Pittsburgh Office Outlook - Q4 2015Andrew Batson
JLL's Pittsburgh Office Outlook identifies the top trends driving the local real estate market. The report also includes an analysis of market statistics, leasing activity, notable sales transactions and economic conditions.
The Pittsburgh office market had quite the summer in 2018. More tenants flock to the urban core, 420 Boulevard of the Allies sold, and District Fifteen is fully leased before delivering.
Similar to Pittsburgh Office Insight & Stats Q1 2022 (20)
There was a slowing of Industrial leasing activity for the summer, but as Amazon proposes to expand their footprint, they have introduced a new type of warehouse to the region.
The Pittsburgh market has felt the effects of COVID in other property types, but industrial continues to move forward due to e-commerce and distribution demand.
Pittsburgh's industrial market was strong and steady going into the new decade. The COVID-19 outbreak caused a pause in development, but Pittsburgh is positioned to rebound.
2019 ended the decade on high notes, as Pittsburgh gets its first VC-funded tech unicorn and the former Civic Arena site gets an anchor tenant for the tower.
Pittsburgh is going into the fourth quarter with positive absorption. The market's unique position as a central distribution hub and hub to a petrochemical facility will continue to drive activity.
Flat available for sale
Location- Tupudana, Ranchi
Savitri enclave
Area- 3BHK
Rate- 4000/sq.ft.
Super Build Up Area-1629 sq.ft.
Build-up area-1253 sq.ft.
Rate- 65lakh16k(approx)
Floor available- Flat available in all floor(G+12)
Balcony- 2
Washroom- 2
Parking - CAR PARKING
Amenities- Joggers track,temple, children's park,gym,banquet hall (5 Lakh)
Possession year (Handover year)- Dec 2025
Outside View from the apartment and flat balcony is very beautiful.
For more information contact AASHIYANA STAR PROPERTIES
7766900371
One FNG by Group 108 Sector 142 Noida Construction UpdateOne FNG
One FNG by Group 108 is launching a new commercial project in Sector 142 Noida. Office space and high street retail shops on the FNG and Noida Expressway. For more information visit the website https://www.onefng.com/
Scanning tenants in NYC requires a thorough and compliant approach to ensure you find reliable renters. For a positive rental experience, consider hiring a property management service. Belgium Management LLC specializes in NYC rental property management and tenant relationship management. We prioritize tenant satisfaction, making us a trusted name in New York property management. Our dedicated team ensures tenants feel valued and supported throughout their lease.
500 acres of brilliance await you here at Riverview City which offers modern living, effortless convenience, and a beautiful natural setting. It is a mega township by Magarpatta City in Loni Kalbhor, Pune. Enjoy easy access to work, schools, and fun while experiencing a perfect work-life balance.
Visit - magarpattacity.developerprojects.in
Presentation to Windust Meadows HOA Board of Directors June 4, 2024: Focus o...Joseph Lewis Aguirre
Presentation to Windust Meadows HOA Board of Directors June 4, 2024: Focus on Public Safety as Job #1, Engagement, Wealth of HOA, Branding, Communication, Culture, Civic Responsibility
MC Heights-Best Construction Company in jhanglaraibfatim009
MC Heights stands as the epitome of excellence in construction within Jhang. With a commitment to unparalleled quality and innovative design, MC Heights redefines urban living in the heart of Jhang. Offering luxurious residential spaces, cutting-edge commercial complexes, and vibrant community areas, MC Heights caters to the diverse needs of modern lifestyles. Our dedication to superior craftsmanship and customer satisfaction ensures that every aspect of MC Heights exceeds expectations, making it the premier choice for those seeking unparalleled sophistication and comfort in Jhang.
Oeiras Tech City, Developed by RE Capital and REIG, Will Become Lisbon's Futu...Newman George Leech
Oeiras Tech City, a historic development in the Oeiras municipality of Lisbon, is acquired by RE Capital and REIG. It is located on a 93,000-square-meter plot of land and combines co-living, business, and residential areas. It highlights ESG principles and is close to Tagus Park, which improves the urban landscape of Lisbon.
Urbanrise Paradise on Earth - Unveiling Unprecedented Luxury in Exquisite Vil...JagadishKR1
Immerse yourself in the epitome of luxury living at Urbanrise Paradise on Earth. These opulent 4 BHK villas, nestled off the prestigious Kanakapura Road in Bangalore, redefine elegance and sophistication. With meticulous craftsmanship, breathtaking design, and unparalleled amenities, Urbanrise Paradise on Earth offers a sanctuary where every moment is infused with luxury and serenity. Experience a life of grandeur and indulgence at this exclusive residential enclave.
Keep Your Home Naturally Cool and Warm Out Change in Seasons
Vinra Construction is a private limited company registered under the ROC. The management has an experience of over 15 years of understanding the needs and delivering apt solutions to the end users We are providing turnkey solutions in construction fields. like Construction, Interior Designing Facility Management, Plantation Management, etc..
Vinra Construction Tech Enabled Company for Eco-Friendly Home Construction
Contact With Vinra for a Greener Future >>> Call us @ 888 4898 765
Need MCA leads? No sweat! MCAs are great for small biz funding. Learn how to snag top-notch leads: businesses needing cash, with repayment ability, decision-makers, and accurate contacts. Use content, social ads, lead platforms, partnerships, and capture processes for quality leads.
https://www.leadgeneration.media/blog/b/streamline-your-mca-sales-process-with-pre-qualified-leads
Referans Bahcesehir which is being constructed, in the center of the most regional destination as Bahçeşehir, shines out with its central location and unique landscape including social facilities such as a fitness center, sauna, sports facilities, children’s playground and recreational areas.
Not only drawing attention for immediate surroundings including commercial centers and private schools but also providing the easily accessible location with closeness to Tem Highway and connection roads, ongoing construction of 3rd Bridge Connection roads and Metro Projects
Bahcesehir is a rising value in the great city of Istanbul… Located at a new transportation junction in the northwest of the City… Located at such a spot that the access roads for the 3rd bridge and for the 3rd Airport will reach the region in 2016. The Marmaray and the Subway will extend all the way to Referans Bahcesehir respectively in 2018 and 2019.
465 flats and 34 stores are designed with an outstanding approach and arranged with a unique perspective offering the following options: 1 plus 1, 2 plus 1, 3 plus 1, 3.5 plus 1, 4 plus 1, and 4.5 plus 1. It is planned so as to safeguard you and your loved ones based upon a modern, technological safety approach. As you experience the joy and luxury here, you will be content and feet at ease.
It is worth seeing both inside and outside with heart-warming cafes, tasty restaurants and elegant stores… And it is ready to offer a vivacious social life with a warm and cozy space design.
A folding swimming pool and indoor swimming pools, playgrounds, Turkish bath, sauna… It has them all. Everything you need for your well-being and for having a pleasant time will be at your service. You simply need to align the rhythm of life with the rhythm of Referans Bahcesehir.
https://listingturkey.com/property/referans-bahcesehir/
Green Homes, Islamabad Presentation .pdfticktoktips
Green Homes Islamabad offers beautifully designed 5, 8, and 10 Marla homes near the airport and motorway. Enjoy luxury, convenience, and high rental returns in a prime location.
Torun Center Residences Istanbul - Listing TurkeyListing Turkey
THERE IS LIFE IN ITS CENTER!
The most energetic spot of the city that will add utterly different pleasures to your life, with a park that will make Istanbul breathe, delighting indoor and outdoor bistros, cafes, restaurants, the brand-new Food Hall concept, where dozens of unique tastes are served together, market area, cinema, theater, fitness club, SPA and event venue...
All the pleasures that will enrich your lives are awaiting you on the most beautiful side of the city, at Torun Center Residences. In Mecidiyeköy, where the heart of Istanbul beats, business, life and entertainment opportunities are located at the exact center, at Torun Center, the most beautiful side of the city.
Penthouse apartments and different styles of flats from 1 + 1 to 4 + 1, from 100 to 425 square meters in a 42-story residence tower, have been designed for those who want to live in the center of magnificence. Torun Center is the redefinition of a better life with specially landscaped floor gardens, apartment options with private balconies, and automatic glass systems equipped with Trickle Ventilation that offers clean air comfort.
Business and life in the same place
Excellent service
Torun Center has many delightful details, from a swimming pool to sunbathing and resting terrace. With 24/7 concierge services, 24/7 security, valet, technical service, closed-circuit camera system (CCTV), central heating and cooling system, it makes your life easier.
Delightful details
The two-story Torun Center Lounge, with its indoor and outdoor seating areas, children's playroom, private dining and TV lounge, promises unforgettable memories to you and your loved ones with its unique Istanbul view.
Neighboring to the most pleasant square of Istanbul
A few steps from the Torun Center Residences, you can reach the city's most modern city square and open the doors of a quality city life. Torun Center Residences brings together on the same project the long-awaited city life for Istanbul and gourmet restaurants, cafes, gym and SPA, and state-of-the-art cinema and Artı Stage, hosting the most famous plays of the season.
Located at the intersection of alternative public transportation options such as the metro and Metrobus, Torun Center comes to the fore as the most accessible office for both sides of Istanbul. With a central location and rich transportation lines, Torun Center offices make life easier for employees and increase productivity.
Rixos Tersane Istanbul Residences Brochure_May2024_ENG.pdfListing Turkey
Tersane Suites Residences is a luxurious real estate project located in the heart of Istanbul, next to the beautiful Golden Horn. This unique development offers hotel concept residences with Rixos management, making it the perfect choice for both homeowners and investors.
The Tersane Suites Residences offers a wide range of options, from studio apartments to spacious four-bedroom units, all designed to the highest standard. The suites are finished with high-quality materials and feature modern, open-plan living spaces, fully-equipped kitchens, and large balconies with stunning views of the city and sea.
One of the standout features of Tersane Suites Residences is the Rixos management, which provides a truly exclusive and upscale living experience. Residents will have access to a range of luxury amenities, including a fitness center, spa, and indoor and outdoor swimming pools. Plus, the on-site restaurants and cafes provide a taste of the local and international cuisine.
The Tersane Suites Residences also offers a great opportunity for investors, as it provides a rental guarantee program. This means that investors can enjoy a steady income stream, with the peace of mind that their property is being managed by a reputable and experienced team.
The location of Tersane Suites Residences is also unbeatable, with easy access to the city’s main transportation links and within close proximity to the historic center, making it the perfect base for exploring all that Istanbul has to offer.
The SVN® organization shares a portion of their new weekly listings via their SVN Live® Weekly Property Broadcast. Visit https://svn.com/svn-live/ if you would like to attend our weekly call, which we open up to the brokerage community.
Investing In The US As A Canadian… And How To Do It RIGHT!! (feat. Erwin Szet...Volition Properties
=== Investing In The US As A Canadian… And How To Do It RIGHT!! (feat. Erwin Szeto) ===
Ever been curious about Real Estate Investing in the US?? At Volition, for the past 14 years, we have been focused on helping investors invest in over $250M of real estate and generate $100M of wealth in the Toronto market, but we are always open to learning more about other business models and learning from other investors.
The US has always been an intriguing market to invest in. But the US is a big place… if you’re interested in investing in the US, you probably have a lot of questions, like:
☑️ Specifically WHERE should you invest?
☑️ What are the best markets to invest in and why?
☑️ How much are property prices there?
☑️ What are the returns like?
☑️ What is cashflow like?
☑️ Compared to investing in Toronto or other cities in Ontario, what are the benefits / tradeoffs?
☑️ What ownership structure should I use?
☑️ What are the tax implications?
☑️ Can I get financing?
☑️ What are tenants like?
Enter Erwin Szeto, a longtime friend of Volition. Since 2005, Erwin Szeto and his team have navigated the challenging landscape of being landlords in Ontario. Now, they are shifting their focus and guiding their clients' investments toward the more landlord-friendly environment of the USA. This decision comes after assisting Canadian clients in transacting over $440,000,000 in income properties. Faced with issues like affordability constraints, tenant-friendly laws, rent control, and rental licensing in Canada, Erwin sees a clear opportunity in the U.S. Here, there is a significant influx of investments leading to the creation of high-paying manufacturing jobs. Erwin and his clients are poised to capitalize on these opportunities where landlord rights are stronger and there is no rent control.
To facilitate this transition, Erwin has partnered with and become a client of SHARE, a one-stop-shop U.S. Asset Manager. Founded by Canadians for Canadians, SHARE enables as passive an ownership experience as possible for landlords in the U.S., while still maintaining direct, 100% ownership.
Erwin is “Making Real Estate Investing Great Again”!!
Website: https://www.infinitywealth.ca/
Facebook: https://www.facebook.com/iwinrealestate and https://www.facebook.com/ErwinSzetoOfficial
Podcast: https://www.truthaboutrealestateinvesting.ca/
Instagram: https://www.instagram.com/iwinrealestate/ and https://www.instagram.com/erwinszeto/
BricknBolt Understanding Load-Bearing Walls and Their Structural Support in H...BrickAndBolt
Load-bearing walls are the backbone of any home construction, providing crucial structural support that carries the weight of the house above. For companies like Brick and Bolt Mysore and Bricknbolt Faridabad, understanding and properly implementing these elements are key to constructing safe and durable buildings.
Avrupa Konutlari Yenimahalle - Listing TurkeyListing Turkey
Welcome to Avrupa Konutları Yenimahalle, where luxury living meets unparalleled convenience in the heart of Istanbul. Developed by Artaş Holding, one of Turkey’s leading construction companies, this prestigious residential project offers a contemporary lifestyle experience like no other.
https://listingturkey.com/property/avrupa-konutlari-yenimahalle/
Brigade Insignia offers meticulously designed apartments with modern architecture and premium finishes. The project features spacious 3,3.5,4 and 5 BHK units, each thoughtfully planned to provide maximum comfort, natural light, and ventilation.
https://www.newprojectbangalore.com/brigade-insignia-yelahanka-bangalore.html