SlideShare a Scribd company logo
© 2018 Jones Lang LaSalle IP, Inc. All rights reserved. All information contained herein is from sources deemed reliable; however, no representation or warranty is made to the accuracy thereof.
Q3 2018
Grand Rapids
Office Insight
Overall vacancy in the Grand Rapids metro is currently 10.2 percent, down 2.1
percent year-over-year. Asking rents downtown seem to have leveled off this
year, consistently hovering around $20.00 per-square-foot each quarter and
currently sitting at $20.45 per-square-foot. There are 174,000 square feet of
office space under construction, most of which is in the Warner Building
development, set to deliver in early 2019. The $55.0 million project will be
home to Warner Norcross & Judd, Chemical Bank, and others.
Third quarter leasing activity was highlighted by West Michigan Center for the
Arts and Technology taking 22,000 square feet on the third floor of the 614
First Street development on the West Side. Other leases of note include
Rodolfo Gonzales Interior Design’s move into a 4,200-square-foot space at 40
Monroe Center downtown, GMB taking 7,000 feet at 648 Monroe Ave NW and
Henn Lesperance PLC inking a 4,500-square-foot lease at 32 Market Ave SW.
Sales activity was sluggish yet again this quarter, with one deal of note being
2905 Lucerne Dr. SE, which sold for $2,295,000, or $76.00 per square foot.
There are just not enough properties available for sale to account for an
increase in capital markets activity.
Outlook
Looking ahead to the remainder of 2018, we expect to see rents hold steady.
The downtown market will likely remain relatively unchanged until new
deliveries hit the market. The delivery of Warner Tower could create a vacuum
in the downtown market, as Warner Norcross & Judd vacates their current
spaces downtown consisting of 90,000 square feet to consolidate at the new
building. It will be interesting to keep an eye on the Studio Park development
and when they break ground on the office component. This project will add
more Class A space to the market in the coming years and likely drive rents up
as well.
Fundamentals Forecast
YTD net absorption 255,622 s.f. ▲
Under construction 178,000 s.f. ▲
Total vacancy 10.2% ▶
Average asking rent (gross) $18.44 p.s.f. ▶
Concessions Stable ▶
-200,000
0
200,000
400,000
2015 2016 2017 YTD 2018
Supply and demand (s.f.) Net absorption
Deliveries
Rent growth slows in downtown Grand Rapids
15.1% 14.8%
12.9%
10.2%
2015 2016 2017 YTD 2018
Total vacancy
$0.00
$10.00
$20.00
$30.00
2015 2016 2017 YTD 2018
Average asking rents ($/s.f.) Class A
Class B
For more information, contact: Harrison West | harrison.west@am.jll.com
• Rent growth has slowed in the downtown submarket, having leveled off
around $20.00 per-square-foot.
• Construction on Warner Tower nears completion, as does development
on the West Side at 614 First Street.
• Minimal sales activity occurred in the third quarter, as there is a dearth of
available office product on the market for sale.
© 2018 Jones Lang LaSalle IP, Inc. All rights reserved. All information contained herein is from sources deemed reliable; however, no representation or warranty is made to the accuracy thereof.
Q3 2018
Office Statistics
Grand Rapids
For more information, contact: Harrison West | harrison.west@am.jll.com
Class
Inventory
(s.f.)
Total net
absorption
(s.f.)
YTD total net
absorption
(s.f.)
YTD total net
absorption (%
of stock)
Direct
vacancy (%)
Total
vacancy (%)
Average
direct asking
rent ($ p.s.f.)
YTD
Completions
(s.f.)
Under
Development
(s.f.)
Downtown Totals 5,272,368 14,374 55,755 1.1% 9.8% 10.5% $20.45 0 178,000
Northeast Totals 764,896 11,156 47,956 6.3% 5.4% 5.4% $16.88 0 0
Northwest Totals 411,996 0 0 0.0% 0.0% 7.5% N/A 0 0
Southeast Totals 3,884,259 -13,136 152,038 3.9% 10.4% 10.7% $16.32 0 0
Southwest Totals 461,442 -5,936 -127 0.0% 13.7% 13.7% $14.03 0 0
Suburbs Totals 5,522,593 -7,916 199,867 3.6% 9.2% 10.0% $15.98 0 0
West Michigan Totals 10,794,961 6,458 255,622 2.4% 9.5% 10.2% $18.44 0 178,000
Downtown A 1,739,199 29,396 83,686 4.8% 10.4% 11.0% $22.38 0 178,000
Northeast A 121,746 0 0 0.0% 0.0% 0.0% N/A 0 0
Southeast A 574,983 -11,060 -6,488 -1.1% 18.3% 18.3% $18.39 0 0
Southwest A 18,800 0 0 0.0% 0.0% 0.0% N/A 0 0
Suburbs A 715,529 -11,060 -6,488 -0.9% 14.7% 14.7% $18.39 0 0
West Michigan A 2,454,728 18,336 77,198 3.1% 11.6% 12.1% $21.17 0 178,000
Downtown B 3,533,169 -15,022 -27,931 -0.8% 9.6% 10.2% $19.22 0 0
Northeast B 643,150 11,156 47,956 7.5% 6.4% 6.4% $16.88 0 0
Northwest B 411,996 0 0 0.0% 0.0% 7.5% N/A 0 0
Southeast B 3,309,276 -2,076 158,526 4.8% 9.0% 9.4% $15.51 0 0
Southwest B 442,642 -5,936 -127 0.0% 14.3% 14.3% $14.03 0 0
Suburbs B 4,807,064 3,144 206,355 4.3% 8.4% 9.3% $15.35 0 0
West Michigan B 8,340,233 -11,878 178,424 2.1% 8.9% 9.7% $17.23 0 0

More Related Content

What's hot

What's hot (20)

JLL Pittsburgh Industrial Insight & Statistics - Q3 2017
JLL Pittsburgh Industrial Insight & Statistics - Q3 2017JLL Pittsburgh Industrial Insight & Statistics - Q3 2017
JLL Pittsburgh Industrial Insight & Statistics - Q3 2017
 
JLL Grand Rapids Office Insight & Statistics - Q2 2018
JLL Grand Rapids Office Insight & Statistics - Q2 2018JLL Grand Rapids Office Insight & Statistics - Q2 2018
JLL Grand Rapids Office Insight & Statistics - Q2 2018
 
JLL Pittsburgh Office Insight & Statistics - Q1 2018
JLL Pittsburgh Office Insight & Statistics - Q1 2018JLL Pittsburgh Office Insight & Statistics - Q1 2018
JLL Pittsburgh Office Insight & Statistics - Q1 2018
 
JLL Cleveland Office Outlook: Q4 2017
JLL Cleveland Office Outlook: Q4 2017JLL Cleveland Office Outlook: Q4 2017
JLL Cleveland Office Outlook: Q4 2017
 
JLL Grand Rapids Office Insight & Statistics - Q4 2018
JLL Grand Rapids Office Insight & Statistics - Q4 2018JLL Grand Rapids Office Insight & Statistics - Q4 2018
JLL Grand Rapids Office Insight & Statistics - Q4 2018
 
JLL Detroit Office Insight & Statistics - Q4 2017
JLL Detroit Office Insight & Statistics - Q4 2017JLL Detroit Office Insight & Statistics - Q4 2017
JLL Detroit Office Insight & Statistics - Q4 2017
 
SVNR Office Market Report Q116
SVNR Office Market Report Q116SVNR Office Market Report Q116
SVNR Office Market Report Q116
 
JLL Pittsburgh Office Insight & Statistics - Q4 2019
JLL Pittsburgh Office Insight & Statistics - Q4 2019JLL Pittsburgh Office Insight & Statistics - Q4 2019
JLL Pittsburgh Office Insight & Statistics - Q4 2019
 
JLL Grand Rapids Office Insight & Statistics - Q4 2017
JLL Grand Rapids Office Insight & Statistics - Q4 2017JLL Grand Rapids Office Insight & Statistics - Q4 2017
JLL Grand Rapids Office Insight & Statistics - Q4 2017
 
JLL Grand Rapids Office Insight & Statistics - Q2 2017
JLL Grand Rapids Office Insight & Statistics - Q2 2017JLL Grand Rapids Office Insight & Statistics - Q2 2017
JLL Grand Rapids Office Insight & Statistics - Q2 2017
 
JLL Detroit Office Insight & Statistics - Q3 2018
JLL Detroit Office Insight & Statistics - Q3 2018JLL Detroit Office Insight & Statistics - Q3 2018
JLL Detroit Office Insight & Statistics - Q3 2018
 
JLL Grand Rapids Office Insight & Statistics - Q3 2017
JLL Grand Rapids Office Insight & Statistics - Q3 2017JLL Grand Rapids Office Insight & Statistics - Q3 2017
JLL Grand Rapids Office Insight & Statistics - Q3 2017
 
JLL Cleveland Office Outlook: Q4 2018
JLL Cleveland Office Outlook: Q4 2018JLL Cleveland Office Outlook: Q4 2018
JLL Cleveland Office Outlook: Q4 2018
 
JLL Cincinnati Office Insight & Statistics - Q3 2016
JLL Cincinnati Office Insight & Statistics - Q3 2016JLL Cincinnati Office Insight & Statistics - Q3 2016
JLL Cincinnati Office Insight & Statistics - Q3 2016
 
JLL West Michigan Industrial Insight & Statistics - Q2 2018
JLL West Michigan Industrial Insight & Statistics - Q2 2018JLL West Michigan Industrial Insight & Statistics - Q2 2018
JLL West Michigan Industrial Insight & Statistics - Q2 2018
 
JLL Detroit Office Insight & Statistics - Q1 2018
JLL Detroit Office Insight & Statistics - Q1 2018JLL Detroit Office Insight & Statistics - Q1 2018
JLL Detroit Office Insight & Statistics - Q1 2018
 
JLL Cincinnati Office Insight & Statistics - Q2 2016
JLL Cincinnati Office Insight & Statistics - Q2 2016JLL Cincinnati Office Insight & Statistics - Q2 2016
JLL Cincinnati Office Insight & Statistics - Q2 2016
 
JLL Ann Arbor Office Insight & Statistics - Spring 2018
JLL Ann Arbor Office Insight & Statistics - Spring 2018JLL Ann Arbor Office Insight & Statistics - Spring 2018
JLL Ann Arbor Office Insight & Statistics - Spring 2018
 
Pittsburgh Office Insight & Stats Q1 2022
Pittsburgh Office Insight & Stats Q1 2022Pittsburgh Office Insight & Stats Q1 2022
Pittsburgh Office Insight & Stats Q1 2022
 
Cushman & Wakefield Montreal Americas Marketbeat Office Q12019 #CRE #RealEstate
Cushman & Wakefield Montreal Americas Marketbeat Office Q12019  #CRE #RealEstateCushman & Wakefield Montreal Americas Marketbeat Office Q12019  #CRE #RealEstate
Cushman & Wakefield Montreal Americas Marketbeat Office Q12019 #CRE #RealEstate
 

Similar to JLL Grand Rapids Office Insight & Statistics - Q3 2018

Similar to JLL Grand Rapids Office Insight & Statistics - Q3 2018 (20)

JLL Grand Rapids Office Insight & Statistics - Q3 2019
JLL Grand Rapids Office Insight & Statistics - Q3 2019JLL Grand Rapids Office Insight & Statistics - Q3 2019
JLL Grand Rapids Office Insight & Statistics - Q3 2019
 
JLL Grand Rapids Office Insight & Statistics - Q1 2019
JLL Grand Rapids Office Insight & Statistics - Q1 2019JLL Grand Rapids Office Insight & Statistics - Q1 2019
JLL Grand Rapids Office Insight & Statistics - Q1 2019
 
JLL Pittsburgh Office Insight & Statistics - Q1 2020
JLL Pittsburgh Office Insight & Statistics - Q1 2020JLL Pittsburgh Office Insight & Statistics - Q1 2020
JLL Pittsburgh Office Insight & Statistics - Q1 2020
 
JLL Detroit Office Insight & Statistics – Q2 2016
JLL Detroit Office Insight & Statistics – Q2 2016JLL Detroit Office Insight & Statistics – Q2 2016
JLL Detroit Office Insight & Statistics – Q2 2016
 
JLL Grand Rapids Office Insight - Fall 2016
JLL Grand Rapids Office Insight - Fall 2016JLL Grand Rapids Office Insight - Fall 2016
JLL Grand Rapids Office Insight - Fall 2016
 
JLL Pittsburgh Industrial Insight & Statistics - Q1 2018
JLL Pittsburgh Industrial Insight & Statistics - Q1 2018JLL Pittsburgh Industrial Insight & Statistics - Q1 2018
JLL Pittsburgh Industrial Insight & Statistics - Q1 2018
 
JLL West Michigan Industrial Insight & Statistics - Q1 2020
JLL West Michigan Industrial Insight & Statistics - Q1 2020JLL West Michigan Industrial Insight & Statistics - Q1 2020
JLL West Michigan Industrial Insight & Statistics - Q1 2020
 
JLL Detroit Office Insight & Statistics - Q2 2019
JLL Detroit Office Insight & Statistics - Q2 2019JLL Detroit Office Insight & Statistics - Q2 2019
JLL Detroit Office Insight & Statistics - Q2 2019
 
JLL - Tampa Bay 2018 Q1 Industrial Outlook
JLL - Tampa Bay 2018 Q1 Industrial OutlookJLL - Tampa Bay 2018 Q1 Industrial Outlook
JLL - Tampa Bay 2018 Q1 Industrial Outlook
 
JLL Cleveland Office Outlook: Q1 2018
JLL Cleveland Office Outlook: Q1 2018JLL Cleveland Office Outlook: Q1 2018
JLL Cleveland Office Outlook: Q1 2018
 
JLL Cleveland Office Outlook: Q1 2017
JLL Cleveland Office Outlook: Q1 2017JLL Cleveland Office Outlook: Q1 2017
JLL Cleveland Office Outlook: Q1 2017
 
JLL Detroit Office Insight & Statistics - Q4 2018
JLL Detroit Office Insight & Statistics - Q4 2018JLL Detroit Office Insight & Statistics - Q4 2018
JLL Detroit Office Insight & Statistics - Q4 2018
 
JLL Pittsburgh Office Insight & Statistics - Q3 2018
JLL Pittsburgh Office Insight & Statistics - Q3 2018JLL Pittsburgh Office Insight & Statistics - Q3 2018
JLL Pittsburgh Office Insight & Statistics - Q3 2018
 
JLL Cleveland Office Outlook: Q1 2018
JLL Cleveland Office Outlook: Q1 2018JLL Cleveland Office Outlook: Q1 2018
JLL Cleveland Office Outlook: Q1 2018
 
JLL Cleveland Office Outlook: Q1 2018
JLL Cleveland Office Outlook: Q1 2018JLL Cleveland Office Outlook: Q1 2018
JLL Cleveland Office Outlook: Q1 2018
 
JLL Cleveland Office Outlook: Q2 2018
JLL Cleveland Office Outlook: Q2 2018JLL Cleveland Office Outlook: Q2 2018
JLL Cleveland Office Outlook: Q2 2018
 
JLL Detroit Office Insight & Statistics - Q1 2019
JLL Detroit Office Insight & Statistics - Q1 2019JLL Detroit Office Insight & Statistics - Q1 2019
JLL Detroit Office Insight & Statistics - Q1 2019
 
JLL Pittsburgh Office Insight & Statistics - Q4 2018
JLL Pittsburgh Office Insight & Statistics - Q4 2018JLL Pittsburgh Office Insight & Statistics - Q4 2018
JLL Pittsburgh Office Insight & Statistics - Q4 2018
 
JLL Pittsburgh Office Insight & Statistics - Q3 2019
 JLL Pittsburgh Office Insight & Statistics - Q3 2019 JLL Pittsburgh Office Insight & Statistics - Q3 2019
JLL Pittsburgh Office Insight & Statistics - Q3 2019
 
JLL Detroit Office Insight & Statistics - Q2 2017
JLL Detroit Office Insight & Statistics - Q2 2017JLL Detroit Office Insight & Statistics - Q2 2017
JLL Detroit Office Insight & Statistics - Q2 2017
 

Recently uploaded

Property Rental Cumbria North West Guide
Property Rental Cumbria North West GuideProperty Rental Cumbria North West Guide
Property Rental Cumbria North West Guide
AskXX.com
 
UK Residential Property Sales Forms Guide
UK Residential Property Sales Forms GuideUK Residential Property Sales Forms Guide
UK Residential Property Sales Forms Guide
AskXX.com
 
Killer Referans Bahcesehir Catalog Listing Turkey
Killer Referans Bahcesehir Catalog Listing TurkeyKiller Referans Bahcesehir Catalog Listing Turkey
Killer Referans Bahcesehir Catalog Listing Turkey
Listing Turkey
 
Torun Center Residences Istanbul - Listing Turkey
Torun Center Residences Istanbul - Listing TurkeyTorun Center Residences Istanbul - Listing Turkey
Torun Center Residences Istanbul - Listing Turkey
Listing Turkey
 
Property Forms PDF Guide for UK Residential Property
Property Forms PDF Guide for UK Residential PropertyProperty Forms PDF Guide for UK Residential Property
Property Forms PDF Guide for UK Residential Property
AskXX.com
 
Property Rental Cumbria Location and Price Guide
Property Rental Cumbria Location and Price GuideProperty Rental Cumbria Location and Price Guide
Property Rental Cumbria Location and Price Guide
AskXX.com
 
Listing Turkey - Sinpaş Queen Bomonti Katalog
Listing Turkey - Sinpaş Queen Bomonti KatalogListing Turkey - Sinpaş Queen Bomonti Katalog
Listing Turkey - Sinpaş Queen Bomonti Katalog
Listing Turkey
 

Recently uploaded (20)

Property Rental Cumbria North West Guide
Property Rental Cumbria North West GuideProperty Rental Cumbria North West Guide
Property Rental Cumbria North West Guide
 
UK Residential Property Sales Forms Guide
UK Residential Property Sales Forms GuideUK Residential Property Sales Forms Guide
UK Residential Property Sales Forms Guide
 
Elegant Evergreen Homes - Timeless Luxury in Yelahanka, Bangalore
Elegant Evergreen Homes - Timeless Luxury in Yelahanka, BangaloreElegant Evergreen Homes - Timeless Luxury in Yelahanka, Bangalore
Elegant Evergreen Homes - Timeless Luxury in Yelahanka, Bangalore
 
Shapoorji Pallonji Plots Jadhavgadh Fort Pune.pdf
Shapoorji Pallonji Plots Jadhavgadh Fort Pune.pdfShapoorji Pallonji Plots Jadhavgadh Fort Pune.pdf
Shapoorji Pallonji Plots Jadhavgadh Fort Pune.pdf
 
Urbanrise Paradise on Earth - Unveiling Unprecedented Luxury in Exquisite Vil...
Urbanrise Paradise on Earth - Unveiling Unprecedented Luxury in Exquisite Vil...Urbanrise Paradise on Earth - Unveiling Unprecedented Luxury in Exquisite Vil...
Urbanrise Paradise on Earth - Unveiling Unprecedented Luxury in Exquisite Vil...
 
Killer Referans Bahcesehir Catalog Listing Turkey
Killer Referans Bahcesehir Catalog Listing TurkeyKiller Referans Bahcesehir Catalog Listing Turkey
Killer Referans Bahcesehir Catalog Listing Turkey
 
How to Scan Tenants in NYC - You Should Know!
How to Scan Tenants in NYC - You Should Know!How to Scan Tenants in NYC - You Should Know!
How to Scan Tenants in NYC - You Should Know!
 
Redevelopment in Pune Challenges & Solutions (PPT).pdf
Redevelopment in Pune Challenges & Solutions (PPT).pdfRedevelopment in Pune Challenges & Solutions (PPT).pdf
Redevelopment in Pune Challenges & Solutions (PPT).pdf
 
Bozeman Real Estate Market Reports April/May 2024
Bozeman Real Estate Market Reports April/May 2024Bozeman Real Estate Market Reports April/May 2024
Bozeman Real Estate Market Reports April/May 2024
 
Transforming Your Home Expert Guide to Renovations and Extensions in Upwey
Transforming Your Home Expert Guide to Renovations and Extensions in UpweyTransforming Your Home Expert Guide to Renovations and Extensions in Upwey
Transforming Your Home Expert Guide to Renovations and Extensions in Upwey
 
Torun Center Residences Istanbul - Listing Turkey
Torun Center Residences Istanbul - Listing TurkeyTorun Center Residences Istanbul - Listing Turkey
Torun Center Residences Istanbul - Listing Turkey
 
Sinpas Gokorman Presentation. - Listing Turkey
Sinpas Gokorman Presentation. - Listing TurkeySinpas Gokorman Presentation. - Listing Turkey
Sinpas Gokorman Presentation. - Listing Turkey
 
Salarpuria Sattva Lakeridge Neopolis Hyderabad.pdf.pdf
Salarpuria Sattva Lakeridge Neopolis Hyderabad.pdf.pdfSalarpuria Sattva Lakeridge Neopolis Hyderabad.pdf.pdf
Salarpuria Sattva Lakeridge Neopolis Hyderabad.pdf.pdf
 
Property Forms PDF Guide for UK Residential Property
Property Forms PDF Guide for UK Residential PropertyProperty Forms PDF Guide for UK Residential Property
Property Forms PDF Guide for UK Residential Property
 
Property Rental Cumbria Location and Price Guide
Property Rental Cumbria Location and Price GuideProperty Rental Cumbria Location and Price Guide
Property Rental Cumbria Location and Price Guide
 
Avrupa Konutlari Yenimahalle - Listing Turkey
Avrupa Konutlari Yenimahalle - Listing TurkeyAvrupa Konutlari Yenimahalle - Listing Turkey
Avrupa Konutlari Yenimahalle - Listing Turkey
 
Kohinoor Dhanori Apartments Pune Brochure
Kohinoor Dhanori Apartments Pune BrochureKohinoor Dhanori Apartments Pune Brochure
Kohinoor Dhanori Apartments Pune Brochure
 
2BHK-3BHK NEW FLAT FOR SALE IN TUPUDANA,RANCHI.
2BHK-3BHK NEW FLAT FOR SALE IN TUPUDANA,RANCHI.2BHK-3BHK NEW FLAT FOR SALE IN TUPUDANA,RANCHI.
2BHK-3BHK NEW FLAT FOR SALE IN TUPUDANA,RANCHI.
 
Listing Turkey - Sinpaş Queen Bomonti Katalog
Listing Turkey - Sinpaş Queen Bomonti KatalogListing Turkey - Sinpaş Queen Bomonti Katalog
Listing Turkey - Sinpaş Queen Bomonti Katalog
 
Sefakoy Sinpas Boulevard Istanbul - Presentation
Sefakoy Sinpas Boulevard Istanbul - PresentationSefakoy Sinpas Boulevard Istanbul - Presentation
Sefakoy Sinpas Boulevard Istanbul - Presentation
 

JLL Grand Rapids Office Insight & Statistics - Q3 2018

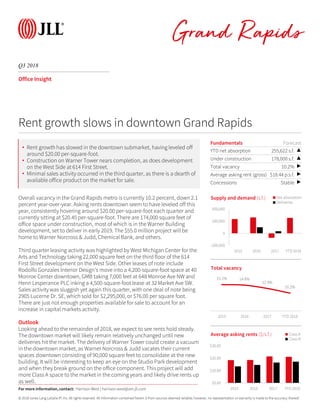
  • 1. © 2018 Jones Lang LaSalle IP, Inc. All rights reserved. All information contained herein is from sources deemed reliable; however, no representation or warranty is made to the accuracy thereof. Q3 2018 Grand Rapids Office Insight Overall vacancy in the Grand Rapids metro is currently 10.2 percent, down 2.1 percent year-over-year. Asking rents downtown seem to have leveled off this year, consistently hovering around $20.00 per-square-foot each quarter and currently sitting at $20.45 per-square-foot. There are 174,000 square feet of office space under construction, most of which is in the Warner Building development, set to deliver in early 2019. The $55.0 million project will be home to Warner Norcross & Judd, Chemical Bank, and others. Third quarter leasing activity was highlighted by West Michigan Center for the Arts and Technology taking 22,000 square feet on the third floor of the 614 First Street development on the West Side. Other leases of note include Rodolfo Gonzales Interior Design’s move into a 4,200-square-foot space at 40 Monroe Center downtown, GMB taking 7,000 feet at 648 Monroe Ave NW and Henn Lesperance PLC inking a 4,500-square-foot lease at 32 Market Ave SW. Sales activity was sluggish yet again this quarter, with one deal of note being 2905 Lucerne Dr. SE, which sold for $2,295,000, or $76.00 per square foot. There are just not enough properties available for sale to account for an increase in capital markets activity. Outlook Looking ahead to the remainder of 2018, we expect to see rents hold steady. The downtown market will likely remain relatively unchanged until new deliveries hit the market. The delivery of Warner Tower could create a vacuum in the downtown market, as Warner Norcross & Judd vacates their current spaces downtown consisting of 90,000 square feet to consolidate at the new building. It will be interesting to keep an eye on the Studio Park development and when they break ground on the office component. This project will add more Class A space to the market in the coming years and likely drive rents up as well. Fundamentals Forecast YTD net absorption 255,622 s.f. ▲ Under construction 178,000 s.f. ▲ Total vacancy 10.2% ▶ Average asking rent (gross) $18.44 p.s.f. ▶ Concessions Stable ▶ -200,000 0 200,000 400,000 2015 2016 2017 YTD 2018 Supply and demand (s.f.) Net absorption Deliveries Rent growth slows in downtown Grand Rapids 15.1% 14.8% 12.9% 10.2% 2015 2016 2017 YTD 2018 Total vacancy $0.00 $10.00 $20.00 $30.00 2015 2016 2017 YTD 2018 Average asking rents ($/s.f.) Class A Class B For more information, contact: Harrison West | harrison.west@am.jll.com • Rent growth has slowed in the downtown submarket, having leveled off around $20.00 per-square-foot. • Construction on Warner Tower nears completion, as does development on the West Side at 614 First Street. • Minimal sales activity occurred in the third quarter, as there is a dearth of available office product on the market for sale.
  • 2. © 2018 Jones Lang LaSalle IP, Inc. All rights reserved. All information contained herein is from sources deemed reliable; however, no representation or warranty is made to the accuracy thereof. Q3 2018 Office Statistics Grand Rapids For more information, contact: Harrison West | harrison.west@am.jll.com Class Inventory (s.f.) Total net absorption (s.f.) YTD total net absorption (s.f.) YTD total net absorption (% of stock) Direct vacancy (%) Total vacancy (%) Average direct asking rent ($ p.s.f.) YTD Completions (s.f.) Under Development (s.f.) Downtown Totals 5,272,368 14,374 55,755 1.1% 9.8% 10.5% $20.45 0 178,000 Downtown Totals 5,272,368 14,374 55,755 1.1% 9.8% 10.5% $20.45 0 178,000 Northeast Totals 764,896 11,156 47,956 6.3% 5.4% 5.4% $16.88 0 0 Northwest Totals 411,996 0 0 0.0% 0.0% 7.5% N/A 0 0 Southeast Totals 3,884,259 -13,136 152,038 3.9% 10.4% 10.7% $16.32 0 0 Southwest Totals 461,442 -5,936 -127 0.0% 13.7% 13.7% $14.03 0 0 Suburbs Totals 5,522,593 -7,916 199,867 3.6% 9.2% 10.0% $15.98 0 0 West Michigan Totals 10,794,961 6,458 255,622 2.4% 9.5% 10.2% $18.44 0 178,000 Downtown A 1,739,199 29,396 83,686 4.8% 10.4% 11.0% $22.38 0 178,000 Downtown A 1,739,199 29,396 83,686 4.8% 10.4% 11.0% $22.38 0 178,000 Northeast A 121,746 0 0 0.0% 0.0% 0.0% N/A 0 0 Southeast A 574,983 -11,060 -6,488 -1.1% 18.3% 18.3% $18.39 0 0 Southwest A 18,800 0 0 0.0% 0.0% 0.0% N/A 0 0 Suburbs A 715,529 -11,060 -6,488 -0.9% 14.7% 14.7% $18.39 0 0 West Michigan A 2,454,728 18,336 77,198 3.1% 11.6% 12.1% $21.17 0 178,000 Downtown B 3,533,169 -15,022 -27,931 -0.8% 9.6% 10.2% $19.22 0 0 Downtown B 3,533,169 -15,022 -27,931 -0.8% 9.6% 10.2% $19.22 0 0 Northeast B 643,150 11,156 47,956 7.5% 6.4% 6.4% $16.88 0 0 Northwest B 411,996 0 0 0.0% 0.0% 7.5% N/A 0 0 Southeast B 3,309,276 -2,076 158,526 4.8% 9.0% 9.4% $15.51 0 0 Southwest B 442,642 -5,936 -127 0.0% 14.3% 14.3% $14.03 0 0 Suburbs B 4,807,064 3,144 206,355 4.3% 8.4% 9.3% $15.35 0 0 West Michigan B 8,340,233 -11,878 178,424 2.1% 8.9% 9.7% $17.23 0 0