Download to read offline
![Today’s link shortener is bit.lyRead: [ jlKwGq ]as: http://bit.ly/jlKwGq](https://image.slidesharecdn.com/jiscadviz-110721102846-phpapp02/85/Jiscad-viz-2-320.jpg)

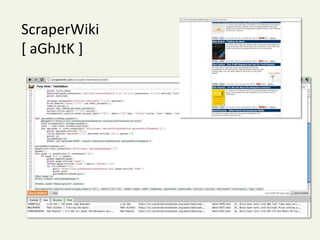
![ScraperWiki[ aGhJtK ]](https://image.slidesharecdn.com/jiscadviz-110721102846-phpapp02/85/Jiscad-viz-8-320.jpg)
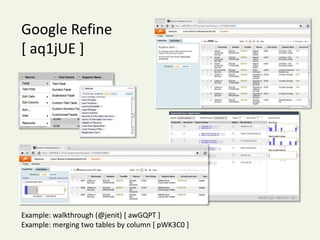
![Google Refine[ aq1jUE ]Example: walkthrough (@jenit) [ awGQPT ]Example: merging two tables by column [ pWK3C0 ]](https://image.slidesharecdn.com/jiscadviz-110721102846-phpapp02/85/Jiscad-viz-10-320.jpg)
![DataWrangler[ gmE3yz ]](https://image.slidesharecdn.com/jiscadviz-110721102846-phpapp02/85/Jiscad-viz-11-320.jpg)
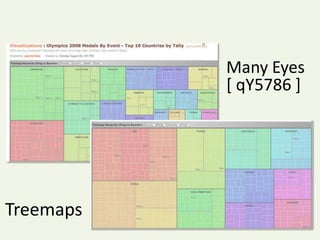
![Many Eyes[ qY5786 ]Treemaps](https://image.slidesharecdn.com/jiscadviz-110721102846-phpapp02/85/Jiscad-viz-14-320.jpg)
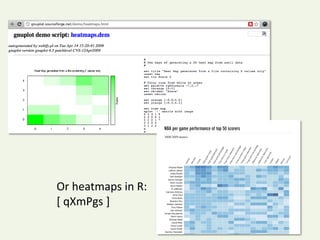
![Or heatmaps in R:[ qXmPgs ]](https://image.slidesharecdn.com/jiscadviz-110721102846-phpapp02/85/Jiscad-viz-20-320.jpg)
![Text processing with Unix tools[ m5tz63 ] [ lOVySX ]Count number of lines in a file: wc-l L2sample.csvView first few lines in a file: head L2sample.csv or head -n 4 L2sample.csv View last few lines in a file: tail L2sample.csv or tail -n 15 L2sample.csvSample contiguous rows from start or end of file:head -n 1 L2sample.csv > headers.csv tail -n 20 L2sample.csv > subSample.csv cat headers.csvsubSample.csv > subSampleWithHeaders.csvSample contiguous rows from middle of file:head -n 15 L2sample.csv | tail -n 6 > middleSample.csvSplit large file into smaller files:split -l 15 L2sample.csv subSamplesSearch for lines containing a term:grepmendeley L2sample.csvgrepEBSCO L2sample.csv > rowsContainingEBSCO.csv](https://image.slidesharecdn.com/jiscadviz-110721102846-phpapp02/85/Jiscad-viz-21-320.jpg)
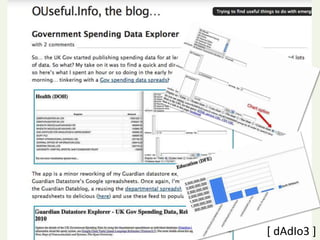
![[ dAdIo3 ]](https://image.slidesharecdn.com/jiscadviz-110721102846-phpapp02/85/Jiscad-viz-23-320.jpg)
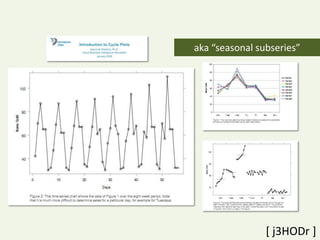
![aka “seasonal subseries”[ j3HODr ]](https://image.slidesharecdn.com/jiscadviz-110721102846-phpapp02/85/Jiscad-viz-26-320.jpg)
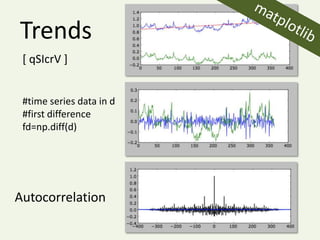
![matplotlibTrends[ qSIcrV ]#time series data in d#first differencefd=np.diff(d)Autocorrelation](https://image.slidesharecdn.com/jiscadviz-110721102846-phpapp02/85/Jiscad-viz-28-320.jpg)
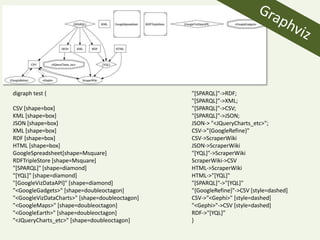
![Graphvizdigraph test {CSV [shape=box]KML [shape=box]JSON [shape=box]XML [shape=box]RDF [shape=box]HTML [shape=box]GoogleSpreadsheet[shape=Msquare]RDFTripleStore [shape=Msquare]"[SPARQL]" [shape=diamond]"[YQL]" [shape=diamond]"[GoogleVizDataAPI]" [shape=diamond]"<GoogleGadgets>" [shape=doubleoctagon]"<GoogleVizDataCharts>" [shape=doubleoctagon]"<GoogleMaps>" [shape=doubleoctagon]"<GoogleEarth>" [shape=doubleoctagon]"<JQueryCharts_etc>" [shape=doubleoctagon]"[SPARQL]"->RDF;"[SPARQL]"->XML;"[SPARQL]"->CSV;"[SPARQL]"->JSON;JSON-> "<JQueryCharts_etc>";CSV->"{GoogleRefine}"CSV->ScraperWikiJSON->ScraperWiki"[YQL]"->ScraperWikiScraperWiki->CSVHTML->ScraperWikiHTML->"[YQL]""[SPARQL]"->"[YQL]""{GoogleRefine}"->CSV [style=dashed]CSV->"<Gephi>" [style=dashed]"<Gephi>"->CSV [style=dashed]RDF->"[YQL]”}](https://image.slidesharecdn.com/jiscadviz-110721102846-phpapp02/85/Jiscad-viz-30-320.jpg)
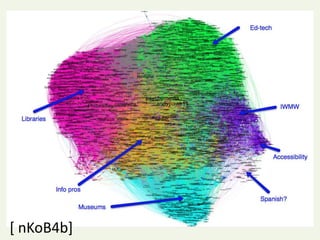
![[ nKoB4b]](https://image.slidesharecdn.com/jiscadviz-110721102846-phpapp02/85/Jiscad-viz-32-320.jpg)
![[ nKoB4b]](https://image.slidesharecdn.com/jiscadviz-110721102846-phpapp02/85/Jiscad-viz-33-320.jpg)
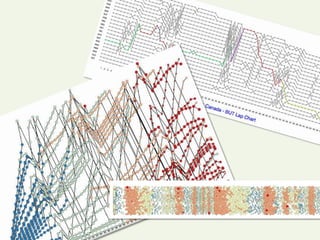
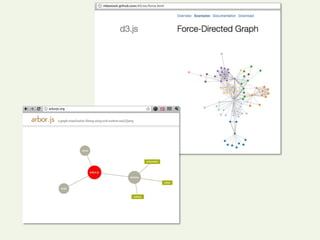
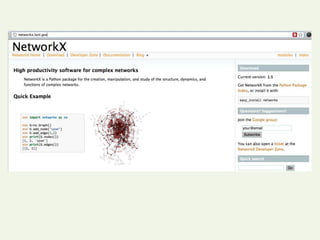
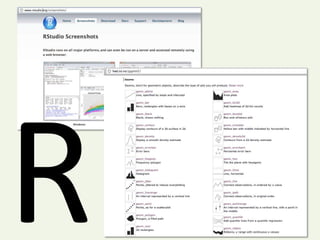
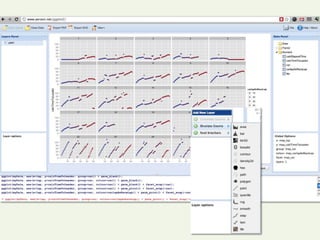

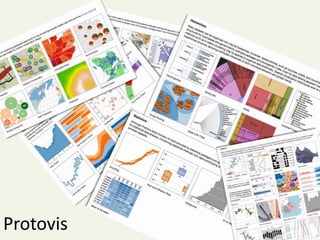
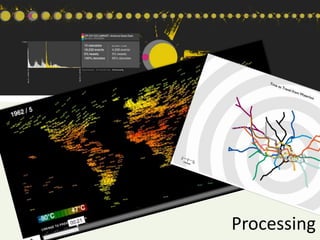


This document summarizes various tools for visualizing and analyzing activity data. It discusses tools for data wrangling like Google Refine and DataWrangler. It also covers visualization libraries and platforms like Many Eyes, Matplotlib for time series data, and Graphviz for graphs and networks. Statistical analysis in R and graphics libraries like Protovis and Processing are also mentioned. The document provides links to examples of analyzing hierarchical data, text processing with Unix tools, and visualizing trends and autocorrelation in time series data.