Download as PDF, PPTX
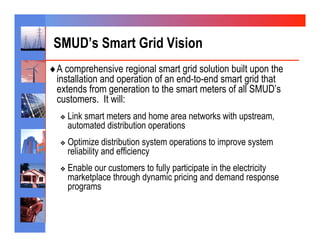
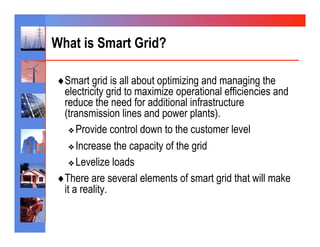
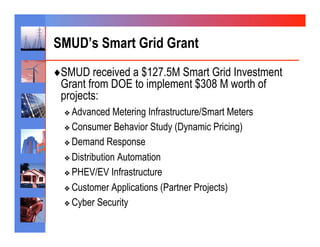
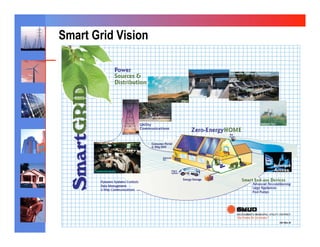
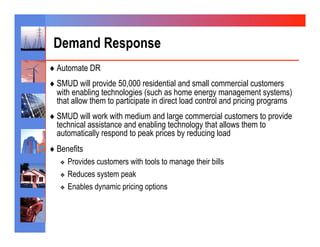


SMUD received a $127.5 million Smart Grid grant to implement a comprehensive regional smart grid solution including advanced metering infrastructure, dynamic pricing programs, distribution automation, and electric vehicle charging infrastructure. The smart grid aims to optimize grid operations, improve reliability and efficiency, and enable customer participation in demand response and energy markets. Key projects include installing smart meters, conducting customer behavior studies on dynamic pricing, deploying distribution automation technologies, and establishing electric vehicle charging stations.


