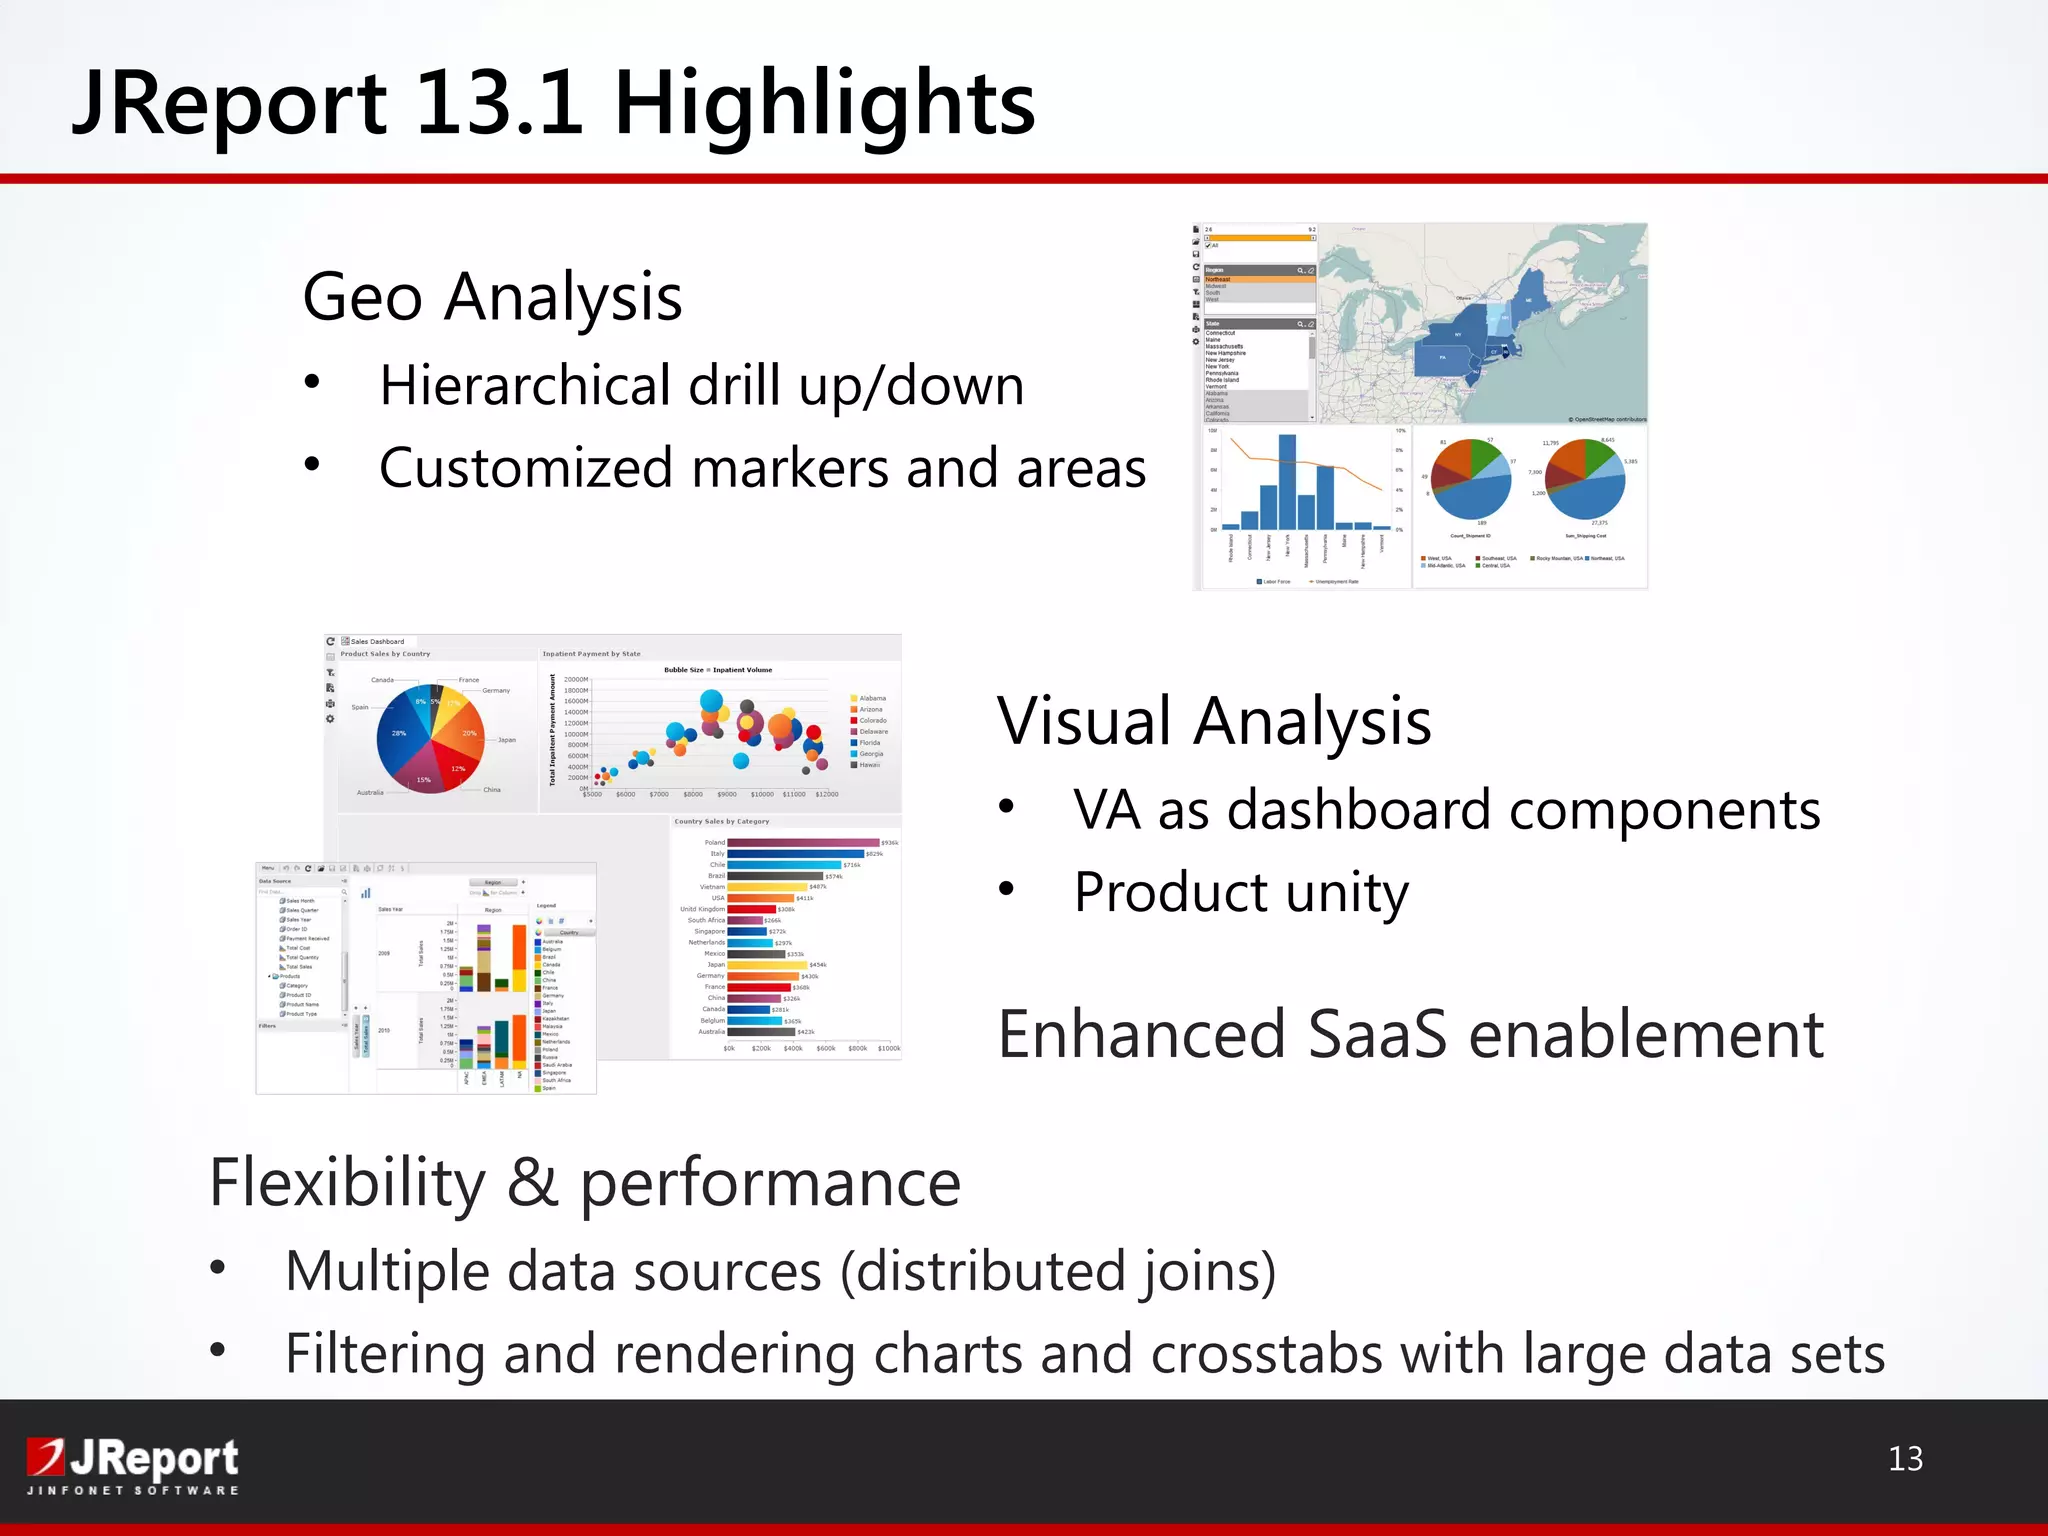
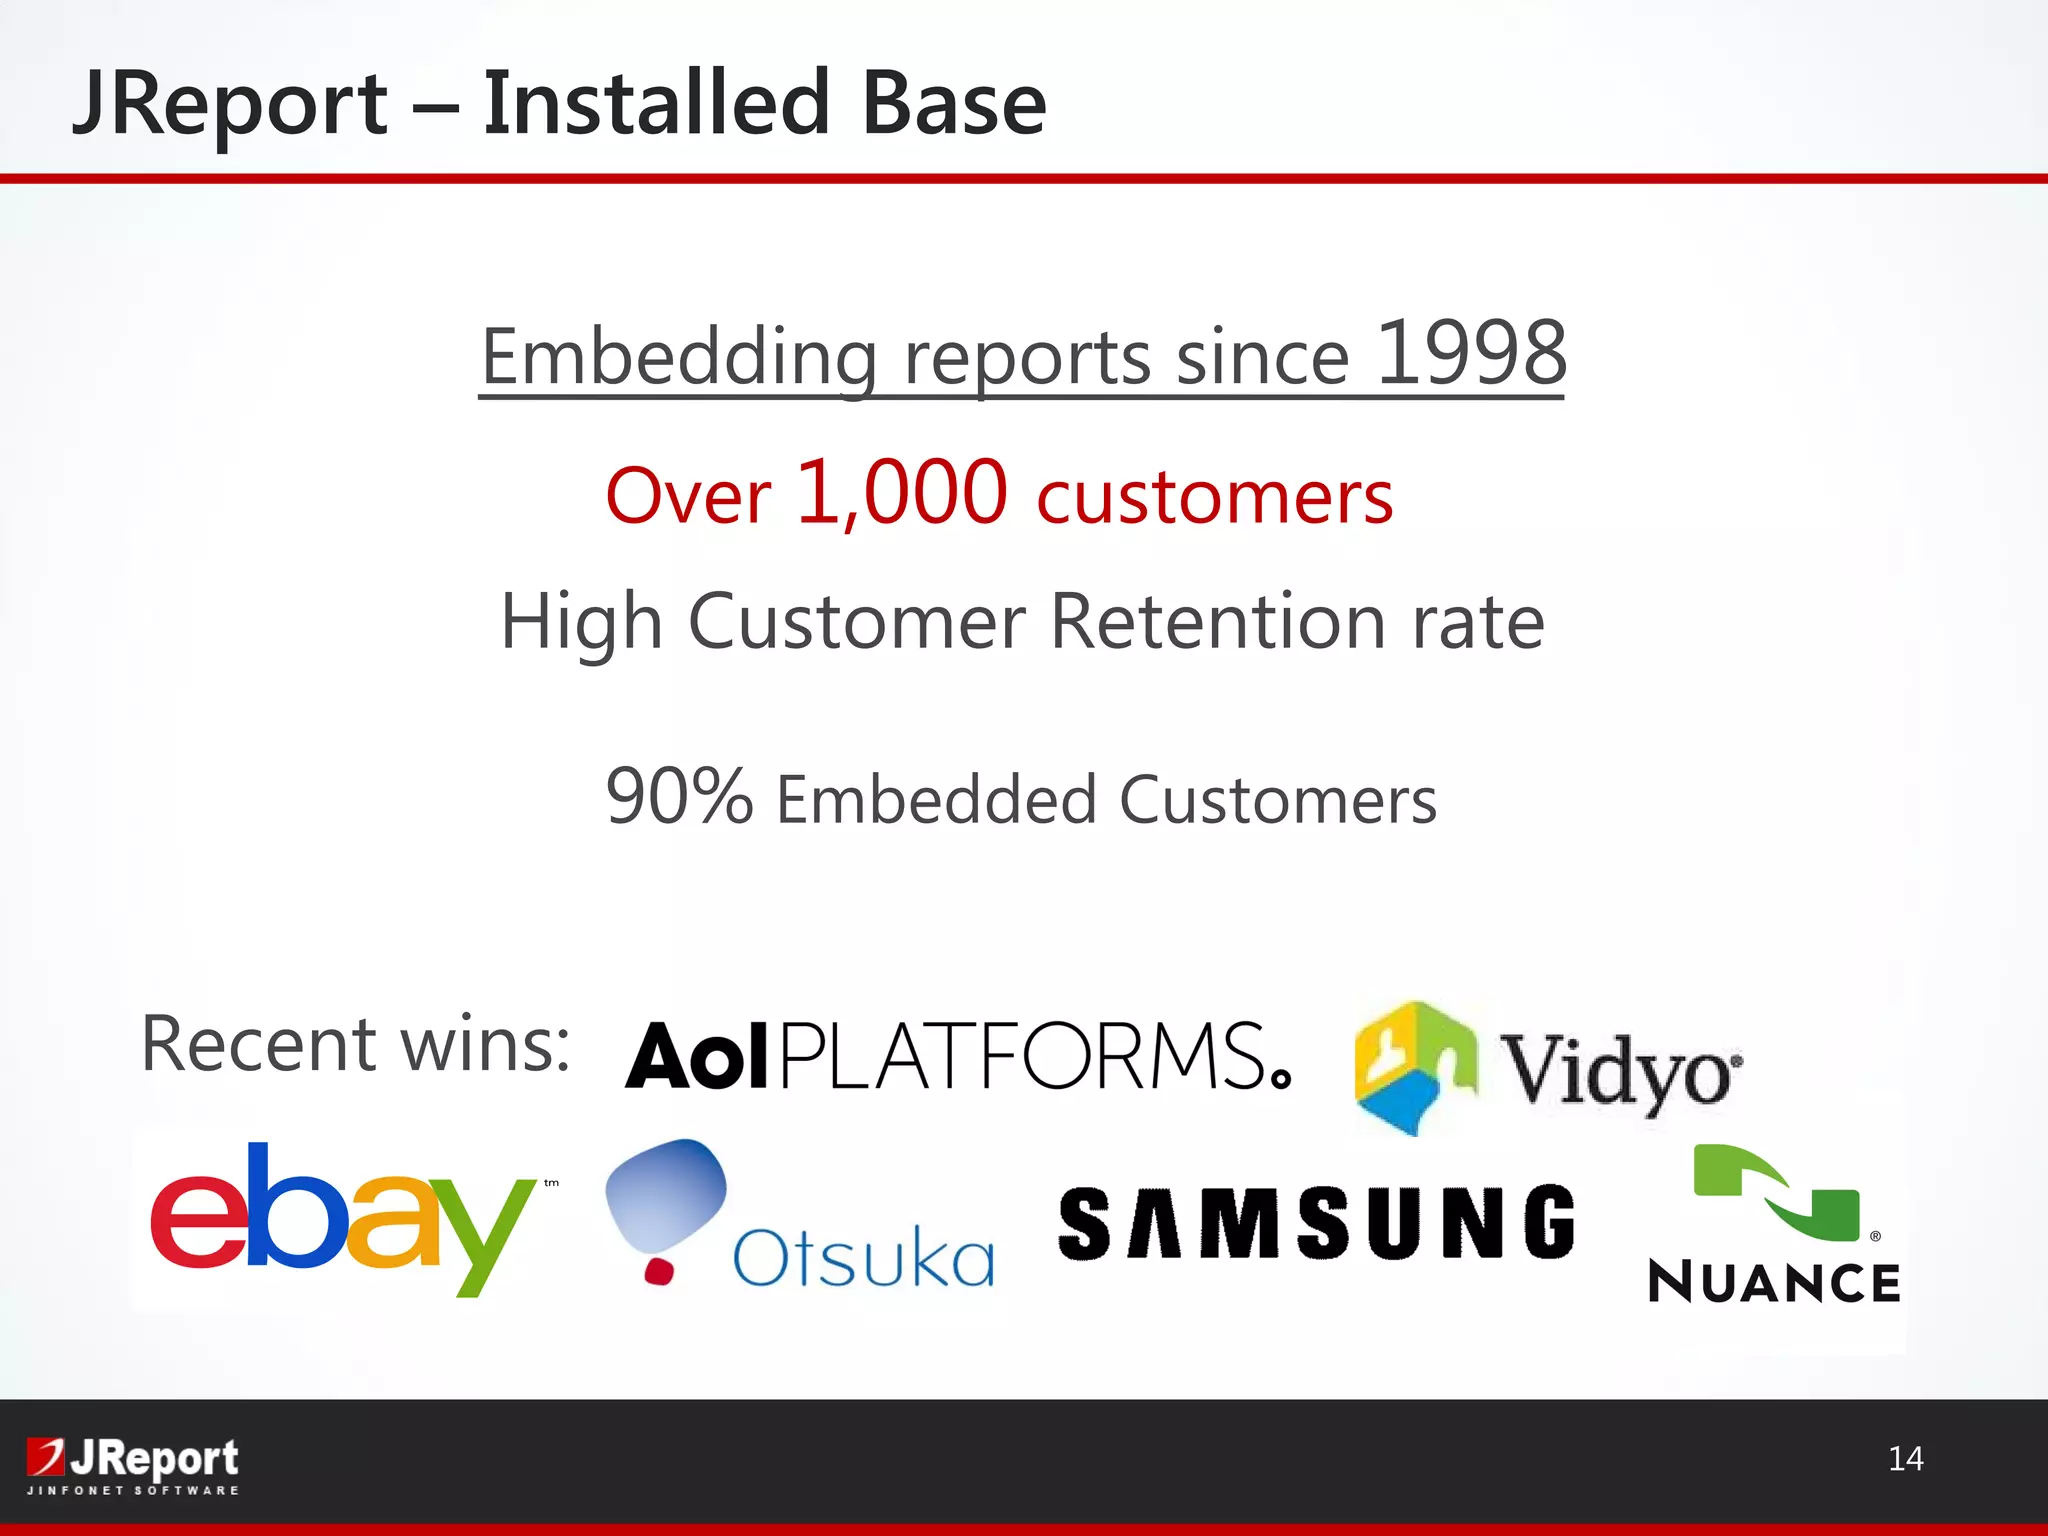
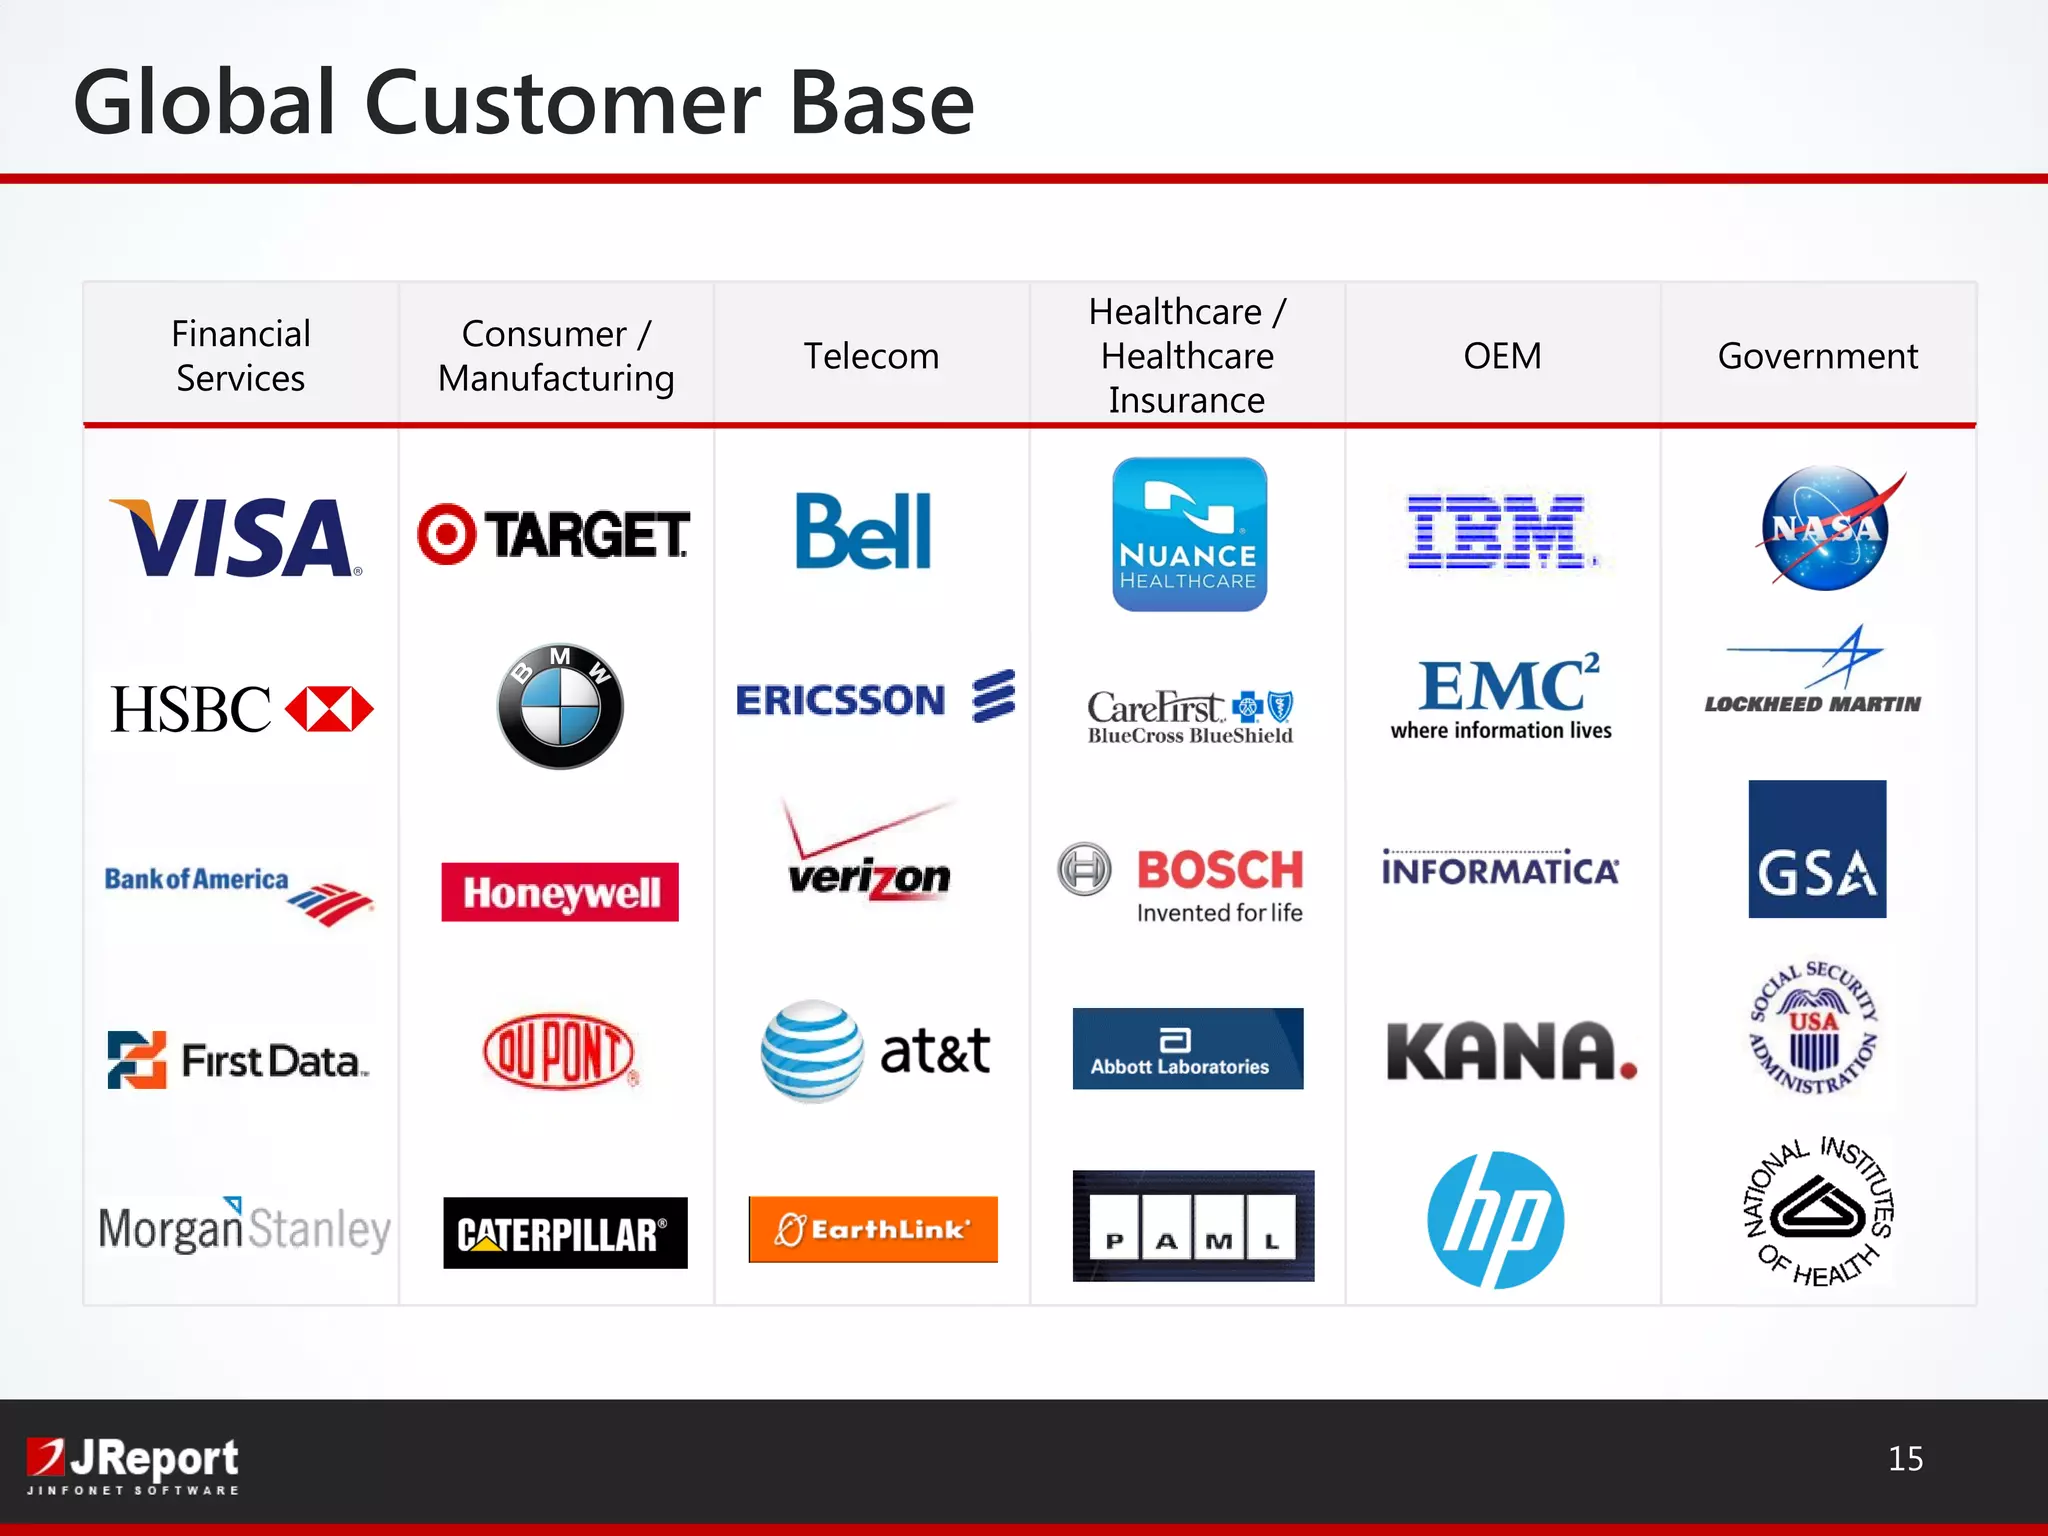
Build Java Reporting and Dashboards
into Your Applications
Dean Yao
Director of Marketing
Mike Poplawski
Systems Engineer
Follow us @Jinfonet
www.jinfonet.com
High Performance and Scalable
Intelligent push-down and in-memory cubes
Server clustering
Self-Service
Low learning curve tools to empower users
Ad Hoc Reporting, Dashboards & Ad Hoc Analysis
Flexible
Mashup any data source: RDB, Big Data, Cloud
Embeddable and Customizable
Embedded Data Visualization Platform
JReport Highlights
2
ACME
Financials
Company Sales
BI Platform
• Security, administrative features
• Customizable look and feel
Metadata Management
• Catalogs to organize/publish/search
dimensions, hierarchies, measures,
formula, components, reports
Development Tools
• JReport Designer: build components,
reports, dashboards
• API for application embedding
Embedded Solution
3
Popular
Portable
Easy to develop
Why Java?
4
Integration Options
5
Functional Integration
Standalone
App Server
Integration
Application
Embedding
DeploymentIntegration
Business layer
Application
Web layer
JReport
Server
URL API
JReport
Server
Java API
UI Integration
6
Calling a report by URL:
http://localhost:8888/jinfonet/tryView.jsp?jrs.cmd=jrs.try_vw&
jrs.catalog=SampleReports/SampleReports.cat&
jrs.report=SampleReports/MultimediaObjects.cls&jrs.result_type=8
Power and Business Users
• Flexible data sources
• Sort, filter, drill into details, expand/collapse groups, link to reports
• Themes, profiles, print layouts
• Security and Governance
Ad Hoc Reporting
7
Ad Hoc Analysis
Business Users
• Visual Analysis
• Interactive UI with drag-and-drop functionality
• Quickly change data views
• Powered by in-memory cubes
8
Data Source Connectors
In-Memory Cube and Cache
9
RDBMS Big
Data
Flat
Files
Web
Services
User
Defined
Details
Cache
Big Data
Large, fast, unstructured, complex data
NoSQL
Apache Hadoop
Big Data Visualization
10
JDashboard
11
12
Information Delivery
Web Mobile
JReport 13.1 Highlights
Visual Analysis
• VA as dashboard components
• Product unity
Enhanced SaaS enablement
13
Geo Analysis
• Hierarchical drill up/down
• Customized markers and areas
Flexibility & performance
• Multiple data sources (distributed joins)
• Filtering and rendering charts and crosstabs with large data sets
Over 1,000 customers
Embedding reports since 1998
High Customer Retention rate
90% Embedded Customers
JReport – Installed Base
14
Recent wins:
GovernmentOEM
Healthcare /
Healthcare
Insurance
Telecom
Consumer /
Manufacturing
Financial
Services
Global Customer Base
15
16
• Look for our follow-up email
 Whitepaper: On the Radar - Embedded Reporting and Analytics
 Exclusive JReport 13.1 Trial
 Free Proof of Concept
• Webinar with analysts from EMA – Nov 3
• For more info, visit: www.jinfonet.com
E-mail: dyao@jinfonet.com, mpoplawski@jinfonet.com
Phone: (240) 477-1000
Follow us @Jinfonet
Next Steps

Java Reporting and Dashboard Integration Into Your Applications

  • 1.
    Build Java Reportingand Dashboards into Your Applications Dean Yao Director of Marketing Mike Poplawski Systems Engineer Follow us @Jinfonet www.jinfonet.com
  • 2.
    High Performance andScalable Intelligent push-down and in-memory cubes Server clustering Self-Service Low learning curve tools to empower users Ad Hoc Reporting, Dashboards & Ad Hoc Analysis Flexible Mashup any data source: RDB, Big Data, Cloud Embeddable and Customizable Embedded Data Visualization Platform JReport Highlights 2
  • 3.
    ACME Financials Company Sales BI Platform •Security, administrative features • Customizable look and feel Metadata Management • Catalogs to organize/publish/search dimensions, hierarchies, measures, formula, components, reports Development Tools • JReport Designer: build components, reports, dashboards • API for application embedding Embedded Solution 3
  • 4.
  • 5.
    Integration Options 5 Functional Integration Standalone AppServer Integration Application Embedding DeploymentIntegration Business layer Application Web layer JReport Server URL API JReport Server Java API
  • 6.
    UI Integration 6 Calling areport by URL: http://localhost:8888/jinfonet/tryView.jsp?jrs.cmd=jrs.try_vw& jrs.catalog=SampleReports/SampleReports.cat& jrs.report=SampleReports/MultimediaObjects.cls&jrs.result_type=8
  • 7.
    Power and BusinessUsers • Flexible data sources • Sort, filter, drill into details, expand/collapse groups, link to reports • Themes, profiles, print layouts • Security and Governance Ad Hoc Reporting 7
  • 8.
    Ad Hoc Analysis BusinessUsers • Visual Analysis • Interactive UI with drag-and-drop functionality • Quickly change data views • Powered by in-memory cubes 8
  • 9.
    Data Source Connectors In-MemoryCube and Cache 9 RDBMS Big Data Flat Files Web Services User Defined Details Cache
  • 10.
    Big Data Large, fast,unstructured, complex data NoSQL Apache Hadoop Big Data Visualization 10
  • 11.
  • 12.
  • 13.
    JReport 13.1 Highlights VisualAnalysis • VA as dashboard components • Product unity Enhanced SaaS enablement 13 Geo Analysis • Hierarchical drill up/down • Customized markers and areas Flexibility & performance • Multiple data sources (distributed joins) • Filtering and rendering charts and crosstabs with large data sets
  • 14.
    Over 1,000 customers Embeddingreports since 1998 High Customer Retention rate 90% Embedded Customers JReport – Installed Base 14 Recent wins:
  • 15.
  • 16.
    16 • Look forour follow-up email  Whitepaper: On the Radar - Embedded Reporting and Analytics  Exclusive JReport 13.1 Trial  Free Proof of Concept • Webinar with analysts from EMA – Nov 3 • For more info, visit: www.jinfonet.com E-mail: dyao@jinfonet.com, mpoplawski@jinfonet.com Phone: (240) 477-1000 Follow us @Jinfonet Next Steps

Editor's Notes

  • #3 In-memory data structure to store aggregation information Intelligent push-down allows you to offset your query processing to the database - Clustering: Makes Jreport more scalable, and removes single points of failure Before we get into some of the detail on visualization, I’m just going to talk about why it’s is important and why we put so much emphasis on the visual components of JReport. all about getting the data into the hands of the end users very quickly & easily, and allows end users to manipulate the data and allow them interact with, interpret, and ask questions of their data. Contrast static visualization vs dynamic interactive visualization Normally visualization is static like a chart
  • #4 New capabilities of JReport 12 built on the foundation of our technology which is embedded reporting. Maintain exact look and feel of the application Totally Seamless Transparent interface for end users Quick Access Connects to any data source API for application embedding: Runs in any application server: Tomcat, JBoss, Websphere… Single jar file installation Advantages to using JReport to embed BI into your application: So one of the main reasons is that you’re able to leverage your existing infrastructure. It’s not like you have to buy a new dedicated server with a huge number of CPU’s and huge amount of memory so you can run JReport. The footprint is very lightweight and it can run natively within your existing hardware.
  • #5 New capabilities of JReport 12 built on the foundation of our technology which is embedded reporting. Maintain exact look and feel of the application Totally Seamless Transparent interface for end users Quick Access Connects to any data source API for application embedding: Runs in any application server: Tomcat, JBoss, Websphere… Single jar file installation Advantages to using JReport to embed BI into your application: So one of the main reasons is that you’re able to leverage your existing infrastructure. It’s not like you have to buy a new dedicated server with a huge number of CPU’s and huge amount of memory so you can run JReport. The footprint is very lightweight and it can run natively within your existing hardware.
  • #8 Visual Analysis: Touch your data Fast because of in-memory cubes
  • #11 Need to make sense out of Big Data
  • #12 JDashboard Drag and drop dashboard design Reuse reports, components, analytics Sort, filter, drill, pivot, slice-n-dice, parameters, export Easy to integrate with 3rd party widgets such as Google maps Synchronized refresh HTML5 Flexible Software Development Kit JReport includes an API for every action that can be created in the product Designer API allows the application to dynamically modify templates Catalog API allows the application to dynamically modify data connections Server API allows the application to call all reporting functions directly from the application Server RMI API allows the application to call all reporting functions from a remote host Tutorials, code samples and JavaDocs make using the API easy to learn
  • #14 In-memory cube enhancements: Security and management Improved Usability Improved Quality And csutomized markers and area on openstreetmap and google and you can set conditional properties such color, size, shapes, label for example if an unemployement rate of state increases 10% you can maybe make a red mark on there Smart layout of how data is presented lets u autofit data into chart based on height or width or both New visual tools such as heatmaps and scrollable real time charts Performance boost Filtering and rendering charts with large data sets And also Crosstab performance is improved for large data sets
  • #16 Visa Reports run on more than 1200 commercial card holder accounts (CCHA) Each CCHA has +/- one million card holders, each getting numerous personalized reports/year Visa Small Business has more than 15,000 companies running JReport Fail-safe, clustered technology serves massive mission-critical IRS reports Target JReport enables access to product lifecycle reports via a highly customized web interface for buyers at target headquarters Utilized by thousands of Target employees and vendors JReport provides ability to access databases at multiple levels and locations In spite of owning Cognos, IBM still embeds JReport in the following four products: IBM Infosphere IBM: Lotus Learning Management IBM: Tivoli IBM Netcool Configuration Manager The reason they use JReport is the ease of integration, customization and the ease of use for their customers to quickly and easily get what they need.
  • #17 Availability Join our JReport 12 Beta program, contact us Use integration as opportunity to mentioned we are delivering enterprise solution, has to work with enterprise systems. Need to make sure everything all works together. Maintain exact look and feel of the application Totally Seamless Transparent interface for end users Quick Access Connects to any data source API for application embedding: Runs in any application server: Tomcat, JBoss, Websphere… Single jar file installation Advantages to using JReport to embed BI into your application: So one of the main reasons is that you’re able to leverage your existing infrastructure. It’s not like you have to buy a new dedicated server with a huge number of CPU’s and huge amount of memory so you can run JReport. The footprint is very lightweight and it can run natively within your existing hardware.