SlideShare a Scribd company logo
1 of 52
Download to read offline
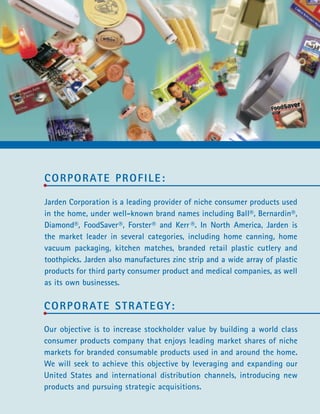
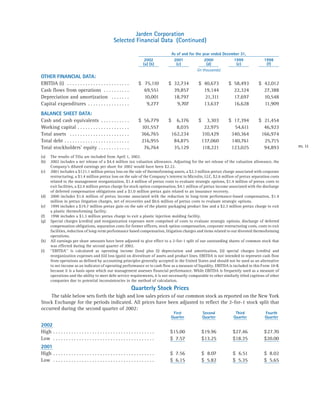
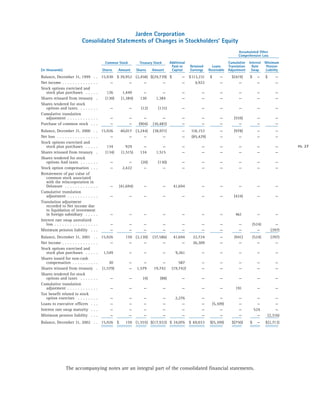
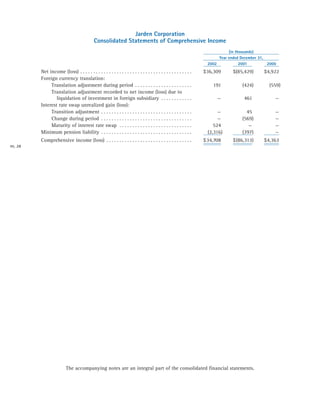
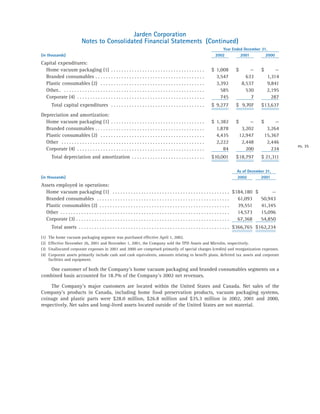
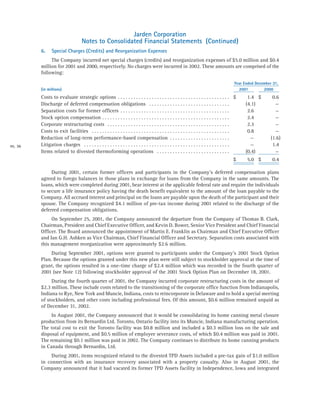
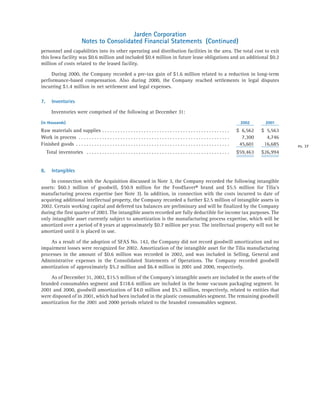
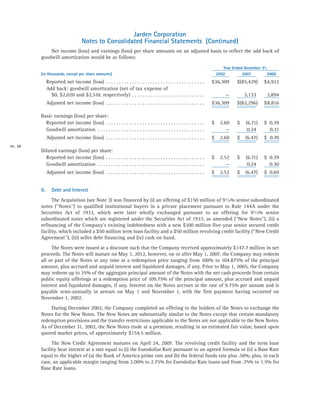
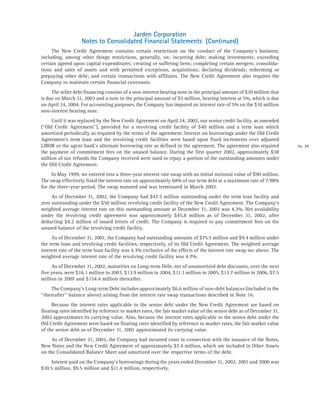
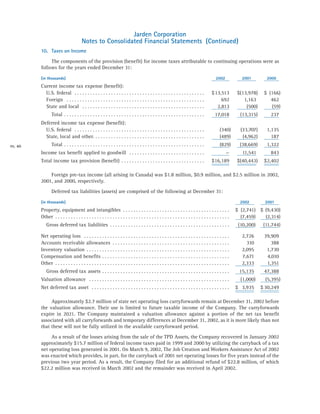
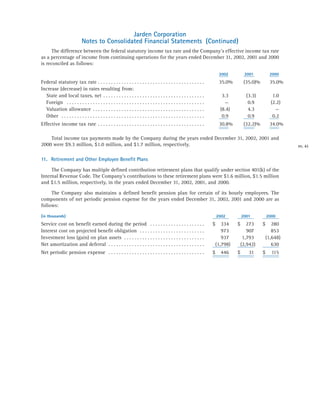
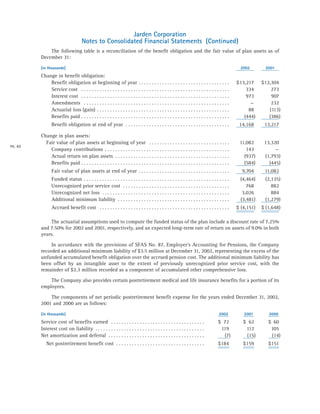
2 0 02 A N N U A L R E P O R T
TA B L E O F C O N T E N T S :

 1   corporate profile and strategy
 2   chairman’s letter
 4   branded consumables
 6   home vacuum packaging
 8   plastic consumables                    Winners of Jarden's 2002 Annual Report Cover Design contest:
 9   other                                  Milton Murphy, Plant Manager, Plastic Consumables and
                                            Connie Phuah, Administrative Assistant, Home Vacuum Packaging
10   selected financial data
12   management’s discussion and analysis
                                            Ball® and            are trademarks of Ball Corporation, under
23   financial statements                   limited license to Jarden Corporation.
C O R P O R AT E P R O F I L E :

Jarden Corporation is a leading provider of niche consumer products used
in the home, under well-known brand names including Ball®, Bernardin®,
Diamond®, FoodSaver®, Forster® and Kerr ®. In North America, Jarden is
the market leader in several categories, including home canning, home
vacuum packaging, kitchen matches, branded retail plastic cutlery and
toothpicks. Jarden also manufactures zinc strip and a wide array of plastic
products for third party consumer product and medical companies, as well
as its own businesses.

C O R P O R AT E S T R AT E G Y:

Our objective is to increase stockholder value by building a world class
consumer products company that enjoys leading market shares of niche
markets for branded consumable products used in and around the home.
We will seek to achieve this objective by leveraging and expanding our
United States and international distribution channels, introducing new
products and pursuing strategic acquisitions.
CHAIRMAN’S LETTER


                                                   “In a business where we live by the mantra, ‘Our most
                                                   important assets go home every night,’ we are particularly
                                                   pleased that our management teams believe in, and are
                                                   excited about, our long-term stategy to build a world
                                                   class consumer products company.”


PG. 2


        DEAR FELLOW SHAREHOLDERS:
        I am delighted to report that 2002, by any measure, was the most success-
        ful year in the company’s history. Despite a difficult economic climate, every
        segment of your company met or exceeded its profitability objectives.

        Perhaps more important than short-term financial success, we     acquired Tilia during the first half of 2002, the leading
        defined a long-term strategic direction for Jarden Corporation   manufacturer and marketer of home vacuum packaging
        and prepared the foundation for a successful execution of        systems under the FoodSaver® brand in North America.
        this strategy. Our strategy is clear and consistent; to build    This acquisition was a natural extension of Jarden’s market
        a world class consumer products company that enjoys leading      leading position in another area of home food preservation,
        market shares of niche markets for branded consumable            home canning. The synergies between these two businesses
        products used in and around the home. We believe this            have already led to cost efficiencies and increased strength in
        strategy has not only created a strong, vibrant platform from    marketing, distribution and product development. In addition,
        which to grow, but also presents a compelling investment         we believe our ability to complete a smooth and swift
        opportunity. The nature of niche markets means they are rela-    integration plan for the FoodSaver® acquisition bodes well
        tively small with attractive operating margins and strong cash   for future acquisition integrations.
        flows. These markets have often been neglected, providing the
                                                                         Established Platform for Growth
        opportunity for positive market trends from newly invigorat-
                                                                         The company’s transformation was highlighted by its name
        ed management with fresh and creative ideas. We believe that
                                                                         change to Jarden Corporation from Alltrista at the end of
        many of our niche branded consumable markets share similar
                                                                         May 2002. While the name change was largely symbolic, the
        distribution channels which can be leveraged to include new
                                                                         changes made since September 2001 have had a significant
        product introductions as well as more efficient customer
                                                                         positive impact on the morale of our employees. In a business
        service. A number of important milestones in implementing
                                                                         where we live by the mantra, “Our most important assets go
        our strategy were achieved in 2002.
                                                                         home every night,” we are particularly pleased that our
        Expanded into Home Vacuum Packaging                              management teams believe in, and are excited about, our
        Following the significant reorganization and deleveraging of     long-term strategy to build a world class consumer products
        the company that took place in the fourth quarter of 2001, we    company. I believe this rejuvenated spirit has pushed your
Martin E. Franklin
                                                                  Chairman and
2002 SALES BY SEGMENT:                                   Chief Executive Officer


                                       39% Home Vacuum Packaging
                                       31% Branded Consumables
                                       19% Plastic Consumables
                                       11% Other


                                                                                                                                    PG. 3


company’s people to excel, despite macro economic                We have strengthened our management ranks in 2002, not
challenges. To ensure the financial flexibility required for     only in sales and marketing, but also in technology through
future growth, your company entered into a newly syndicated      the newly filled post of Chief Information Officer. In addition,
$100 million senior credit facility and $150 million ten-year    we have welcomed the addition of two experienced independent
senior subordinated notes that provides a non-amortizing         directors to our Board, Irwin Simon, Chairman of Hain-
base of capital at favorable rates. These positive changes in    Celestial Group, and René-Pierre Azria, Managing Director
your company have resulted in a renewed interest in the          of Rothschild Inc. Their insights have already proved
equity of Jarden and should allow us to continue to increase     valuable to the company.
the long-term value we can deliver to our shareholders.
                                                                 Finally, all of the above has led to the start of recognition
Acquired Diamond Brands                                          on Wall Street. Two research houses initiated coverage of
In November 2002, Jarden announced it had entered into a         Jarden in 2002 and a third began coverage in January 2003.
definitive asset purchase agreement to acquire the business of   The company’s new strategic direction, as well as our strong
Diamond Brands, which was completed during February 2003.        financial results, helped Jarden’s shares rise by over 200% in
Diamond Brands is a leading manufacturer and marketer of         2002, a performance that led to Jarden being listed as the
niche consumer products for domestic use including kitchen       number one performing stock in 2002 according to Investors
matches, toothpicks, plastic cutlery, straws, clothespins and    Business Daily.
wooden crafts, sold primarily under the Diamond® and
                                                                 We are proud of your company’s performance in 2002. Much
Forster® trademarks. Diamond Brands met our established
                                                                 of the credit is due to the 1,500 members of the Jarden team
major acquisition criteria: leading market shares of niche
                                                                 and their outstanding efforts during 2002. We entered 2003
markets in branded consumables used in and around the
                                                                 with considerable momentum and I look forward to reporting
home, established EBITDA margins in excess of 15% and a
                                                                 our progress to you as the year unfolds.
purchase price allowing immediate accretion to earnings from
the date of acquisition, before synergies. With the inclusion    Yours sincerely,
of Diamond Brands, we have surpassed our internal goal of
generating over 90% of our total revenues from consumer
products related businesses by the end of 2003.

Invested in Organic Growth                                       Martin E. Franklin
To continue organic growth in our business we have allocated
                                                                 Chairman and
significant incremental marketing funds in 2003 for launching
                                                                 Chief Executive Officer
and promoting new product introductions. This effort has
been led by our new Chief Marketing Officer, whose role is
to define a strategy to drive organic growth across our
consumer products businesses.
Our Diamond® and Forster® branded
                                                retail plastic cutlery is available in a variety
        The Jammin’ Kit is designed as a fun,
                                                of different counts and sizes to suit the
        home-based, canning experience for                                                         Pickling is a popular home canning
                                                differing needs of our customers.
        the whole family.                                                                          activity and this new kit makes it easy.


PG. 4
Our new “ultimate package”
                                                                             We offer a variety of different      design will provide distribution
Diamond® is the leading brand        Our new Salsa Kit is 1 of 9             packaging and types of toothpicks    and manufacturing efficiencies
in kitchen matches and is a staple   Fresh ‘N Fun kits we now offer.         including the inventive Shake A      while improving the
product in many homes.                                                       Pick® product shown below.           presentation to the consumer.


                                                                                                                                                PG. 5


          BRANDED CONSUMABLES

          We manufacture, market and distribute a broad
          line of branded products that includes home canning
          jars, jar closures, plastic cutlery, kitchen matches,
          toothpicks, food preparation kits, craft items and                                               Jack Metz (President, 2nd from
                                                                                                           right) with (from left to right)
                                                                                                           Roman Shumny (VP-Marketing),
          other accessories marketed under a portfolio of brands,                                          Jim King (VP-Sales), Dave Tolbert
                                                                                                           (VP-HR & Admin) and Blair
          including the well-known Ball®, Bernardin®, Diamond®,                                            Swogger (Chief Operating Officer).


          Forster®, Fruit Fresh® and Kerr® brand names.
          Several of our leading branded consumable products           and craft stores. Our customers include Ace Hardware,
          such as Diamond® kitchen matches and Ball® jars have         Albertson’s, Dollar General, Kroger, and Wal-Mart,
          been in continuous use for over 100 years. We have           among others.
          long-standing relationships with a diverse group of
                                                                       Some of our marketing initiatives include in-store
          retail, wholesale and institutional customers in North
                                                                       coupons, strategically located display cases and the
          America. We sell through a wide variety of distribution
                                                                       new “ultimate package” for home canning jars.
          channels, including grocery stores, mass merchants,
          department stores, value retailers, hardware stores
Our bags and bag rolls sold for use
        with the home vacuum packaging
        machines represent a recurring revenue
        source and a competitive advantage.


                                                 We have created the home vacuum packaging
                                                 category at most of our retailers and actively
                                                 work with them to promote the FoodSaver®
                                                 and home vacuum packaging to consumers.


PG. 6
PG. 7


H O M E V A C U U M PA C K A G I N G

We are the leading provider of home vacuum
packaging machines and accessories under the
FoodSaver® brand. Our accessories include
bags and bag rolls, canisters, jar sealers and
wine stoppers.                                                                       Linda Graebner (President) with Michael
                                                                                     Whitcomb (Chief Marketing Officer) and
                                                                                     David Brakes (Chief Operating Officer).


We sell through a diverse group of leading wholesale       Advertising and brand-building programs will
and retail customers in North America and distributors     extend beyond infomercials. We believe that new
in selected international markets. We have successfully    product innovation will increasingly capitalize on
penetrated several traditional retail channels including   consumer segmentation opportunities in vacuum
mass merchants, warehouse clubs and specialty retailers    packaging and in other food preservation categories.
and also sell through direct-to-consumer channels,         Our retail position is being reinforced by channel
primarily infomercials. Our customers include Bed Bath     marketing initiatives that optimize category volume
and Beyond, Costco, Kohl's, Target and Wal-Mart,           and profitability for retailers. Direct marketing
among others.                                              activities are being expanded to reinforce brand loyalty
                                                           and sustained usage rates for bags and accessories.
Our marketing department is implementing a strategy
to drive sustained growth over the next few years.
Refrigerator door liners and
              Consumer products packaging.            Yorker® closures.                               other plastic parts.


PG. 8


        PLASTIC CONSUMABLES

        We manufacture, market and distribute
        a wide variety of plastic products for
        industrial and manufacturing customers
        including closures, contact lens packaging,
        refrigerator door liners, sport shooting
        ammunition components, surgical devices
        and syringes.


        Many of these products are consumable in nature              We also supply plastic products and parts to both our
        or represent components of consumer products.                branded consumables (plastic cutlery and closures) and
                                                                     home vacuum packaging (plastic containers) segments.
        We sell primarily to major companies in the
        healthcare and consumer products industries. Our             We focus our sales and marketing efforts in those
        customers include CIBA Vision, Johnson & Johnson,            markets that require high levels of precision, quality,
        Scotts, Whirlpool and Winchester, among others.              and engineering expertise.
Penny blanks are primarily made        Zinc strip is produced
                                                                                             An array of zinc strip products.
                   of zinc and coated in copper.          in our plant.


                                                                                                                                PG. 9


OT H E R

We are the largest producer of zinc strip
and fabricated products in the United
States. We are the sole source supplier of
copper plated zinc penny blanks to both
the United States Mint and the Royal
Canadian Mint.


In addition, we manufacture a line of industrial              Our sales and marketing team consists of individuals
zinc items used in the plumbing, automotive, electrical       with considerable technical background in the field of
component and European architectural markets. Our             metallurgy, who focus on leveraging our core capabilities
anti-corrosion zinc Lifejacket® is gaining recognition        in zinc metallurgy and electrochemistry to capitalize on
as a cost-effective solution to arrest the corrosion of       new market opportunities. The sales and marketing staff
the reinforcement steel within poured concrete                work closely with our engineering and technical services
structures (see image to the right).                          group to deliver products to the customer.
Jarden Corporation
                                                                           Selected Financial Data
                The following table sets forth our selected financial data as of and for the years ended December 31, 2002,
           2001, 2000, 1999 and 1998. The selected financial data set forth below has been derived from our audited
           consolidated financial statements and related notes for the respective fiscal years. The selected financial data
           should be read in conjunction with ‘‘Management’s Discussion and Analysis of Financial Condition and Results
           of Operations’’ as well as our consolidated financial statements and notes thereto. These historical results are
           not necessarily indicative of the results to be expected in the future.
                                                                                                         For the year ended December 31,
                                                                                   2002              2001               2000              1999             1998
                                                                                  (a) (b)             (c)                (d)                (e)             (f)
                                                                                                        (in thousands, except per share data)

           STATEMENT OF OPERATIONS DATA:
           Net sales . . . . . . . . . . . . . . . . . . . . . . . . . .      $368,199          $ 304,978           $357,356          $358,031        $258,489
           Costs and expenses:
             Cost of sales . . . . . . . . . . . . . . . . . . . . .              216,629           232,634             274,248           256,201         187,295
             Selling, general and administrative
                expenses . . . . . . . . . . . . . . . . . . . . . .               86,461            53,254              57,342           56,429           38,331
      10
PG.
             Goodwill amortization . . . . . . . . . . . .                              —             5,153               6,404            4,605            1,399
             Special charges (credits) and
                reorganization expenses (g) . . . . . .                                     —         4,978                380              2,314           1,260
             Loss (gain) on divestiture of assets
                and product lines. . . . . . . . . . . . . . .                         —             122,887                  —           (19,678)              —
           Operating income (loss) . . . . . . . . . . . . .                      65,109            (113,928)            18,982            58,160          30,204
           Interest expense, net . . . . . . . . . . . . . . . .                  12,611              11,791             11,917             8,395           1,822
           Income tax provision (benefit) . . . . . . . .                         16,189             (40,443)             2,402            19,458          10,785
           Minority interest in gain (loss) of
             consolidated subsidiary . . . . . . . . . . .                                  —            153               (259)                  —               —
           Income (loss) from continuing
             operations . . . . . . . . . . . . . . . . . . . . . .               36,309            (85,429)              4,922            30,307          17,597
           Loss from discontinued operations . . . .                                   —                  —                   —               (87)          (1,870)
           Extraordinary loss from early
             extinguishment of debt (net of
             income taxes) . . . . . . . . . . . . . . . . . . .                     —                  —                     —         (1,028)              —
           Net income (loss) . . . . . . . . . . . . . . . . . . .            $ 36,309          $ (85,429)          $     4,922       $ 29,192        $ 15,727

           Basic earnings (loss) per share (h):
           Income (loss) from continuing
             operations . . . . . . . . . . . . . . . . . . . . . .           $      2.60       $      (6.71)       $      0.39       $      2.25     $      1.24
           Loss from discontinued operations . . . .                                    —                  —                  —               (.01)          (.13)
           Extraordinary loss from early
             extinguishment of debt (net of
             income taxes) . . . . . . . . . . . . . . . . . . .                        —                  —                  —               (.07)             —
                                                                              $      2.60       $      (6.71)       $      0.39       $      2.17     $      1.11

           Diluted earnings (loss) per share (h):
           Income (loss) from continuing
             operations . . . . . . . . . . . . . . . . . . . . . .           $      2.52       $      (6.71)       $      0.39       $      2.22     $      1.22
           Loss from discontinued operations . . . .                                    —                  —                  —               (.01)          (.13)
           Extraordinary loss from early
             extinguishment of debt (net of
             income taxes) . . . . . . . . . . . . . . . . . . .                        —                  —                  —               (.07)             —
                                                                              $      2.52       $      (6.71)       $      0.39       $      2.14     $      1.09
Jarden Corporation
                                                    Selected Financial Data (Continued)

                                                                                         As of and for the year ended December 31,
                                                                           2002           2001               2000          1999        1998
                                                                          (a) (b)           (c)               (d)           (e)         (f)
                                                                                                        (in thousands)
OTHER FINANCIAL DATA:
EBITDA (i) . . . . . . . . . . . . . . . . . . . . . . . .            $ 75,110       $ 32,734          $ 40,673         $ 58,493     $ 42,012
Cash flows from operations . . . . . . . . . .                          69,551         39,857            19,144           22,324       27,388
Depreciation and amortization . . . . . . .                             10,001         18,797            21,311           17,697       10,548
Capital expenditures . . . . . . . . . . . . . . . .                     9,277          9,707            13,637           16,628       11,909
BALANCE SHEET DATA:
Cash and cash equivalents . . . . . . . . . . .                       $ 56,779       $  6,376          $   3,303        $ 17,394     $ 21,454
Working capital . . . . . . . . . . . . . . . . . . . .                101,557          8,035             22,975          54,611       46,923
Total assets . . . . . . . . . . . . . . . . . . . . . . .             366,765        162,234            310,429         340,364      166,974
Total debt . . . . . . . . . . . . . . . . . . . . . . . . .           216,955         84,875            137,060         140,761       25,715
                                                                                                                                                         11
                                                                                                                                                   PG.
Total stockholders’ equity . . . . . . . . . . . .                      76,764         35,129            118,221         123,025       94,893
(a)   The results of Tilia are included from April 1, 2002.
(b)   2002 includes a net release of a $4.4 million tax valuation allowance. Adjusting for the net release of the valuation allowance, the
      Company’s diluted earnings per share for 2002 would have been $2.22.
(c)   2001 includes a $121.1 million pretax loss on the sale of thermoforming assets, a $2.3 million pretax charge associated with corporate
      restructuring, a $1.4 million pretax loss on the sale of the Company’s interest in Microlin, LLC, $2.6 million of pretax separation costs
      related to the management reorganization, $1.4 million of pretax costs to evaluate strategic options, $1.4 million of pretax costs to
      exit facilities, a $2.4 million pretax charge for stock option compensation, $4.1 million of pretax income associated with the discharge
      of deferred compensation obligations and a $1.0 million pretax gain related to an insurance recovery.
(d)   2000 includes $1.6 million of pretax income associated with the reduction in long-term performance-based compensation, $1.4
      million in pretax litigation charges, net of recoveries and $0.6 million of pretax costs to evaluate strategic options.
(e)   1999 includes a $19.7 million pretax gain on the sale of the plastic packaging product line and a $2.3 million pretax charge to exit
      a plastic thermoforming facility.
(f)   1998 includes a $1.3 million pretax charge to exit a plastic injection molding facility.
(g)   Special charges (credits) and reorganization expenses were comprised of costs to evaluate strategic options, discharge of deferred
      compensation obligations, separation costs for former officers, stock option compensation, corporate restructuring costs, costs to exit
      facilities, reduction of long-term performance based compensation, litigation charges and items related to our divested thermoforming
      operations.
(h)   All earnings per share amounts have been adjusted to give effect to a 2-for-1 split of our outstanding shares of common stock that
      was effected during the second quarter of 2002.
(i)   ‘‘EBITDA’’ is calculated as operating income (loss) plus (i) depreciation and amortization, (ii) special charges (credits) and
      reorganization expenses and (iii) loss (gain) on divestiture of assets and product lines. EBITDA is not intended to represent cash flow
      from operations as defined by accounting principles generally accepted in the United States and should not be used as an alternative
      to net income as an indicator of operating performance or to cash flow as a measure of liquidity. EBITDA is included in this Form 10-K
      because it is a basis upon which our management assesses financial performance. While EBITDA is frequently used as a measure of
      operations and the ability to meet debt service requirements, it is not necessarily comparable to other similarly titled captions of other
      companies due to potential inconsistencies in the method of calculation.
                                                                 Quarterly Stock Prices
    The table below sets forth the high and low sales prices of our common stock as reported on the New York
Stock Exchange for the periods indicated. All prices have been adjusted to reflect the 2-for-1 stock split that
occurred during the second quarter of 2002:
                                                                                      First                Second           Third      Fourth
                                                                                     Quarter               Quarter         Quarter     Quarter
2002
High . . . . . . . . . . . . . . . . . . . . . . . . . . . . . . . . . . . . . . .   $15.00                $19.96         $27.46       $27.70
Low . . . . . . . . . . . . . . . . . . . . . . . . . . . . . . . . . . . . . . .    $ 7.57                $13.25         $18.35       $20.00
2001
High . . . . . . . . . . . . . . . . . . . . . . . . . . . . . . . . . . . . . . .   $ 7.56                $ 8.07         $ 6.51       $ 8.02
Low . . . . . . . . . . . . . . . . . . . . . . . . . . . . . . . . . . . . . . .    $ 6.15                $ 5.82         $ 5.35       $ 5.65
Jarden Corporation
                                          Management’s Discussion and Analysis
               We are a leading provider of niche, branded consumer products used in the home, under leading brand
           names including Ball , Bernardin , Diamond , FoodSaver , Forster and Kerr . In North America, we are the
           market leader in several targeted categories, including home canning, branded retail plastic cutlery, kitchen
           matches, toothpicks and home vacuum packaging.
                We have grown by actively acquiring new brands and expanding our existing brands. Our strategy to
           achieve future growth is to acquire new brands, sustain profitable internal growth and expand our international
           business.
                On April 24, 2002, we completed our acquisition of the business of Tilia International, Inc. and its
           subsidiaries (collectively ‘‘Tilia’’), pursuant to an asset purchase agreement (the ‘‘Acquisition’’). Based in San
           Francisco, California, Tilia was a developer, manufacturer and marketer of a patented vacuum packaging
           system for home use, primarily for food storage, under the FoodSaver brand. The Acquisition was entered into
           as part of our plan to pursue growth in branded consumer products. We acquired the business of Tilia for
           approximately $145 million in cash and $15 million in seller debt financing. In addition, the Acquisition
           includes an earn-out provision with a potential payment in cash or our common stock of up to $25 million
           payable in 2005, provided that certain earnings performance targets are met. In conjunction with the
      12
PG.
           Acquisition, we incurred expenses in the amount of approximately $4.5 million. Due to the Company having
           effective control of the business of Tilia as of April 1, 2002, the results of Tilia have been included in the
           Company’s results from such date.
                Effective November 26, 2001, we sold the assets of our Triangle, TriEnda and Synergy World plastic
           thermoforming operations (‘‘TPD Assets’’) to Wilbert, Inc. for $21.0 million in cash, a non-interest bearing
           one-year note (‘‘Wilbert Note’’) as well as the assumption of certain identified liabilities. The carrying amount
           on the Wilbert Note of $1.6 million was repaid on November 25, 2002. In connection with this sale, we recorded
           a pre-tax loss of approximately $121.1 million in 2001. The proceeds from the sale were used to pay down the
           Company’s term debt under its old credit agreement.
                Effective November 1, 2001, we sold our majority interest in Microlin, LLC (‘‘Microlin’’), a developer of
           proprietary battery and fluid delivery technology, for $1,000 in cash plus contingent consideration based upon
           future performance through December 31, 2012 and the cancellation of future funding requirements. We
           recorded a pretax loss of $1.4 million in 2001 related to the sale.
               Pro forma financial information relating to the Acquisition and the sales of TPD Assets and Microlin has
           been included in the notes to our consolidated financial statements.
                On September 24, 2001, our board of directors appointed Martin E. Franklin as our Chairman and Chief
           Executive Officer and Ian G.H. Ashken as our Vice Chairman, Chief Financial Officer and Secretary. Following
           this appointment we undertook a new business and management strategy to concentrate on niche, branded
           consumer products, which led to the sale of the TPD Assets and the Acquisition. During 2002, we revised our
           business segment information to report four business segments: branded consumables, home vacuum
           packaging, plastic consumables and other. Prior periods have been reclassified to conform to the current
           segment definitions.

           Results of Operations – Comparing 2002 to 2001
                 We reported net sales of $368.2 million in 2002, an increase of 20.7% from net sales of $305.0 million in
           2001. From April 1, 2002 onwards, our home vacuum packaging segment, which consists of the newly acquired
           Tilia business, generated net sales of $145.3 million. Our branded consumables segment reported net sales of
           $112.3 million in 2002 compared to $120.6 million in 2001. Net sales were $8.3 million or 6.9% lower than
           2001, principally due to severe drought weather conditions during summer 2002 in the South, Southeast and
           West Central regions of the United States. Our plastic consumables segment reported net sales of $70.6 million
           in 2002 compared to $139.9 million in 2001. The principal cause of the $69.3 million decrease was the
           divestiture of the TPD Assets and Microlin, which accounted for $63.3 million of such change (after adjusting
           for $1.2 million of intercompany sales to these businesses). The remaining $6.0 million is principally due to
Jarden Corporation
                      Management’s Discussion and Analysis (Continued)
lower tooling sales and a contractual sales price reduction to a significant customer. In the other segment, net
sales decreased to $41.0 million in 2002 from $45.5 million in 2001, primarily due to reduced sales to the United
States Mint in connection with its inventory reduction program for all coinage.
     We reported operating income of $65.1 million for 2002. These results compare to an operating loss of
$113.9 million for 2001, which included special charges (credits) and reorganization expenses of $5.0 million
and a loss on divestitures of assets and product lines of $122.9 million. All of our segments generated increases
in operating income in 2002 from 2001, with the exception of the other segment, which had a small decrease
but still maintained a constant operating income percentage of net sales in 2002. From April 1, 2002 onwards,
our home vacuum packaging segment, which consists of the newly acquired Tilia business, generated operating
income of $31.7 million. Operating income for our branded consumables and plastic consumables segments
increased by $4.7 million and $14.4 million, respectively, in 2002 compared to 2001. The other factors that
contributed to these favorable operating income results are discussed in the following two paragraphs.
     Gross margin percentages on a consolidated basis increased to 41.2% in 2002 from 23.7% in 2001,
reflecting the higher gross margins of the acquired home vacuum packaging business in 2002, the lower gross
margins of the disposed TPD Assets and Microlin businesses in 2001, a $1.5 million charge for slow moving                  13
                                                                                                                     PG.
inventory in the branded consumables segment in 2001 and cost efficiency increases in our plastic consumables
segment. These increases were partially offset by lower gross margins in the branded consumables segment
caused by the lower sales volume.
     Selling, general and administrative expenses increased to $86.5 million in 2002 from $53.3 million in
2001, or, as a percentage of net sales increased to 23.5% in 2002 from 17.5% in 2001. This increase was
principally due to the acquisition of the home vacuum packaging business, which accounted for an additional
$46.3 million of selling, general and administrative expenses, and because of company-wide increased
performance-based compensation expenses related to our strong financial performance in 2002. Partially
offsetting this were decreases in selling, general and administrative expenses in our branded consumables,
plastic consumables and other segments. Expenses within the branded consumables segment decreased due to
lower selling expenses associated with the decrease in net sales discussed above. Expenses within our plastic
consumables segment decreased primarily due to the divestiture of TPD Assets and Microlin, which accounted
for $11.7 million of this decline, and lower expenses in the remaining business of the segment.
     We incurred net special charges (credits) and reorganization expenses of $5.0 million in 2001, consisting
of $0.8 million in costs to exit facilities, $2.4 million in stock option compensation, $2.3 million in corporate
restructuring costs, $2.6 million in separation costs for former executive officers and $1.4 million of costs to
evaluate strategic options, partially offset by $4.1 million in pre-tax income related to the discharge of certain
deferred compensation obligations and $0.4 million of income for items related to the divested TPD Assets.
    As a result of the adoption of SFAS No. 142, we did not record goodwill amortization in 2002. Goodwill
amortization of approximately $5.2 million had been recorded in 2001.
     Net interest expense in 2002 was $12.6 million compared to $11.8 million for 2001, primarily due to the
additional indebtedness assumed pursuant to the Acquisition, partially offset by the write-off in 2001 of $1.5
million of previously deferred debt issuance costs in November 2001 in conjunction with the amendment to our
credit facility effected in connection with the TPD Assets sale. During 2002, we had a lower weighted average
interest rate than the prior year, which was more than offset by higher average borrowings outstanding.
     Our effective tax rate was 30.8% in 2002 compared to 32.2% in 2001. At December 31, 2001, we had
federal net operating losses that were recorded as a deferred tax asset with a valuation allowance of $5.4
million. Due to the impact of the Job Creation Act and the tax refunds that we received as a result, a net $4.4
million of this valuation allowance was released in 2002 resulting in an income tax provision of $16.2 million.
Our net income for 2002 would have been $31.9 million or $2.22 diluted earnings per share if this valuation
allowance release was excluded. Excluding the release of this valuation allowance, our effective tax rate was
approximately 39.2% in 2002. The effective tax rate in 2001 was lower than the statutory federal rate due to
the valuation allowance described above.
Jarden Corporation
                                 Management’s Discussion and Analysis (Continued)
           Results of Operations – Comparing 2001 to 2000
                We reported consolidated net sales of $305.0 million in 2001, a decrease of 14.7% from net sales of $357.4
           million in 2000. Net sales of the branded consumables segment were $120.6 million in 2001 compared to
           $120.4 million in 2000. Increased sales in the United States were offset by decreased sales in Canada due to
           unfavorable weather conditions and customers carrying higher levels of inventory over from 2000. Net sales
           within the plastic consumables segment were $139.9 million in 2001 compared to $179.3 million in 2000. The
           decrease of $39.4 million or 22.0% was due primarily to (i) lower demand for industrial thermoformed parts
           (part of the divested TPD Assets) in the heavy truck and material handling markets, and (ii) the fact that 2001
           did not include December sales for the divested TPD Assets. Net sales of the other segment decreased to $45.5
           million in 2001 from $58.8 million in 2000. This decrease of $13.3 million or 22.6% resulted from lower
           demand in all of our zinc product lines.
                Our operating loss for 2001 was $113.9 million, including special charges (credits) and reorganization
           expenses of $5.0 million and a total loss on divestitures of assets and product lines of $122.9 million. These
           results compare to operating income for 2000 of $19.0 million. The factors that contributed to these results are
           discussed in the following two paragraphs.
      14
PG.
                Gross margin percentages increased to 23.7% in 2001 from 23.3% in 2000. Gross margin percentages
           increased for branded consumables due primarily to cost efficiencies which continued during 2001 as the
           benefits of the segment’s SAP system implementation continued to be realized. The plastic consumables
           segment gross margin percentages declined from 16% in 2000 to 13% in 2001. This decrease in gross margin
           percentage was due primarily to (i) lower sales of plastic thermoformed parts (part of the divested TPD Assets)
           resulting in diminished operating efficiencies, and (ii) lower sales volumes causing fixed overhead costs to be
           allocated to less sales of injection molded plastic parts. There was an increase in the other segment’s gross
           margin percentages from 28% in 2000 to 29% in 2001.
                Selling, general and administrative expenses decreased 7.1% to $53.3 million in 2001 from $57.3 million
           in 2000, or, as a percentage of sales increased to 17.5% in 2001 from 16.0% in 2000. Branded consumables
           expenses decreased primarily due to lower expenses associated with sales and marketing, warehousing and
           shipping. Expenses within the plastic consumables segment decreased primarily as a result of the cost savings
           realized due to a third quarter 2000 realignment and consolidation of our divested TPD Assets and the fact that
           2001 did not include December expenses for the divested TPD Assets. Excluding the TPD Assets, selling, general
           and administrative expenses in the remainder of the plastic consumables segment and the other segment
           remained relatively constant.
               Goodwill amortization decreased from $6.4 million in 2000 to $5.2 million in 2001 due primarily to our
           November 2001 sale of the TPD Assets included in the plastic consumables segment.
                We incurred net special charges (credits) and reorganization expenses of $5.0 million in 2001, consisting
           of $0.8 million in costs to exit facilities, $2.4 million in stock option compensation, $2.3 million in corporate
           restructuring costs, $2.6 million in separation costs for former executive officers and $1.4 million of costs to
           evaluate strategic options, partially offset by $4.1 million in pre-tax income related to the discharge of certain
           deferred compensation obligations and $0.4 million of income for items related to the divested TPD Assets.
                Net interest expense in 2001 was $11.8 million compared to $11.9 million for 2000. The effects of lower
           average borrowings outstanding and lower interest rates during 2001 were offset by the write-off of $1.5
           million of previously deferred debt issuance costs in November 2001 in conjunction with the amendment to our
           credit facility effected in connection with the sale of TPD Assets. Our effective interest rate for the year ended
           December 31, 2001 was 7.7%. As a result of decreasing interest rates during 2001, our interest rate swaps, which
           were at a fixed interest rate of 5.7%, resulted in additional interest expense to us during the year ended
           December 31, 2001.
                Our effective tax rate was 32.2% for 2001 compared to 34.0% for 2000. The effective rate for 2001 is lower
           than the statutory federal rate primarily because it includes a valuation allowance for tax benefits associated
           with the loss on the sale of the TPD Assets. The effective rate for 2000 reflects the recognition of a tax benefit
           from exiting the Central European home canning test market.
Jarden Corporation
                      Management’s Discussion and Analysis (Continued)
Financial Condition, Liquidity and Capital Resources
     During 2002, we made the following changes to our capital resources in connection with the financing of
the Acquisition:
         completed an offering of $150 million of 93⁄4% senior subordinated notes (‘‘Notes’’) to qualified
         institutional buyers in a private placement pursuant to Rule 144A under the Securities Act of 1933,
         which were later wholly exchanged pursuant to an offering for 93⁄4% senior subordinated notes which
         are registered under the Securities Act of 1933, as amended (‘‘New Notes’’);
         in conjunction with the Notes, entered into a $75 million interest rate swap to receive a fixed rate of
         interest and pay a variable rate of interest based upon LIBOR;
         refinanced our existing indebtedness with a new $100 million five-year senior secured credit facility,
         which included a $50 million term loan facility and a $50 million revolving credit facility (‘‘New
         Credit Agreement’’); and
         entered into $15 million of seller debt financing.
                                                                                                                           15
                                                                                                                     PG.
     The Notes were issued at a discount such that we received approximately $147.7 million in net proceeds.
The Notes will mature on May 1, 2012, however, on or after May 1, 2007, we may redeem all or part of the Notes
at any time at a redemption price ranging from 100% to 104.875% of the principal amount, plus accrued and
unpaid interest and liquidated damages, if any. Prior to May 1, 2005, we may redeem up to 35% of the aggregate
principal amount of the Notes with the net cash proceeds from certain public equity offerings at a redemption
price of 109.75% of the principal amount, plus accrued and unpaid interest and liquidated damages, if any.
Interest on the Notes accrues at the rate of 9.75% per annum and is payable semi-annually in arrears on May
1 and November 1, with the first payment having occurred on November 1, 2002.
    During December 2002, the Company completed an offering to the holders of the Notes to exchange the
Notes for the New Notes. The New Notes are substantially similar to the Notes except that certain mandatory
redemption provisions and the transfer restrictions applicable to the Notes are not applicable to the New Notes.
     In conjunction with the Notes, on April 24, 2002, we entered into a $75 million interest rate swap (‘‘Initial
Swap’’) to receive a fixed rate of interest and pay a variable rate of interest based upon LIBOR. The Initial Swap
had a maturity date that was the same as the Notes. Interest was payable semi-annually in arrears on May 1 and
November 1, commencing on November 1, 2002. The initial effective rate of interest that we established on this
swap was 6.05%. This contract was considered to be an effective hedge against changes in the fair value of our
fixed-rate debt obligation for both tax and accounting purposes.
     Effective September 12, 2002, we entered into an agreement, whereby we unwound the Initial Swap and
contemporaneously entered into a new $75 million interest rate swap (‘‘Replacement Swap’’). The Replacement
Swap has the same terms as the Initial Swap, except that we will pay a variable rate of interest based upon 6
month LIBOR in arrears. The spread on this contract is 470 basis points. Based upon this contract, we paid an
effective interest rate of 6.32% on November 1, 2002. In return for unwinding the Initial Swap, we received $5.4
million in cash proceeds, of which $1 million related to accrued interest that was owed to us. The remaining
$4.4 million of proceeds will be amortized over the remaining life of the Notes as a credit to interest expense
and is included in our consolidated balance sheet as an increase to the value of the long-term debt. Such
amortization amount offsets the increased effective rate of interest that we pay on the Replacement Swap. We
have continued to accrue interest on the Replacement Swap at a 6.32% effective rate for the remainder of 2002.
     The Replacement Swap is also considered to be an effective hedge against changes in the fair value of our
fixed-rate debt obligation for both tax and accounting purposes. The fair market value of the interest rate swap
as of December 31, 2002 was approximately $2.4 million and is included as an asset within other assets in the
consolidated balance sheet, with a corresponding offset to long-term debt. We are exposed to credit loss in the
event of non-performance by the other party to the Replacement Swap, a large financial institution, however,
we do not anticipate non-performance by the other party.
Jarden Corporation
                                 Management’s Discussion and Analysis (Continued)
                 The New Credit Agreement matures on April 24, 2007. The revolving credit facility and the term loan
           facility bear interest at a rate equal to (i) the Eurodollar Rate pursuant to an agreed formula or (ii) a Base Rate
           equal to the higher of (a) the Bank of America prime rate and (b) the federal funds rate plus .50%, plus, in each
           case, an applicable margin ranging from 2.00% to 2.75% for Eurodollar Rate loans and from .75% to 1.5% for
           Base Rate loans.
                The New Credit Agreement contains certain restrictions on the conduct of our business, including, among
           other things restrictions, generally, on:
                      incurring debt;
                      making investments;
                      exceeding certain agreed upon capital expenditures;
                      creating or suffering liens;
                      completing certain mergers;
                      consolidations and sales of assets and, with permitted exceptions, acquisitions;
      16
PG.

                      declaring dividends;
                      redeeming or prepaying other debt; and
                      certain transactions with affiliates.
                The New Credit Agreement also requires us to maintain certain financial covenants.
               During 2002, we incurred costs in connection with the issuance of the Notes, the New Notes and the New
           Credit Agreement of approximately $7.4 million.
                The seller debt financing for the Acquisition consists of a non-interest bearing note in the principal
           amount of $10 million that is due on March 31, 2003 and a note in the principal amount of $5 million, bearing
           interest at 5%, which is due on April 24, 2004. For accounting purposes, we have imputed an interest rate of
           5% on the $10 million non-interest bearing note.
                 Until it was replaced by the New Credit Agreement on April 24, 2002, our senior credit facility, as amended
           (‘‘Old Credit Agreement’’), provided for a revolving credit facility of $40 million and a term loan which
           amortized periodically as required by the terms of the agreement. Interest on borrowings under the Old Credit
           Agreement’s term loan and the revolving credit facilities were based upon fixed increments over adjusted
           LIBOR or the agent bank’s alternate borrowing rate as defined in the agreement. The agreement also required
           the payment of commitment fees on the unused balance. During the first quarter of 2002, approximately $38
           million of tax refunds we received were used to repay a portion of the outstanding amounts under the Old Credit
           Agreement.
                In May 1999, we entered into a three-year interest rate swap with an initial notional value of $90 million.
           The swap effectively fixed the interest rate on approximately 60% of our term debt at a maximum rate of 7.98%
           for the three-year period. The swap matured and was terminated in March 2002.
               As of December 31, 2002, we had $47.5 million outstanding under the term loan facility of the New Credit
           Agreement, with a weighted average interest rate of 4.3%. As of December 31, 2002, we had not drawn down
           any of the $50 million available under the revolving credit facility of the New Credit Agreement, although we
           have used approximately $4.2 million of availability for the issuance of letters of credit. See ‘‘Recent
           Developments’’ below, for a discussion of the recent amendment to our New Credit Agreement.
                As a result of the losses arising from the sale of the TPD Assets, we recovered in January 2002
           approximately $15.7 million of federal income taxes paid in 1999 and 2000 by utilizing the carryback of a tax
           net operating loss generated in 2001. On March 9, 2002, The Job Creation and Workers Assistance Act of 2002
           was enacted which provides, in part, for the carryback of 2001 net operating losses for five years instead of the
           previous two year period. As a result, we filed for an additional refund of $22.8 million, of which $22.2 million
           was received in March 2002 and the remainder was received in April 2002.
Jarden Corporation
                       Management’s Discussion and Analysis (Continued)
     Working capital (defined as current assets less current liabilities) increased to approximately $101.6
million at December 31, 2002 from approximately $8.0 million at December 31, 2001 due primarily to:
           the working capital of the acquired home vacuum packaging business;
           a lower amount of current portion of debt and increased cash on hand amounts caused by our
           favorable operating results and the new financing relationships discussed above; and
          the receipt of $22.3 million of tax refunds which had not been included in working capital in 2001.
     Cash flow generated from operations, excluding net income tax refunds was approximately $31.0 million
for the year ended December 31, 2002.
     Capital expenditures were $9.3 million in 2002 compared to $9.7 million for 2001 and are largely related
to maintaining facilities, tooling projects, improving manufacturing efficiencies and a portion of the costs of
the installation of new packaging lines for the branded consumables segment. As of December 31, 2002, we had
capital expenditure commitments in the aggregate for all our segments of approximately $3.9 million, of which
$2.5 million relates to the completion of the new packaging lines for the branded consumables segment. As of
December 31, 2002, our home vacuum packaging segment had committed to purchase $18.5 million of                            17
                                                                                                                     PG.
inventory from various vendors in the year 2003. Additionally, as of December 31, 2002, our other segment had
forward buy contracts for 2003 to purchase zinc ingots in the aggregate amount of approximately $2.5 million,
which are expected to be used in operations in 2003.
     We believe that cash generated from our operations and our availability under our senior credit facility, are
adequate to satisfy our working capital and capital expenditure requirements for the foreseeable future.
However, we may raise additional capital from time to time to take advantage of favorable conditions in the
capital markets or in connection with our corporate development activities.
     The following table includes aggregate information about our contractual obligations as of December 31,
2002 and the periods in which payments are due. Certain of these amounts are not required to be included in
our consolidated balance sheet:
                                                                 Payments due by period (in millions)
                                                           Less than            1-3                 4-5     After
                                             Total          1 Year             Years               Years   5 Years
Debt (1)                                    $212.5          $ 16.3            $ 25.0             $ 21.2    $150.0
Operating Leases                              16.1             5.6               8.4                2.1        —
Unconditional Purchase
  Obligations                                  24.9           24.9                  —                  —        —
Other Non-current Obligations                   2.8            1.8                 1.0                 —        —
Total Contractual Cash
  Obligations                               $256.3          $ 48.6            $ 34.4             $ 23.3    $150.0

     (1)    The debt amounts are based on the principal payments that will be due upon their maturity and
            exclude approximately $6.6 million of non-debt balances arising from the interest rate swap
            transactions described in the notes to our consolidated financial statements.
    Commercial commitments are items that we could be obligated to pay in the future:
           As of December 31, 2002, we had $4.2 million in standby and commercial letters of credit that all
           expire in 2003;
           In connection with the Acquisition, we may be obligated to pay an earn-out in cash or our common
           stock of up to $25 million in 2005, provided that certain earnings performance targets are met; and
        In connection with a contract we have entered into to acquire additional intellectual property, we may
        be obligated to pay up to $7.5 million between 2003 and 2009, providing certain contractual
        obligations, including the issuance of patents amongst other things, are satisfied.
    These amounts are not required to be included in our consolidated balance sheet.
Jarden Corporation
                                 Management’s Discussion and Analysis (Continued)
           Recent Developments
                In January 2003, we filed a shelf registration statement, which was declared effective by the Securities and
           Exchange Commission (the ‘‘Commission’’) on January 31, 2003. This shelf registration statement is intended
           to facilitate our access to growth capital for future acquisitions and allows us to sell over time up to $150
           million of common stock, preferred stock, warrants, debt securities, or any combination of these securities in
           one or more separate offerings in amounts, at prices and on terms to be determined at the time of the sale.
                 On February 7, 2003, we completed our acquisition of the business of Diamond Brands, Incorporated, and
           its subsidiaries (‘‘Diamond Brands’’), a manufacturer and distributor of kitchen matches, toothpicks and retail
           plastic cutlery under the Diamond® and Forster® trademarks, pursuant to an asset purchase agreement. The
           purchase price of this transaction was approximately $86 million in cash, net of cash on hand at Diamond
           Brands, paid at closing and a deferred payment in the amount of $6 million payable in cash or our common
           stock, at our election, on or before August 7, 2003. In connection with this acquisition, we amended our New
           Credit Agreement, increasing our term loan facility by $10 million and our revolving loan facility by $20
           million. We used cash on hand and draw downs under our debt facilities to finance the transaction. As of
           December 31, 2002, approximately $1.5 million for an escrow deposit and expenses related to the Diamond
      18
PG.
           Brands acquisition had been capitalized and included in our balance sheet. Following this acquisition and the
           effectiveness of our amendment, we had outstanding $57.5 million under our term loan facility and $14 million
           under our revolving credit facility. After taking account of the outstanding amount and issued letters of credit,
           we had approximately $45.8 million of availability remaining under the revolving credit agreement.

           Critical Accounting Policies
                 Our financial statements are prepared in accordance with accounting principles generally accepted in the
           United States, which require us to make judgments, estimates and assumptions that affect the amounts reported
           in the financial statements and accompanying notes. The following list of critical accounting policies is not
           intended to be a comprehensive list of all our accounting policies. Our significant accounting policies are more
           fully described in the notes to our consolidated financial statements. The following represents a summary of our
           critical accounting policies, defined as those policies that we believe are the most important to the portrayal of
           our financial condition and results of operations, and/or require management’s significant judgments and
           estimates:
           Revenue recognition and product returns
                We recognize revenue when title transfers. In most cases, title transfers at the time product is shipped to
           customers. We allow customers to return defective or damaged products as well as certain other products for
           credit, replacement, or exchange. Our revenue is recognized as the net amount to be received after deducting
           estimated amounts for product returns, discounts, and allowances. We estimate future product returns based
           upon historical return rates and our judgment. If these estimates do not properly reflect future returns, they
           could be revised.
           Accounts receivable
                We maintain an allowance for doubtful accounts for estimated losses that may result from the inability of
           our customers to make required payments. If the financial condition of our customers were to deteriorate or our
           judgment regarding their financial condition was to change negatively, additional allowances may be required
           resulting in a charge to income in the period such determination was made. Conversely, if the financial
           condition of our customers were to improve or our judgment regarding their financial condition was to change
           positively, a reduction in the allowances may be required resulting in an increase in income in the period such
           determination was made.
           Inventory
                We write down our inventory for estimated obsolescence or unmarketable inventory equal to the
           difference between the cost of the inventory and the estimated market value based upon assumptions about
Jarden Corporation
                      Management’s Discussion and Analysis (Continued)
future demand and market conditions. If actual market conditions are less favorable than those projected by us,
additional inventory write-downs may be required resulting in a charge to income in the period such
determination was made. Conversely, if actual market conditions are more favorable than those projected by us,
a reduction in the write down may be required resulting in an increase in income in the period such
determination was made.
Deferred tax assets
     We record a valuation allowance to reduce our deferred tax assets to the amount that we believe is more
likely than not to be realized. While we have considered future taxable income and ongoing prudent and
feasible tax planning strategies in assessing the need for the valuation allowance, in the event we were to
determine that we would not be able to realize all or part of our net deferred tax assets in the future, an
adjustment to the deferred tax assets would be charged to income in the period such determination was made.
Likewise, should we determine that we would be able to realize our deferred tax assets in the future in excess
of our net recorded amount, an adjustment to the deferred tax assets would increase income in the period such
determination was made.
                                                                                                                           19
                                                                                                                     PG.
Intangible assets
     We have significant intangible assets on our balance sheet that include goodwill, trademarks and other
intangibles fair valued in conjunction with acquisitions. The valuation and classification of these assets and the
assignment of amortizable lives involves significant judgments and the use of estimates. The testing of these
intangibles under established guidelines for impairment also requires significant use of judgment and
assumptions. Our assets are tested and reviewed for impairment on an ongoing basis under the established
accounting guidelines. Changes in business conditions could potentially require adjustments to these asset
valuations.

Contingencies
      We are involved in various legal disputes in the ordinary course of business. In addition, the Environ-
mental Protection Agency has designated our Company as a potentially responsible party, along with numerous
other companies, for the clean up of several hazardous waste sites. Based on currently available information,
we do not believe that the disposition of any of the legal or environmental disputes our Company is currently
involved in will require material capital or operating expenditures or will otherwise have a material adverse
effect upon the financial condition, results of operations, cash flows or competitive position of our Company.
It is possible, that as additional information becomes available, the impact on our Company of an adverse
determination could have a different effect.

New Accounting Pronouncements
      In July 2001, the Financial Accounting Standards Board (‘‘FASB’’) issued Statements of Financial
Accounting Standards (‘‘SFAS’’) No. 141, Business Combinations, and No. 142, Goodwill and Other Intangible
Assets, effective for fiscal years beginning after December 15, 2001. Under the new rules, goodwill and
intangible assets deemed to have indefinite lives are no longer amortized, but are subject to annual impairment
tests in accordance with the statements. Other intangible assets continue to be amortized over their useful lives.
We applied the new rules on accounting for goodwill and other intangible assets beginning in the first quarter
of 2002. We have performed the required tests of goodwill and indefinite lived intangible assets and, based on
the results, have not recorded any charges related to the adoption of and subsequent conformity with SFAS No.
142. In 2001 and 2000, we recorded goodwill amortization of $5.2 million and $6.4 million, respectively. The
adoption of SFAS No. 141 did not have a material impact on our results of operations or financial position.
    In August 2001, the FASB issued SFAS No. 144, Accounting for the Impairment or Disposal of Long-Lived
Assets, effective for fiscal years beginning after December 15, 2001. This standard superceded Statement of
Financial Accounting Standard No. 121, Accounting for the Impairment of Long-Lived Assets and for
Long-Lived Assets to Be Disposed Of, and provided a single accounting model for long-lived assets to be
Jarden Corporation
                                  Management’s Discussion and Analysis (Continued)
           disposed of. The new standard also superceded the provisions of APB Opinion No. 30 with regard to reporting
           the effects of a disposal of a segment of a business and required expected future operating losses from
           discontinued operations to be displayed in discontinued operations in the period(s) in which the losses are
           incurred. SFAS No. 144 was effective for our business beginning with the first quarter of 2002 and its adoption
           did not have a material impact on our results of operations or financial position.
                In April 2002, the FASB issued SFAS No. 145, Recision of SFAS Nos. 4, 44 and 64, Amendment of SFAS
           No. 13, and Technical Corrections as of April 2000. SFAS No. 145 revises the criteria for classifying the
           extinguishment of debt as extraordinary and the accounting treatment of certain lease modifications. SFAS No.
           145 is effective in fiscal 2003 and we do not expect it to have a material impact on our consolidated financial
           statements. In 2003, we will conform with the requirements of SFAS No. 145 in our Selected Financial Data
           disclosure in connection with our early extinguishment of debt that occurred in 1999.
                In July 2002, the FASB issued SFAS No. 146, Accounting for Costs Associated with Exit or Disposal
           Activities. SFAS No. 146 provides guidance on the timing of the recognition of costs associated with exit or
           disposal activities. The new guidance requires costs associated with exit or disposal activities to be recognized
           when incurred. Previous guidance required recognition of costs at the date of commitment to an exit or disposal
      20
PG.
           plan. The provisions of the statement are to be adopted prospectively for exit activities after December 31, 2002.
           Although SFAS No. 146 may impact the accounting for costs related to exit or disposal activities that we may
           enter into in the future, particularly the timing of recognition of these costs, the adoption of the statement will
           not have an impact on our present financial condition or results of operations.
                In December 2002, the FASB issued SFAS No. 148, Accounting for Stock-Based Compensation – Transition
           and Disclosure. SFAS No. 148 amends SFAS No. 123, Accounting for Stock-Based Compensation, to provide
           alternative methods of transition for a voluntary change to the fair value based methods of accounting for
           stock-based employee compensation. In addition, SFAS No. 148 amends the disclosure requirements of SFAS
           No. 123 to require more prominent disclosures in both annual and interim financial statements about the
           method of accounting for stock-based employee compensation and the effect of the method used on reported
           results. The additional disclosure requirements of SFAS No. 148 are effective for fiscal years ending after
           December 15, 2002. As provided for in SFAS No. 148, we have elected to continue to follow the intrinsic value
           method of accounting as prescribed by Accounting Principles Board Opinion No. 25, Accounting for Stock
           Issued to Employees, to account for stock options.
           Forward-Looking Statements
                 From time to time, we may make or publish forward-looking statements relating to such matters as
           anticipated financial performance, business prospects, technological developments, new products, and similar
           matters. Such statements are necessarily estimates reflecting management’s best judgment based on current
           information. The Private Securities Litigation Reform Act of 1995 provides a safe harbor for forward-looking
           statements. Such statements are usually identified by the use of words or phrases such as ‘‘believes,’’
           ‘‘anticipates,’’ ‘‘expects,’’ ‘‘estimates,’’ ‘‘planned,’’ ‘‘outlook’’ and ‘‘goal.’’ Because forward-looking statements
           involve risks and uncertainties, our actual results could differ materially. In order to comply with the terms of
           the safe harbor, we note that a variety of factors could cause our actual results and experience to differ
           materially from the anticipated results or other expectations expressed in forward-looking statements.
                While it is impossible to identify all such factors, the risks and uncertainties that may affect the operations,
           performance and results of our business include the following:
                Our significant indebtedness could adversely affect our financial health, and prevent us from fulfilling our
                obligations under the New Notes and the New Credit Agreement;
                We will require a significant amount of cash to service our indebtedness. Our ability to generate cash
                depends on many factors beyond our control;
                Reductions, cancellations or delays in customer purchases would adversely affect our profitability;
                We may be adversely affected by the financial health of the U.S. retail industry;
Jarden Corporation
                      Management’s Discussion and Analysis (Continued)
    We may be adversely affected by the trend towards retail trade consolidation;
    Sales of some of our products are seasonal and weather related;
    Competition in our industries may hinder our ability to execute our business strategy, sustain profitability,
    or maintain relationships with existing customers;
    If we fail to develop new or expand existing customer relationships, our ability to grow our business will
    be impaired;
    Our operations are subject to a number of Federal, state and local environmental regulations;
    We may be adversely affected by remediation obligations mandated by applicable environmental laws;
    We depend on key personnel;
    We enter into contracts with the United States government and other governments;
    Our operating results can be adversely affected by changes in the cost or availability of raw materials;
                                                                                                                          21
                                                                                                                    PG.
    We may have difficulty in integrating acquired businesses, which may interrupt our business operations;
    Continuation of the United States penny as a currency denomination;
    Our business could be adversely affected because of risks which are particular to international operations;
    We depend on our patents and proprietary rights;
    We may be adversely affected by problems that may arise between certain of our vendors, customers, and
    transportation services that we rely on and their respective labor unions that represent certain of their
    employees;
    Certain of our employees are represented by labor unions; and
    Any other factors which may be identified from time to time in our periodic Commission filings and other
    public announcements.
     Should one or more of these risks or uncertainties materialize, or should underlying assumptions prove
incorrect, actual results may vary materially from those described in the forward-looking statement, we do not
intend to update forward-looking statements.

Quantitative and Qualitative Disclosures About Market Risk
      In general, business enterprises can be exposed to market risks including fluctuations in commodity prices,
foreign currency values, and interest rates that can affect the cost of operating, investing, and financing. The
Company’s exposures to these risks are low. The majority of the Company’s zinc business is conducted on a
tolling basis whereby customers supply zinc to the Company for processing, or supply contracts provide for
fluctuations in the price of zinc to be passed on to the customer. The Company’s plastic consumables business
purchases resin from regular commercial sources of supply and, in most cases, multiple sources. The supply and
demand for plastic resins is subject to cyclical and other market factors. With many of our customers, we have
the ability to pass through price increases with an increase in our selling price and certain of our customers
purchase the resin used in products we manufacture for them.
      The Company, from time to time, invests in short-term financial instruments with original maturities
usually less than fifty days. The Company is exposed to short-term interest rate variations with respect to
Eurodollar or Base Rate on its term and revolving debt obligations and 6 month LIBOR in arrears on its interest
rate swap. The spread on the interest rate swap is 470 basis points. Settlements on the interest rate swap are
made on May 1 and November 1, with the first one having been made on November 1, 2002. The Company is
exposed to credit loss in the event of non-performance by the other party to the swap, a large financial
institution, however, the Company does not anticipate non-performance by the other party.
Jarden Corporation
                                Management’s Discussion and Analysis (Continued)
                Changes in Eurodollar or LIBOR interest rates would affect the earnings of the Company either positively
           or negatively depending on the changes in short-term interest rates. Assuming that Eurodollar and LIBOR rates
           each increased 100 basis points over period end rates on the outstanding term debt and interest rate swap, the
           Company’s interest expense would have increased by approximately $0.8 million and $0.5 million for 2002 and
           2001, respectively. The amounts were determined by considering the impact of the hypothetical interest rates
           on the Company’s borrowing cost, short-term investment rates, interest rate swap and estimated cash flow.
           Actual changes in rates may differ from the assumptions used in computing this exposure.

                The Company does not invest or trade in any derivative financial or commodity instruments, nor does it
           invest in any foreign financial instruments.


      22
PG.
Jarden Corporation
                                  Report of Independent Auditors


Board of Directors and Shareholders
Jarden Corporation and Subsidiaries


We have audited the accompanying consolidated balance sheets of Jarden Corporation and subsidiaries as of
December 31, 2002 and 2001, and the related consolidated statements of operations, comprehensive income,
stockholders’ equity, and cash flows for each of the three years in the period ended December 31, 2002. These
financial statements are the responsibility of the Company’s management. Our responsibility is to express an
opinion on these financial statements based on our audits.
                                                                                                                       23
                                                                                                                 PG.
We conducted our audits in accordance with auditing standards generally accepted in the United States. Those
standards require that we plan and perform the audit to obtain reasonable assurance about whether the
financial statements are free of material misstatement. An audit includes examining, on a test basis, evidence
supporting the amounts and disclosures in the financial statements. An audit also includes assessing the
accounting principles used and significant estimates made by management, as well as evaluating the overall
financial statement presentation. We believe that our audits provide a reasonable basis for our opinion.

In our opinion, the financial statements referred to above present fairly, in all material respects, the
consolidated financial position of Jarden Corporation and subsidiaries at December 31, 2002 and 2001, and the
consolidated results of their operations and their cash flows for each of the three years in the period ended
December 31, 2002 in conformity with accounting principles generally accepted in the United States.

As discussed in Note 2 to the consolidated financial statements, on January 1, 2002, the Company adopted
Statement of Financial Accounting Standards No. 142, ‘‘Goodwill and Other Intangible Assets’’.

                                                                                   /s/ ERNST & YOUNG LLP

                                                                                   New York, New York
                                                                                   January 30, 2003
Jarden Corporation
                                                            Consolidated Statements of Operations
                                                                                                                               (in thousands, except per share amounts)
                                                                                                                                       Year ended December 31,
                                                                                                                                2002             2001            2000
           Net sales . . . . . . . . . . . . . . . . . . . . . . . . . . . . . . . . . . . . . . . . . . . . . . . . . .   $368,199          $ 304,978       $357,356
           Costs and expenses:
             Cost of sales . . . . . . . . . . . . . . . . . . . . . . . . . . . . . . . . . . . . . . . . . . . . .           216,629           232,634       274,248
             Selling, general and administrative expenses . . . . . . . . . . . . . . . . . .                                   86,461            53,254        57,342
             Goodwill amortization . . . . . . . . . . . . . . . . . . . . . . . . . . . . . . . . . . . .                           —             5,153         6,404
             Special charges (credits) and reorganization expenses . . . . . . . . . .                                               —             4,978           380
             Loss on divestitures of assets and product lines . . . . . . . . . . . . . . . .                                        —           122,887             —
           Operating income (loss) . . . . . . . . . . . . . . . . . . . . . . . . . . . . . . . . . . . . .                    65,109           (113,928)       18,982
           Interest expense, net . . . . . . . . . . . . . . . . . . . . . . . . . . . . . . . . . . . . . . . .                12,611             11,791        11,917
           Income (loss) before taxes and minority interest . . . . . . . . . . . . . . . . .                                  52,498         (125,719)           7,065
           Income tax provision (benefit) . . . . . . . . . . . . . . . . . . . . . . . . . . . . . . . .                      16,189          (40,443)           2,402
      24
PG.
           Minority interest in gain (loss) of consolidated subsidiary . . . . . . . . .                                            —              153             (259)
           Net income (loss) . . . . . . . . . . . . . . . . . . . . . . . . . . . . . . . . . . . . . . . . . . .         $ 36,309          $ (85,429)      $    4,922


           Basic earnings (loss) per share:
             Net income (loss) . . . . . . . . . . . . . . . . . . . . . . . . . . . . . . . . . . . . . . . . .           $      2.60       $      (6.71)   $     0.39

           Diluted earnings (loss) per share:
             Net income (loss) . . . . . . . . . . . . . . . . . . . . . . . . . . . . . . . . . . . . . . . . .           $      2.52       $      (6.71)   $     0.39

           Weighted average shares outstanding:
            Basic . . . . . . . . . . . . . . . . . . . . . . . . . . . . . . . . . . . . . . . . . . . . . . . . . . .        13,940             12,726         12,676
            Diluted . . . . . . . . . . . . . . . . . . . . . . . . . . . . . . . . . . . . . . . . . . . . . . . . .          14,392             12,726         12,766


                            The accompanying notes are an integral part of the consolidated financial statements.
Jarden Corporation
                                                          Consolidated Balance Sheets
                                                                                                                                 (in thousands, except per share amounts)
                                                                                                                                               December 31,
                                                                                                                                       2002                    2001
Assets
Current assets:
    Cash and cash equivalents . . . . . . . . . . . . . . . . . . . . . . . . . . . . . . . . . . . . . . . . .                    $ 56,779                $    6,376
    Accounts receivable, net of allowances of $6,095 and $778 . . . . . . . . . . . . .                                              40,470                    14,917
    Income taxes receivable . . . . . . . . . . . . . . . . . . . . . . . . . . . . . . . . . . . . . . . . . . .                     1,039                    16,252
    Inventories, net . . . . . . . . . . . . . . . . . . . . . . . . . . . . . . . . . . . . . . . . . . . . . . . . . .             59,463                    26,994
    Deferred taxes on income . . . . . . . . . . . . . . . . . . . . . . . . . . . . . . . . . . . . . . . . .                       10,312                     4,832
    Prepaid expenses and other current assets . . . . . . . . . . . . . . . . . . . . . . . . . . . .                                 4,667                     3,134
          Total current assets . . . . . . . . . . . . . . . . . . . . . . . . . . . . . . . . . . . . . . . . . .                  172,730                    72,505
Non-current assets:
Property, plant and equipment, at cost
    Land . . . . . . . . . . . . . . . . . . . . . . . . . . . . . . . . . . . . . . . . . . . . . . . . . . . . . . . . . . .           782                     782
    Buildings . . . . . . . . . . . . . . . . . . . . . . . . . . . . . . . . . . . . . . . . . . . . . . . . . . . . . . .           25,109                  24,356
    Machinery and equipment . . . . . . . . . . . . . . . . . . . . . . . . . . . . . . . . . . . . . . . . .                       115,637                 106,106               25
                                                                                                                                                                            PG.
                                                                                                                                    141,528                 131,244
       Accumulated depreciation . . . . . . . . . . . . . . . . . . . . . . . . . . . . . . . . . . . . . . . . .                    (96,291)                (87,701)
                                                                                                                                      45,237                  43,543
Intangibles, net . . . . . . . . . . . . . . . . . . . . . . . . . . . . . . . . . . . . . . . . . . . . . . . . . . . . . .        134,060                   15,487
Deferred taxes on income . . . . . . . . . . . . . . . . . . . . . . . . . . . . . . . . . . . . . . . . . . . . .                         —                  25,417
Other assets . . . . . . . . . . . . . . . . . . . . . . . . . . . . . . . . . . . . . . . . . . . . . . . . . . . . . . . . .        14,738                   5,282
Total assets . . . . . . . . . . . . . . . . . . . . . . . . . . . . . . . . . . . . . . . . . . . . . . . . . . . . . . . . .     $366,765                $162,234

Liabilities and stockholders’ equity
Current liabilities:
     Short-term debt and current portion of long-term debt . . . . . . . . . . . . . . . . .                                       $ 16,117                $ 28,500
     Accounts payable . . . . . . . . . . . . . . . . . . . . . . . . . . . . . . . . . . . . . . . . . . . . . . . .                18,466                  14,197
     Accrued salaries, wages and employee benefits . . . . . . . . . . . . . . . . . . . . . . .                                     13,559                   9,252
     Other current liabilities . . . . . . . . . . . . . . . . . . . . . . . . . . . . . . . . . . . . . . . . . . .                 23,031                  12,521
          Total current liabilities . . . . . . . . . . . . . . . . . . . . . . . . . . . . . . . . . . . . . . . .                  71,173                  64,470
Non-current liabilities:
     Long-term debt . . . . . . . . . . . . . . . . . . . . . . . . . . . . . . . . . . . . . . . . . . . . . . . . . .              200,838                   56,375
     Deferred taxes on income . . . . . . . . . . . . . . . . . . . . . . . . . . . . . . . . . . . . . . . . .                        6,377                        —
     Other non-current liabilities . . . . . . . . . . . . . . . . . . . . . . . . . . . . . . . . . . . . . . .                      11,613                    6,260
          Total non-current liabilities . . . . . . . . . . . . . . . . . . . . . . . . . . . . . . . . . . . .                      218,828                   62,635
Commitments and contingencies (Notes 13 & 14)                                                                                              —                        —
Stockholders’ equity:
     Common stock ($.01 par value, 50,000 shares authorized, 15,926 and
        15,926 shares issued and 14,371 and 12,796 shares outstanding at
        December 31, 2002 and 2001, respectively) . . . . . . . . . . . . . . . . . . . . . . . . .                                       159                     159
     Additional paid-in capital . . . . . . . . . . . . . . . . . . . . . . . . . . . . . . . . . . . . . . . . .                     34,076                   41,694
     Retained earnings . . . . . . . . . . . . . . . . . . . . . . . . . . . . . . . . . . . . . . . . . . . . . . . .                69,033                   32,724
     Notes receivable for stock purchases . . . . . . . . . . . . . . . . . . . . . . . . . . . . . . . .                              (5,109)                      —
     Accumulated other comprehensive loss . . . . . . . . . . . . . . . . . . . . . . . . . . . . . .                                 (3,463)                  (1,862)
     Less: treasury stock (1,555 and 3,130 shares, at cost, at December 31, 2002
        and 2001, respectively) . . . . . . . . . . . . . . . . . . . . . . . . . . . . . . . . . . . . . . . . .                   (17,932)                (37,586)
          Total stockholders’ equity . . . . . . . . . . . . . . . . . . . . . . . . . . . . . . . . . . . . .                       76,764                  35,129
Total liabilities and stockholders’ equity . . . . . . . . . . . . . . . . . . . . . . . . . . . . . . . . .                       $366,765                $162,234

                 The accompanying notes are an integral part of the consolidated financial statements.
jarden   2002_AR
jarden   2002_AR
jarden   2002_AR
jarden   2002_AR
jarden   2002_AR
jarden   2002_AR
jarden   2002_AR
jarden   2002_AR
jarden   2002_AR
jarden   2002_AR
jarden   2002_AR
jarden   2002_AR
jarden   2002_AR
jarden   2002_AR
jarden   2002_AR
jarden   2002_AR
jarden   2002_AR
jarden   2002_AR
jarden   2002_AR
jarden   2002_AR
jarden   2002_AR
jarden   2002_AR
jarden   2002_AR
jarden   2002_AR
jarden   2002_AR

More Related Content

What's hot

hershey HSY_Letter_2004
hershey  HSY_Letter_2004hershey  HSY_Letter_2004
hershey HSY_Letter_2004finance47
 
Britvic 2015 sustainable business report
Britvic 2015 sustainable business reportBritvic 2015 sustainable business report
Britvic 2015 sustainable business reportRebecca Minter
 
Ecolab_Shareholders_Letter
Ecolab_Shareholders_LetterEcolab_Shareholders_Letter
Ecolab_Shareholders_Letterfinance37
 
CVS Caremark 2005 Annual Report
CVS Caremark 2005 Annual ReportCVS Caremark 2005 Annual Report
CVS Caremark 2005 Annual Reportfinance3
 
QUALITY MANAGEMENT SYSTEM OF COCA COLA
QUALITY MANAGEMENT SYSTEM OF COCA COLAQUALITY MANAGEMENT SYSTEM OF COCA COLA
QUALITY MANAGEMENT SYSTEM OF COCA COLATharushika Ruwangi
 
dean foods Gregg Engles Investor Day
dean foods Gregg Engles Investor Daydean foods Gregg Engles Investor Day
dean foods Gregg Engles Investor Dayfinance23
 
anheuser-busch 2006AR_MgmntDiscuss
anheuser-busch 2006AR_MgmntDiscussanheuser-busch 2006AR_MgmntDiscuss
anheuser-busch 2006AR_MgmntDiscussfinance15
 
Financial statement analysis
Financial statement analysisFinancial statement analysis
Financial statement analysisSamuel Gibbs
 
Senior Project Analyst Report
Senior Project Analyst ReportSenior Project Analyst Report
Senior Project Analyst ReportHubert Lo
 

What's hot (10)

hershey HSY_Letter_2004
hershey  HSY_Letter_2004hershey  HSY_Letter_2004
hershey HSY_Letter_2004
 
Britvic 2015 sustainable business report
Britvic 2015 sustainable business reportBritvic 2015 sustainable business report
Britvic 2015 sustainable business report
 
Ecolab_Shareholders_Letter
Ecolab_Shareholders_LetterEcolab_Shareholders_Letter
Ecolab_Shareholders_Letter
 
CVS Caremark 2005 Annual Report
CVS Caremark 2005 Annual ReportCVS Caremark 2005 Annual Report
CVS Caremark 2005 Annual Report
 
QUALITY MANAGEMENT SYSTEM OF COCA COLA
QUALITY MANAGEMENT SYSTEM OF COCA COLAQUALITY MANAGEMENT SYSTEM OF COCA COLA
QUALITY MANAGEMENT SYSTEM OF COCA COLA
 
Andrew Peller
Andrew PellerAndrew Peller
Andrew Peller
 
dean foods Gregg Engles Investor Day
dean foods Gregg Engles Investor Daydean foods Gregg Engles Investor Day
dean foods Gregg Engles Investor Day
 
anheuser-busch 2006AR_MgmntDiscuss
anheuser-busch 2006AR_MgmntDiscussanheuser-busch 2006AR_MgmntDiscuss
anheuser-busch 2006AR_MgmntDiscuss
 
Financial statement analysis
Financial statement analysisFinancial statement analysis
Financial statement analysis
 
Senior Project Analyst Report
Senior Project Analyst ReportSenior Project Analyst Report
Senior Project Analyst Report
 

Similar to jarden 2002_AR

jarden 2004AR
jarden   2004ARjarden   2004AR
jarden 2004ARfinance49
 
mattel annual reports 2002
mattel annual reports 2002mattel annual reports 2002
mattel annual reports 2002finance35
 
home depot Annual Report 2002
home depot Annual Report 2002home depot Annual Report 2002
home depot Annual Report 2002finance2
 
interpublic group 2002ar
interpublic group 2002arinterpublic group 2002ar
interpublic group 2002arfinance44
 
interpublic group 2002ar
interpublic group 2002arinterpublic group 2002ar
interpublic group 2002arfinance44
 
best buy FY ’03 Annual Report
best buy 	FY ’03 Annual Reportbest buy 	FY ’03 Annual Report
best buy FY ’03 Annual Reportfinance7
 
whirlpool Annual Report2004
whirlpool Annual Report2004whirlpool Annual Report2004
whirlpool Annual Report2004finance13
 
MGMM ShareLet02
MGMM  ShareLet02MGMM  ShareLet02
MGMM ShareLet02finance29
 
goodrich 5E35257A-109C-481D-BB9C-7923A0DA3D8A_2000ARfinal
goodrich 5E35257A-109C-481D-BB9C-7923A0DA3D8A_2000ARfinalgoodrich 5E35257A-109C-481D-BB9C-7923A0DA3D8A_2000ARfinal
goodrich 5E35257A-109C-481D-BB9C-7923A0DA3D8A_2000ARfinalfinance44
 
2011brandztop100repor
2011brandztop100repor2011brandztop100repor
2011brandztop100reporPeter Smirnov
 

Similar to jarden 2002_AR (20)

Jarden_AR
Jarden_ARJarden_AR
Jarden_AR
 
Jarden_AR
Jarden_ARJarden_AR
Jarden_AR
 
jarden ar05
jarden   ar05jarden   ar05
jarden ar05
 
jarden ar05
jarden   ar05jarden   ar05
jarden ar05
 
jarden 2004AR
jarden   2004ARjarden   2004AR
jarden 2004AR
 
ball ar02
ball ar02ball ar02
ball ar02
 
mattel annual reports 2002
mattel annual reports 2002mattel annual reports 2002
mattel annual reports 2002
 
home depot Annual Report 2002
home depot Annual Report 2002home depot Annual Report 2002
home depot Annual Report 2002
 
ball ar01
ball ar01ball ar01
ball ar01
 
ball ar01
ball ar01ball ar01
ball ar01
 
interpublic group 2002ar
interpublic group 2002arinterpublic group 2002ar
interpublic group 2002ar
 
interpublic group 2002ar
interpublic group 2002arinterpublic group 2002ar
interpublic group 2002ar
 
ball ar03
ball ar03ball ar03
ball ar03
 
ball ar03
ball ar03ball ar03
ball ar03
 
best buy FY ’03 Annual Report
best buy 	FY ’03 Annual Reportbest buy 	FY ’03 Annual Report
best buy FY ’03 Annual Report
 
whirlpool Annual Report2004
whirlpool Annual Report2004whirlpool Annual Report2004
whirlpool Annual Report2004
 
MGMM ShareLet02
MGMM  ShareLet02MGMM  ShareLet02
MGMM ShareLet02
 
goodrich 5E35257A-109C-481D-BB9C-7923A0DA3D8A_2000ARfinal
goodrich 5E35257A-109C-481D-BB9C-7923A0DA3D8A_2000ARfinalgoodrich 5E35257A-109C-481D-BB9C-7923A0DA3D8A_2000ARfinal
goodrich 5E35257A-109C-481D-BB9C-7923A0DA3D8A_2000ARfinal
 
usg LS_99
usg LS_99usg LS_99
usg LS_99
 
2011brandztop100repor
2011brandztop100repor2011brandztop100repor
2011brandztop100repor
 

More from finance49

jarden 2001_ar
jarden   2001_arjarden   2001_ar
jarden 2001_arfinance49
 
jarden 2001_ar
jarden   2001_arjarden   2001_ar
jarden 2001_arfinance49
 
jarden 2002_AR
jarden   2002_ARjarden   2002_AR
jarden 2002_ARfinance49
 
chiquita brands international annual
chiquita brands international annualchiquita brands international annual
chiquita brands international annualfinance49
 
chiquita brands international 2000annual
chiquita brands international 2000annualchiquita brands international 2000annual
chiquita brands international 2000annualfinance49
 
chiquita brands international 2001annual
chiquita brands international 2001annualchiquita brands international 2001annual
chiquita brands international 2001annualfinance49
 
chiquita brands international 2002annual
chiquita brands international 2002annualchiquita brands international 2002annual
chiquita brands international 2002annualfinance49
 
chiquita brands international 2003annual
chiquita brands international 2003annualchiquita brands international 2003annual
chiquita brands international 2003annualfinance49
 
chiquita brands international 2004annual
chiquita brands international 2004annualchiquita brands international 2004annual
chiquita brands international 2004annualfinance49
 
chiquita brands international 2005annual
chiquita brands international 2005annualchiquita brands international 2005annual
chiquita brands international 2005annualfinance49
 
chiquita brands international 2006annual
chiquita brands international 2006annualchiquita brands international 2006annual
chiquita brands international 2006annualfinance49
 
chiquita brands international 2007annual
chiquita brands international 2007annualchiquita brands international 2007annual
chiquita brands international 2007annualfinance49
 

More from finance49 (20)

Jah112008
Jah112008Jah112008
Jah112008
 
Jah112008
Jah112008Jah112008
Jah112008
 
jarden 2001_ar
jarden   2001_arjarden   2001_ar
jarden 2001_ar
 
jarden 2001_ar
jarden   2001_arjarden   2001_ar
jarden 2001_ar
 
jarden 2002_AR
jarden   2002_ARjarden   2002_AR
jarden 2002_AR
 
chiquita brands international annual
chiquita brands international annualchiquita brands international annual
chiquita brands international annual
 
chiquita brands international 2000annual
chiquita brands international 2000annualchiquita brands international 2000annual
chiquita brands international 2000annual
 
chiquita brands international 2001annual
chiquita brands international 2001annualchiquita brands international 2001annual
chiquita brands international 2001annual
 
chiquita brands international 2002annual
chiquita brands international 2002annualchiquita brands international 2002annual
chiquita brands international 2002annual
 
chiquita brands international 2003annual
chiquita brands international 2003annualchiquita brands international 2003annual
chiquita brands international 2003annual
 
chiquita brands international 2004annual
chiquita brands international 2004annualchiquita brands international 2004annual
chiquita brands international 2004annual
 
chiquita brands international 2005annual
chiquita brands international 2005annualchiquita brands international 2005annual
chiquita brands international 2005annual
 
chiquita brands international 2006annual
chiquita brands international 2006annualchiquita brands international 2006annual
chiquita brands international 2006annual
 
chiquita brands international 2007annual
chiquita brands international 2007annualchiquita brands international 2007annual
chiquita brands international 2007annual
 
ccc_1997AR
ccc_1997ARccc_1997AR
ccc_1997AR
 
ccc_1997AR
ccc_1997ARccc_1997AR
ccc_1997AR
 
ccc_1998AR
ccc_1998ARccc_1998AR
ccc_1998AR
 
ccc_1998AR
ccc_1998ARccc_1998AR
ccc_1998AR
 
ccc_1999AR
ccc_1999ARccc_1999AR
ccc_1999AR
 
ccc_1999AR
ccc_1999ARccc_1999AR
ccc_1999AR
 

Recently uploaded

The Core Functions of the Bangko Sentral ng Pilipinas
The Core Functions of the Bangko Sentral ng PilipinasThe Core Functions of the Bangko Sentral ng Pilipinas
The Core Functions of the Bangko Sentral ng PilipinasCherylouCamus
 
House of Commons ; CDC schemes overview document
House of Commons ; CDC schemes overview documentHouse of Commons ; CDC schemes overview document
House of Commons ; CDC schemes overview documentHenry Tapper
 
Ch 4 investment Intermediate financial Accounting
Ch 4 investment Intermediate financial AccountingCh 4 investment Intermediate financial Accounting
Ch 4 investment Intermediate financial AccountingAbdi118682
 
Call Girls Near Golden Tulip Essential Hotel, New Delhi 9873777170
Call Girls Near Golden Tulip Essential Hotel, New Delhi 9873777170Call Girls Near Golden Tulip Essential Hotel, New Delhi 9873777170
Call Girls Near Golden Tulip Essential Hotel, New Delhi 9873777170Sonam Pathan
 
Economics, Commerce and Trade Management: An International Journal (ECTIJ)
Economics, Commerce and Trade Management: An International Journal (ECTIJ)Economics, Commerce and Trade Management: An International Journal (ECTIJ)
Economics, Commerce and Trade Management: An International Journal (ECTIJ)ECTIJ
 
call girls in Nand Nagri (DELHI) 🔝 >༒9953330565🔝 genuine Escort Service 🔝✔️✔️
call girls in  Nand Nagri (DELHI) 🔝 >༒9953330565🔝 genuine Escort Service 🔝✔️✔️call girls in  Nand Nagri (DELHI) 🔝 >༒9953330565🔝 genuine Escort Service 🔝✔️✔️
call girls in Nand Nagri (DELHI) 🔝 >༒9953330565🔝 genuine Escort Service 🔝✔️✔️9953056974 Low Rate Call Girls In Saket, Delhi NCR
 
(办理原版一样)QUT毕业证昆士兰科技大学毕业证学位证留信学历认证成绩单补办
(办理原版一样)QUT毕业证昆士兰科技大学毕业证学位证留信学历认证成绩单补办(办理原版一样)QUT毕业证昆士兰科技大学毕业证学位证留信学历认证成绩单补办
(办理原版一样)QUT毕业证昆士兰科技大学毕业证学位证留信学历认证成绩单补办fqiuho152
 
NO1 WorldWide Genuine vashikaran specialist Vashikaran baba near Lahore Vashi...
NO1 WorldWide Genuine vashikaran specialist Vashikaran baba near Lahore Vashi...NO1 WorldWide Genuine vashikaran specialist Vashikaran baba near Lahore Vashi...
NO1 WorldWide Genuine vashikaran specialist Vashikaran baba near Lahore Vashi...Amil baba
 
Vp Girls near me Delhi Call Now or WhatsApp
Vp Girls near me Delhi Call Now or WhatsAppVp Girls near me Delhi Call Now or WhatsApp
Vp Girls near me Delhi Call Now or WhatsAppmiss dipika
 
The Triple Threat | Article on Global Resession | Harsh Kumar
The Triple Threat | Article on Global Resession | Harsh KumarThe Triple Threat | Article on Global Resession | Harsh Kumar
The Triple Threat | Article on Global Resession | Harsh KumarHarsh Kumar
 
Bladex 1Q24 Earning Results Presentation
Bladex 1Q24 Earning Results PresentationBladex 1Q24 Earning Results Presentation
Bladex 1Q24 Earning Results PresentationBladex
 
212MTAMount Durham University Bachelor's Diploma in Technology
212MTAMount Durham University Bachelor's Diploma in Technology212MTAMount Durham University Bachelor's Diploma in Technology
212MTAMount Durham University Bachelor's Diploma in Technologyz xss
 
Stock Market Brief Deck for 4/24/24 .pdf
Stock Market Brief Deck for 4/24/24 .pdfStock Market Brief Deck for 4/24/24 .pdf
Stock Market Brief Deck for 4/24/24 .pdfMichael Silva
 
Financial Leverage Definition, Advantages, and Disadvantages
Financial Leverage Definition, Advantages, and DisadvantagesFinancial Leverage Definition, Advantages, and Disadvantages
Financial Leverage Definition, Advantages, and Disadvantagesjayjaymabutot13
 
AfRESFullPaper22018EmpiricalPerformanceofRealEstateInvestmentTrustsandShareho...
AfRESFullPaper22018EmpiricalPerformanceofRealEstateInvestmentTrustsandShareho...AfRESFullPaper22018EmpiricalPerformanceofRealEstateInvestmentTrustsandShareho...
AfRESFullPaper22018EmpiricalPerformanceofRealEstateInvestmentTrustsandShareho...yordanosyohannes2
 
原版1:1复刻堪萨斯大学毕业证KU毕业证留信学历认证
原版1:1复刻堪萨斯大学毕业证KU毕业证留信学历认证原版1:1复刻堪萨斯大学毕业证KU毕业证留信学历认证
原版1:1复刻堪萨斯大学毕业证KU毕业证留信学历认证jdkhjh
 
fca-bsps-decision-letter-redacted (1).pdf
fca-bsps-decision-letter-redacted (1).pdffca-bsps-decision-letter-redacted (1).pdf
fca-bsps-decision-letter-redacted (1).pdfHenry Tapper
 
Tenets of Physiocracy History of Economic
Tenets of Physiocracy History of EconomicTenets of Physiocracy History of Economic
Tenets of Physiocracy History of Economiccinemoviesu
 
Stock Market Brief Deck for "this does not happen often".pdf
Stock Market Brief Deck for "this does not happen often".pdfStock Market Brief Deck for "this does not happen often".pdf
Stock Market Brief Deck for "this does not happen often".pdfMichael Silva
 

Recently uploaded (20)

The Core Functions of the Bangko Sentral ng Pilipinas
The Core Functions of the Bangko Sentral ng PilipinasThe Core Functions of the Bangko Sentral ng Pilipinas
The Core Functions of the Bangko Sentral ng Pilipinas
 
House of Commons ; CDC schemes overview document
House of Commons ; CDC schemes overview documentHouse of Commons ; CDC schemes overview document
House of Commons ; CDC schemes overview document
 
Ch 4 investment Intermediate financial Accounting
Ch 4 investment Intermediate financial AccountingCh 4 investment Intermediate financial Accounting
Ch 4 investment Intermediate financial Accounting
 
Call Girls Near Golden Tulip Essential Hotel, New Delhi 9873777170
Call Girls Near Golden Tulip Essential Hotel, New Delhi 9873777170Call Girls Near Golden Tulip Essential Hotel, New Delhi 9873777170
Call Girls Near Golden Tulip Essential Hotel, New Delhi 9873777170
 
Economics, Commerce and Trade Management: An International Journal (ECTIJ)
Economics, Commerce and Trade Management: An International Journal (ECTIJ)Economics, Commerce and Trade Management: An International Journal (ECTIJ)
Economics, Commerce and Trade Management: An International Journal (ECTIJ)
 
call girls in Nand Nagri (DELHI) 🔝 >༒9953330565🔝 genuine Escort Service 🔝✔️✔️
call girls in  Nand Nagri (DELHI) 🔝 >༒9953330565🔝 genuine Escort Service 🔝✔️✔️call girls in  Nand Nagri (DELHI) 🔝 >༒9953330565🔝 genuine Escort Service 🔝✔️✔️
call girls in Nand Nagri (DELHI) 🔝 >༒9953330565🔝 genuine Escort Service 🔝✔️✔️
 
(办理原版一样)QUT毕业证昆士兰科技大学毕业证学位证留信学历认证成绩单补办
(办理原版一样)QUT毕业证昆士兰科技大学毕业证学位证留信学历认证成绩单补办(办理原版一样)QUT毕业证昆士兰科技大学毕业证学位证留信学历认证成绩单补办
(办理原版一样)QUT毕业证昆士兰科技大学毕业证学位证留信学历认证成绩单补办
 
NO1 WorldWide Genuine vashikaran specialist Vashikaran baba near Lahore Vashi...
NO1 WorldWide Genuine vashikaran specialist Vashikaran baba near Lahore Vashi...NO1 WorldWide Genuine vashikaran specialist Vashikaran baba near Lahore Vashi...
NO1 WorldWide Genuine vashikaran specialist Vashikaran baba near Lahore Vashi...
 
Vp Girls near me Delhi Call Now or WhatsApp
Vp Girls near me Delhi Call Now or WhatsAppVp Girls near me Delhi Call Now or WhatsApp
Vp Girls near me Delhi Call Now or WhatsApp
 
Monthly Economic Monitoring of Ukraine No 231, April 2024
Monthly Economic Monitoring of Ukraine No 231, April 2024Monthly Economic Monitoring of Ukraine No 231, April 2024
Monthly Economic Monitoring of Ukraine No 231, April 2024
 
The Triple Threat | Article on Global Resession | Harsh Kumar
The Triple Threat | Article on Global Resession | Harsh KumarThe Triple Threat | Article on Global Resession | Harsh Kumar
The Triple Threat | Article on Global Resession | Harsh Kumar
 
Bladex 1Q24 Earning Results Presentation
Bladex 1Q24 Earning Results PresentationBladex 1Q24 Earning Results Presentation
Bladex 1Q24 Earning Results Presentation
 
212MTAMount Durham University Bachelor's Diploma in Technology
212MTAMount Durham University Bachelor's Diploma in Technology212MTAMount Durham University Bachelor's Diploma in Technology
212MTAMount Durham University Bachelor's Diploma in Technology
 
Stock Market Brief Deck for 4/24/24 .pdf
Stock Market Brief Deck for 4/24/24 .pdfStock Market Brief Deck for 4/24/24 .pdf
Stock Market Brief Deck for 4/24/24 .pdf
 
Financial Leverage Definition, Advantages, and Disadvantages
Financial Leverage Definition, Advantages, and DisadvantagesFinancial Leverage Definition, Advantages, and Disadvantages
Financial Leverage Definition, Advantages, and Disadvantages
 
AfRESFullPaper22018EmpiricalPerformanceofRealEstateInvestmentTrustsandShareho...
AfRESFullPaper22018EmpiricalPerformanceofRealEstateInvestmentTrustsandShareho...AfRESFullPaper22018EmpiricalPerformanceofRealEstateInvestmentTrustsandShareho...
AfRESFullPaper22018EmpiricalPerformanceofRealEstateInvestmentTrustsandShareho...
 
原版1:1复刻堪萨斯大学毕业证KU毕业证留信学历认证
原版1:1复刻堪萨斯大学毕业证KU毕业证留信学历认证原版1:1复刻堪萨斯大学毕业证KU毕业证留信学历认证
原版1:1复刻堪萨斯大学毕业证KU毕业证留信学历认证
 
fca-bsps-decision-letter-redacted (1).pdf
fca-bsps-decision-letter-redacted (1).pdffca-bsps-decision-letter-redacted (1).pdf
fca-bsps-decision-letter-redacted (1).pdf
 
Tenets of Physiocracy History of Economic
Tenets of Physiocracy History of EconomicTenets of Physiocracy History of Economic
Tenets of Physiocracy History of Economic
 
Stock Market Brief Deck for "this does not happen often".pdf
Stock Market Brief Deck for "this does not happen often".pdfStock Market Brief Deck for "this does not happen often".pdf
Stock Market Brief Deck for "this does not happen often".pdf
 

jarden 2002_AR

  • 1. 2 0 02 A N N U A L R E P O R T
  • 2. TA B L E O F C O N T E N T S : 1 corporate profile and strategy 2 chairman’s letter 4 branded consumables 6 home vacuum packaging 8 plastic consumables Winners of Jarden's 2002 Annual Report Cover Design contest: 9 other Milton Murphy, Plant Manager, Plastic Consumables and Connie Phuah, Administrative Assistant, Home Vacuum Packaging 10 selected financial data 12 management’s discussion and analysis Ball® and are trademarks of Ball Corporation, under 23 financial statements limited license to Jarden Corporation.
  • 3. C O R P O R AT E P R O F I L E : Jarden Corporation is a leading provider of niche consumer products used in the home, under well-known brand names including Ball®, Bernardin®, Diamond®, FoodSaver®, Forster® and Kerr ®. In North America, Jarden is the market leader in several categories, including home canning, home vacuum packaging, kitchen matches, branded retail plastic cutlery and toothpicks. Jarden also manufactures zinc strip and a wide array of plastic products for third party consumer product and medical companies, as well as its own businesses. C O R P O R AT E S T R AT E G Y: Our objective is to increase stockholder value by building a world class consumer products company that enjoys leading market shares of niche markets for branded consumable products used in and around the home. We will seek to achieve this objective by leveraging and expanding our United States and international distribution channels, introducing new products and pursuing strategic acquisitions.
  • 4. CHAIRMAN’S LETTER “In a business where we live by the mantra, ‘Our most important assets go home every night,’ we are particularly pleased that our management teams believe in, and are excited about, our long-term stategy to build a world class consumer products company.” PG. 2 DEAR FELLOW SHAREHOLDERS: I am delighted to report that 2002, by any measure, was the most success- ful year in the company’s history. Despite a difficult economic climate, every segment of your company met or exceeded its profitability objectives. Perhaps more important than short-term financial success, we acquired Tilia during the first half of 2002, the leading defined a long-term strategic direction for Jarden Corporation manufacturer and marketer of home vacuum packaging and prepared the foundation for a successful execution of systems under the FoodSaver® brand in North America. this strategy. Our strategy is clear and consistent; to build This acquisition was a natural extension of Jarden’s market a world class consumer products company that enjoys leading leading position in another area of home food preservation, market shares of niche markets for branded consumable home canning. The synergies between these two businesses products used in and around the home. We believe this have already led to cost efficiencies and increased strength in strategy has not only created a strong, vibrant platform from marketing, distribution and product development. In addition, which to grow, but also presents a compelling investment we believe our ability to complete a smooth and swift opportunity. The nature of niche markets means they are rela- integration plan for the FoodSaver® acquisition bodes well tively small with attractive operating margins and strong cash for future acquisition integrations. flows. These markets have often been neglected, providing the Established Platform for Growth opportunity for positive market trends from newly invigorat- The company’s transformation was highlighted by its name ed management with fresh and creative ideas. We believe that change to Jarden Corporation from Alltrista at the end of many of our niche branded consumable markets share similar May 2002. While the name change was largely symbolic, the distribution channels which can be leveraged to include new changes made since September 2001 have had a significant product introductions as well as more efficient customer positive impact on the morale of our employees. In a business service. A number of important milestones in implementing where we live by the mantra, “Our most important assets go our strategy were achieved in 2002. home every night,” we are particularly pleased that our Expanded into Home Vacuum Packaging management teams believe in, and are excited about, our Following the significant reorganization and deleveraging of long-term strategy to build a world class consumer products the company that took place in the fourth quarter of 2001, we company. I believe this rejuvenated spirit has pushed your
  • 5. Martin E. Franklin Chairman and 2002 SALES BY SEGMENT: Chief Executive Officer 39% Home Vacuum Packaging 31% Branded Consumables 19% Plastic Consumables 11% Other PG. 3 company’s people to excel, despite macro economic We have strengthened our management ranks in 2002, not challenges. To ensure the financial flexibility required for only in sales and marketing, but also in technology through future growth, your company entered into a newly syndicated the newly filled post of Chief Information Officer. In addition, $100 million senior credit facility and $150 million ten-year we have welcomed the addition of two experienced independent senior subordinated notes that provides a non-amortizing directors to our Board, Irwin Simon, Chairman of Hain- base of capital at favorable rates. These positive changes in Celestial Group, and René-Pierre Azria, Managing Director your company have resulted in a renewed interest in the of Rothschild Inc. Their insights have already proved equity of Jarden and should allow us to continue to increase valuable to the company. the long-term value we can deliver to our shareholders. Finally, all of the above has led to the start of recognition Acquired Diamond Brands on Wall Street. Two research houses initiated coverage of In November 2002, Jarden announced it had entered into a Jarden in 2002 and a third began coverage in January 2003. definitive asset purchase agreement to acquire the business of The company’s new strategic direction, as well as our strong Diamond Brands, which was completed during February 2003. financial results, helped Jarden’s shares rise by over 200% in Diamond Brands is a leading manufacturer and marketer of 2002, a performance that led to Jarden being listed as the niche consumer products for domestic use including kitchen number one performing stock in 2002 according to Investors matches, toothpicks, plastic cutlery, straws, clothespins and Business Daily. wooden crafts, sold primarily under the Diamond® and We are proud of your company’s performance in 2002. Much Forster® trademarks. Diamond Brands met our established of the credit is due to the 1,500 members of the Jarden team major acquisition criteria: leading market shares of niche and their outstanding efforts during 2002. We entered 2003 markets in branded consumables used in and around the with considerable momentum and I look forward to reporting home, established EBITDA margins in excess of 15% and a our progress to you as the year unfolds. purchase price allowing immediate accretion to earnings from the date of acquisition, before synergies. With the inclusion Yours sincerely, of Diamond Brands, we have surpassed our internal goal of generating over 90% of our total revenues from consumer products related businesses by the end of 2003. Invested in Organic Growth Martin E. Franklin To continue organic growth in our business we have allocated Chairman and significant incremental marketing funds in 2003 for launching Chief Executive Officer and promoting new product introductions. This effort has been led by our new Chief Marketing Officer, whose role is to define a strategy to drive organic growth across our consumer products businesses.
  • 6. Our Diamond® and Forster® branded retail plastic cutlery is available in a variety The Jammin’ Kit is designed as a fun, of different counts and sizes to suit the home-based, canning experience for Pickling is a popular home canning differing needs of our customers. the whole family. activity and this new kit makes it easy. PG. 4
  • 7. Our new “ultimate package” We offer a variety of different design will provide distribution Diamond® is the leading brand Our new Salsa Kit is 1 of 9 packaging and types of toothpicks and manufacturing efficiencies in kitchen matches and is a staple Fresh ‘N Fun kits we now offer. including the inventive Shake A while improving the product in many homes. Pick® product shown below. presentation to the consumer. PG. 5 BRANDED CONSUMABLES We manufacture, market and distribute a broad line of branded products that includes home canning jars, jar closures, plastic cutlery, kitchen matches, toothpicks, food preparation kits, craft items and Jack Metz (President, 2nd from right) with (from left to right) Roman Shumny (VP-Marketing), other accessories marketed under a portfolio of brands, Jim King (VP-Sales), Dave Tolbert (VP-HR & Admin) and Blair including the well-known Ball®, Bernardin®, Diamond®, Swogger (Chief Operating Officer). Forster®, Fruit Fresh® and Kerr® brand names. Several of our leading branded consumable products and craft stores. Our customers include Ace Hardware, such as Diamond® kitchen matches and Ball® jars have Albertson’s, Dollar General, Kroger, and Wal-Mart, been in continuous use for over 100 years. We have among others. long-standing relationships with a diverse group of Some of our marketing initiatives include in-store retail, wholesale and institutional customers in North coupons, strategically located display cases and the America. We sell through a wide variety of distribution new “ultimate package” for home canning jars. channels, including grocery stores, mass merchants, department stores, value retailers, hardware stores
  • 8. Our bags and bag rolls sold for use with the home vacuum packaging machines represent a recurring revenue source and a competitive advantage. We have created the home vacuum packaging category at most of our retailers and actively work with them to promote the FoodSaver® and home vacuum packaging to consumers. PG. 6
  • 9. PG. 7 H O M E V A C U U M PA C K A G I N G We are the leading provider of home vacuum packaging machines and accessories under the FoodSaver® brand. Our accessories include bags and bag rolls, canisters, jar sealers and wine stoppers. Linda Graebner (President) with Michael Whitcomb (Chief Marketing Officer) and David Brakes (Chief Operating Officer). We sell through a diverse group of leading wholesale Advertising and brand-building programs will and retail customers in North America and distributors extend beyond infomercials. We believe that new in selected international markets. We have successfully product innovation will increasingly capitalize on penetrated several traditional retail channels including consumer segmentation opportunities in vacuum mass merchants, warehouse clubs and specialty retailers packaging and in other food preservation categories. and also sell through direct-to-consumer channels, Our retail position is being reinforced by channel primarily infomercials. Our customers include Bed Bath marketing initiatives that optimize category volume and Beyond, Costco, Kohl's, Target and Wal-Mart, and profitability for retailers. Direct marketing among others. activities are being expanded to reinforce brand loyalty and sustained usage rates for bags and accessories. Our marketing department is implementing a strategy to drive sustained growth over the next few years.
  • 10. Refrigerator door liners and Consumer products packaging. Yorker® closures. other plastic parts. PG. 8 PLASTIC CONSUMABLES We manufacture, market and distribute a wide variety of plastic products for industrial and manufacturing customers including closures, contact lens packaging, refrigerator door liners, sport shooting ammunition components, surgical devices and syringes. Many of these products are consumable in nature We also supply plastic products and parts to both our or represent components of consumer products. branded consumables (plastic cutlery and closures) and home vacuum packaging (plastic containers) segments. We sell primarily to major companies in the healthcare and consumer products industries. Our We focus our sales and marketing efforts in those customers include CIBA Vision, Johnson & Johnson, markets that require high levels of precision, quality, Scotts, Whirlpool and Winchester, among others. and engineering expertise.
  • 11. Penny blanks are primarily made Zinc strip is produced An array of zinc strip products. of zinc and coated in copper. in our plant. PG. 9 OT H E R We are the largest producer of zinc strip and fabricated products in the United States. We are the sole source supplier of copper plated zinc penny blanks to both the United States Mint and the Royal Canadian Mint. In addition, we manufacture a line of industrial Our sales and marketing team consists of individuals zinc items used in the plumbing, automotive, electrical with considerable technical background in the field of component and European architectural markets. Our metallurgy, who focus on leveraging our core capabilities anti-corrosion zinc Lifejacket® is gaining recognition in zinc metallurgy and electrochemistry to capitalize on as a cost-effective solution to arrest the corrosion of new market opportunities. The sales and marketing staff the reinforcement steel within poured concrete work closely with our engineering and technical services structures (see image to the right). group to deliver products to the customer.
  • 12. Jarden Corporation Selected Financial Data The following table sets forth our selected financial data as of and for the years ended December 31, 2002, 2001, 2000, 1999 and 1998. The selected financial data set forth below has been derived from our audited consolidated financial statements and related notes for the respective fiscal years. The selected financial data should be read in conjunction with ‘‘Management’s Discussion and Analysis of Financial Condition and Results of Operations’’ as well as our consolidated financial statements and notes thereto. These historical results are not necessarily indicative of the results to be expected in the future. For the year ended December 31, 2002 2001 2000 1999 1998 (a) (b) (c) (d) (e) (f) (in thousands, except per share data) STATEMENT OF OPERATIONS DATA: Net sales . . . . . . . . . . . . . . . . . . . . . . . . . . $368,199 $ 304,978 $357,356 $358,031 $258,489 Costs and expenses: Cost of sales . . . . . . . . . . . . . . . . . . . . . 216,629 232,634 274,248 256,201 187,295 Selling, general and administrative expenses . . . . . . . . . . . . . . . . . . . . . . 86,461 53,254 57,342 56,429 38,331 10 PG. Goodwill amortization . . . . . . . . . . . . — 5,153 6,404 4,605 1,399 Special charges (credits) and reorganization expenses (g) . . . . . . — 4,978 380 2,314 1,260 Loss (gain) on divestiture of assets and product lines. . . . . . . . . . . . . . . — 122,887 — (19,678) — Operating income (loss) . . . . . . . . . . . . . 65,109 (113,928) 18,982 58,160 30,204 Interest expense, net . . . . . . . . . . . . . . . . 12,611 11,791 11,917 8,395 1,822 Income tax provision (benefit) . . . . . . . . 16,189 (40,443) 2,402 19,458 10,785 Minority interest in gain (loss) of consolidated subsidiary . . . . . . . . . . . — 153 (259) — — Income (loss) from continuing operations . . . . . . . . . . . . . . . . . . . . . . 36,309 (85,429) 4,922 30,307 17,597 Loss from discontinued operations . . . . — — — (87) (1,870) Extraordinary loss from early extinguishment of debt (net of income taxes) . . . . . . . . . . . . . . . . . . . — — — (1,028) — Net income (loss) . . . . . . . . . . . . . . . . . . . $ 36,309 $ (85,429) $ 4,922 $ 29,192 $ 15,727 Basic earnings (loss) per share (h): Income (loss) from continuing operations . . . . . . . . . . . . . . . . . . . . . . $ 2.60 $ (6.71) $ 0.39 $ 2.25 $ 1.24 Loss from discontinued operations . . . . — — — (.01) (.13) Extraordinary loss from early extinguishment of debt (net of income taxes) . . . . . . . . . . . . . . . . . . . — — — (.07) — $ 2.60 $ (6.71) $ 0.39 $ 2.17 $ 1.11 Diluted earnings (loss) per share (h): Income (loss) from continuing operations . . . . . . . . . . . . . . . . . . . . . . $ 2.52 $ (6.71) $ 0.39 $ 2.22 $ 1.22 Loss from discontinued operations . . . . — — — (.01) (.13) Extraordinary loss from early extinguishment of debt (net of income taxes) . . . . . . . . . . . . . . . . . . . — — — (.07) — $ 2.52 $ (6.71) $ 0.39 $ 2.14 $ 1.09
  • 13. Jarden Corporation Selected Financial Data (Continued) As of and for the year ended December 31, 2002 2001 2000 1999 1998 (a) (b) (c) (d) (e) (f) (in thousands) OTHER FINANCIAL DATA: EBITDA (i) . . . . . . . . . . . . . . . . . . . . . . . . $ 75,110 $ 32,734 $ 40,673 $ 58,493 $ 42,012 Cash flows from operations . . . . . . . . . . 69,551 39,857 19,144 22,324 27,388 Depreciation and amortization . . . . . . . 10,001 18,797 21,311 17,697 10,548 Capital expenditures . . . . . . . . . . . . . . . . 9,277 9,707 13,637 16,628 11,909 BALANCE SHEET DATA: Cash and cash equivalents . . . . . . . . . . . $ 56,779 $ 6,376 $ 3,303 $ 17,394 $ 21,454 Working capital . . . . . . . . . . . . . . . . . . . . 101,557 8,035 22,975 54,611 46,923 Total assets . . . . . . . . . . . . . . . . . . . . . . . 366,765 162,234 310,429 340,364 166,974 Total debt . . . . . . . . . . . . . . . . . . . . . . . . . 216,955 84,875 137,060 140,761 25,715 11 PG. Total stockholders’ equity . . . . . . . . . . . . 76,764 35,129 118,221 123,025 94,893 (a) The results of Tilia are included from April 1, 2002. (b) 2002 includes a net release of a $4.4 million tax valuation allowance. Adjusting for the net release of the valuation allowance, the Company’s diluted earnings per share for 2002 would have been $2.22. (c) 2001 includes a $121.1 million pretax loss on the sale of thermoforming assets, a $2.3 million pretax charge associated with corporate restructuring, a $1.4 million pretax loss on the sale of the Company’s interest in Microlin, LLC, $2.6 million of pretax separation costs related to the management reorganization, $1.4 million of pretax costs to evaluate strategic options, $1.4 million of pretax costs to exit facilities, a $2.4 million pretax charge for stock option compensation, $4.1 million of pretax income associated with the discharge of deferred compensation obligations and a $1.0 million pretax gain related to an insurance recovery. (d) 2000 includes $1.6 million of pretax income associated with the reduction in long-term performance-based compensation, $1.4 million in pretax litigation charges, net of recoveries and $0.6 million of pretax costs to evaluate strategic options. (e) 1999 includes a $19.7 million pretax gain on the sale of the plastic packaging product line and a $2.3 million pretax charge to exit a plastic thermoforming facility. (f) 1998 includes a $1.3 million pretax charge to exit a plastic injection molding facility. (g) Special charges (credits) and reorganization expenses were comprised of costs to evaluate strategic options, discharge of deferred compensation obligations, separation costs for former officers, stock option compensation, corporate restructuring costs, costs to exit facilities, reduction of long-term performance based compensation, litigation charges and items related to our divested thermoforming operations. (h) All earnings per share amounts have been adjusted to give effect to a 2-for-1 split of our outstanding shares of common stock that was effected during the second quarter of 2002. (i) ‘‘EBITDA’’ is calculated as operating income (loss) plus (i) depreciation and amortization, (ii) special charges (credits) and reorganization expenses and (iii) loss (gain) on divestiture of assets and product lines. EBITDA is not intended to represent cash flow from operations as defined by accounting principles generally accepted in the United States and should not be used as an alternative to net income as an indicator of operating performance or to cash flow as a measure of liquidity. EBITDA is included in this Form 10-K because it is a basis upon which our management assesses financial performance. While EBITDA is frequently used as a measure of operations and the ability to meet debt service requirements, it is not necessarily comparable to other similarly titled captions of other companies due to potential inconsistencies in the method of calculation. Quarterly Stock Prices The table below sets forth the high and low sales prices of our common stock as reported on the New York Stock Exchange for the periods indicated. All prices have been adjusted to reflect the 2-for-1 stock split that occurred during the second quarter of 2002: First Second Third Fourth Quarter Quarter Quarter Quarter 2002 High . . . . . . . . . . . . . . . . . . . . . . . . . . . . . . . . . . . . . . . $15.00 $19.96 $27.46 $27.70 Low . . . . . . . . . . . . . . . . . . . . . . . . . . . . . . . . . . . . . . . $ 7.57 $13.25 $18.35 $20.00 2001 High . . . . . . . . . . . . . . . . . . . . . . . . . . . . . . . . . . . . . . . $ 7.56 $ 8.07 $ 6.51 $ 8.02 Low . . . . . . . . . . . . . . . . . . . . . . . . . . . . . . . . . . . . . . . $ 6.15 $ 5.82 $ 5.35 $ 5.65
  • 14. Jarden Corporation Management’s Discussion and Analysis We are a leading provider of niche, branded consumer products used in the home, under leading brand names including Ball , Bernardin , Diamond , FoodSaver , Forster and Kerr . In North America, we are the market leader in several targeted categories, including home canning, branded retail plastic cutlery, kitchen matches, toothpicks and home vacuum packaging. We have grown by actively acquiring new brands and expanding our existing brands. Our strategy to achieve future growth is to acquire new brands, sustain profitable internal growth and expand our international business. On April 24, 2002, we completed our acquisition of the business of Tilia International, Inc. and its subsidiaries (collectively ‘‘Tilia’’), pursuant to an asset purchase agreement (the ‘‘Acquisition’’). Based in San Francisco, California, Tilia was a developer, manufacturer and marketer of a patented vacuum packaging system for home use, primarily for food storage, under the FoodSaver brand. The Acquisition was entered into as part of our plan to pursue growth in branded consumer products. We acquired the business of Tilia for approximately $145 million in cash and $15 million in seller debt financing. In addition, the Acquisition includes an earn-out provision with a potential payment in cash or our common stock of up to $25 million payable in 2005, provided that certain earnings performance targets are met. In conjunction with the 12 PG. Acquisition, we incurred expenses in the amount of approximately $4.5 million. Due to the Company having effective control of the business of Tilia as of April 1, 2002, the results of Tilia have been included in the Company’s results from such date. Effective November 26, 2001, we sold the assets of our Triangle, TriEnda and Synergy World plastic thermoforming operations (‘‘TPD Assets’’) to Wilbert, Inc. for $21.0 million in cash, a non-interest bearing one-year note (‘‘Wilbert Note’’) as well as the assumption of certain identified liabilities. The carrying amount on the Wilbert Note of $1.6 million was repaid on November 25, 2002. In connection with this sale, we recorded a pre-tax loss of approximately $121.1 million in 2001. The proceeds from the sale were used to pay down the Company’s term debt under its old credit agreement. Effective November 1, 2001, we sold our majority interest in Microlin, LLC (‘‘Microlin’’), a developer of proprietary battery and fluid delivery technology, for $1,000 in cash plus contingent consideration based upon future performance through December 31, 2012 and the cancellation of future funding requirements. We recorded a pretax loss of $1.4 million in 2001 related to the sale. Pro forma financial information relating to the Acquisition and the sales of TPD Assets and Microlin has been included in the notes to our consolidated financial statements. On September 24, 2001, our board of directors appointed Martin E. Franklin as our Chairman and Chief Executive Officer and Ian G.H. Ashken as our Vice Chairman, Chief Financial Officer and Secretary. Following this appointment we undertook a new business and management strategy to concentrate on niche, branded consumer products, which led to the sale of the TPD Assets and the Acquisition. During 2002, we revised our business segment information to report four business segments: branded consumables, home vacuum packaging, plastic consumables and other. Prior periods have been reclassified to conform to the current segment definitions. Results of Operations – Comparing 2002 to 2001 We reported net sales of $368.2 million in 2002, an increase of 20.7% from net sales of $305.0 million in 2001. From April 1, 2002 onwards, our home vacuum packaging segment, which consists of the newly acquired Tilia business, generated net sales of $145.3 million. Our branded consumables segment reported net sales of $112.3 million in 2002 compared to $120.6 million in 2001. Net sales were $8.3 million or 6.9% lower than 2001, principally due to severe drought weather conditions during summer 2002 in the South, Southeast and West Central regions of the United States. Our plastic consumables segment reported net sales of $70.6 million in 2002 compared to $139.9 million in 2001. The principal cause of the $69.3 million decrease was the divestiture of the TPD Assets and Microlin, which accounted for $63.3 million of such change (after adjusting for $1.2 million of intercompany sales to these businesses). The remaining $6.0 million is principally due to
  • 15. Jarden Corporation Management’s Discussion and Analysis (Continued) lower tooling sales and a contractual sales price reduction to a significant customer. In the other segment, net sales decreased to $41.0 million in 2002 from $45.5 million in 2001, primarily due to reduced sales to the United States Mint in connection with its inventory reduction program for all coinage. We reported operating income of $65.1 million for 2002. These results compare to an operating loss of $113.9 million for 2001, which included special charges (credits) and reorganization expenses of $5.0 million and a loss on divestitures of assets and product lines of $122.9 million. All of our segments generated increases in operating income in 2002 from 2001, with the exception of the other segment, which had a small decrease but still maintained a constant operating income percentage of net sales in 2002. From April 1, 2002 onwards, our home vacuum packaging segment, which consists of the newly acquired Tilia business, generated operating income of $31.7 million. Operating income for our branded consumables and plastic consumables segments increased by $4.7 million and $14.4 million, respectively, in 2002 compared to 2001. The other factors that contributed to these favorable operating income results are discussed in the following two paragraphs. Gross margin percentages on a consolidated basis increased to 41.2% in 2002 from 23.7% in 2001, reflecting the higher gross margins of the acquired home vacuum packaging business in 2002, the lower gross margins of the disposed TPD Assets and Microlin businesses in 2001, a $1.5 million charge for slow moving 13 PG. inventory in the branded consumables segment in 2001 and cost efficiency increases in our plastic consumables segment. These increases were partially offset by lower gross margins in the branded consumables segment caused by the lower sales volume. Selling, general and administrative expenses increased to $86.5 million in 2002 from $53.3 million in 2001, or, as a percentage of net sales increased to 23.5% in 2002 from 17.5% in 2001. This increase was principally due to the acquisition of the home vacuum packaging business, which accounted for an additional $46.3 million of selling, general and administrative expenses, and because of company-wide increased performance-based compensation expenses related to our strong financial performance in 2002. Partially offsetting this were decreases in selling, general and administrative expenses in our branded consumables, plastic consumables and other segments. Expenses within the branded consumables segment decreased due to lower selling expenses associated with the decrease in net sales discussed above. Expenses within our plastic consumables segment decreased primarily due to the divestiture of TPD Assets and Microlin, which accounted for $11.7 million of this decline, and lower expenses in the remaining business of the segment. We incurred net special charges (credits) and reorganization expenses of $5.0 million in 2001, consisting of $0.8 million in costs to exit facilities, $2.4 million in stock option compensation, $2.3 million in corporate restructuring costs, $2.6 million in separation costs for former executive officers and $1.4 million of costs to evaluate strategic options, partially offset by $4.1 million in pre-tax income related to the discharge of certain deferred compensation obligations and $0.4 million of income for items related to the divested TPD Assets. As a result of the adoption of SFAS No. 142, we did not record goodwill amortization in 2002. Goodwill amortization of approximately $5.2 million had been recorded in 2001. Net interest expense in 2002 was $12.6 million compared to $11.8 million for 2001, primarily due to the additional indebtedness assumed pursuant to the Acquisition, partially offset by the write-off in 2001 of $1.5 million of previously deferred debt issuance costs in November 2001 in conjunction with the amendment to our credit facility effected in connection with the TPD Assets sale. During 2002, we had a lower weighted average interest rate than the prior year, which was more than offset by higher average borrowings outstanding. Our effective tax rate was 30.8% in 2002 compared to 32.2% in 2001. At December 31, 2001, we had federal net operating losses that were recorded as a deferred tax asset with a valuation allowance of $5.4 million. Due to the impact of the Job Creation Act and the tax refunds that we received as a result, a net $4.4 million of this valuation allowance was released in 2002 resulting in an income tax provision of $16.2 million. Our net income for 2002 would have been $31.9 million or $2.22 diluted earnings per share if this valuation allowance release was excluded. Excluding the release of this valuation allowance, our effective tax rate was approximately 39.2% in 2002. The effective tax rate in 2001 was lower than the statutory federal rate due to the valuation allowance described above.
  • 16. Jarden Corporation Management’s Discussion and Analysis (Continued) Results of Operations – Comparing 2001 to 2000 We reported consolidated net sales of $305.0 million in 2001, a decrease of 14.7% from net sales of $357.4 million in 2000. Net sales of the branded consumables segment were $120.6 million in 2001 compared to $120.4 million in 2000. Increased sales in the United States were offset by decreased sales in Canada due to unfavorable weather conditions and customers carrying higher levels of inventory over from 2000. Net sales within the plastic consumables segment were $139.9 million in 2001 compared to $179.3 million in 2000. The decrease of $39.4 million or 22.0% was due primarily to (i) lower demand for industrial thermoformed parts (part of the divested TPD Assets) in the heavy truck and material handling markets, and (ii) the fact that 2001 did not include December sales for the divested TPD Assets. Net sales of the other segment decreased to $45.5 million in 2001 from $58.8 million in 2000. This decrease of $13.3 million or 22.6% resulted from lower demand in all of our zinc product lines. Our operating loss for 2001 was $113.9 million, including special charges (credits) and reorganization expenses of $5.0 million and a total loss on divestitures of assets and product lines of $122.9 million. These results compare to operating income for 2000 of $19.0 million. The factors that contributed to these results are discussed in the following two paragraphs. 14 PG. Gross margin percentages increased to 23.7% in 2001 from 23.3% in 2000. Gross margin percentages increased for branded consumables due primarily to cost efficiencies which continued during 2001 as the benefits of the segment’s SAP system implementation continued to be realized. The plastic consumables segment gross margin percentages declined from 16% in 2000 to 13% in 2001. This decrease in gross margin percentage was due primarily to (i) lower sales of plastic thermoformed parts (part of the divested TPD Assets) resulting in diminished operating efficiencies, and (ii) lower sales volumes causing fixed overhead costs to be allocated to less sales of injection molded plastic parts. There was an increase in the other segment’s gross margin percentages from 28% in 2000 to 29% in 2001. Selling, general and administrative expenses decreased 7.1% to $53.3 million in 2001 from $57.3 million in 2000, or, as a percentage of sales increased to 17.5% in 2001 from 16.0% in 2000. Branded consumables expenses decreased primarily due to lower expenses associated with sales and marketing, warehousing and shipping. Expenses within the plastic consumables segment decreased primarily as a result of the cost savings realized due to a third quarter 2000 realignment and consolidation of our divested TPD Assets and the fact that 2001 did not include December expenses for the divested TPD Assets. Excluding the TPD Assets, selling, general and administrative expenses in the remainder of the plastic consumables segment and the other segment remained relatively constant. Goodwill amortization decreased from $6.4 million in 2000 to $5.2 million in 2001 due primarily to our November 2001 sale of the TPD Assets included in the plastic consumables segment. We incurred net special charges (credits) and reorganization expenses of $5.0 million in 2001, consisting of $0.8 million in costs to exit facilities, $2.4 million in stock option compensation, $2.3 million in corporate restructuring costs, $2.6 million in separation costs for former executive officers and $1.4 million of costs to evaluate strategic options, partially offset by $4.1 million in pre-tax income related to the discharge of certain deferred compensation obligations and $0.4 million of income for items related to the divested TPD Assets. Net interest expense in 2001 was $11.8 million compared to $11.9 million for 2000. The effects of lower average borrowings outstanding and lower interest rates during 2001 were offset by the write-off of $1.5 million of previously deferred debt issuance costs in November 2001 in conjunction with the amendment to our credit facility effected in connection with the sale of TPD Assets. Our effective interest rate for the year ended December 31, 2001 was 7.7%. As a result of decreasing interest rates during 2001, our interest rate swaps, which were at a fixed interest rate of 5.7%, resulted in additional interest expense to us during the year ended December 31, 2001. Our effective tax rate was 32.2% for 2001 compared to 34.0% for 2000. The effective rate for 2001 is lower than the statutory federal rate primarily because it includes a valuation allowance for tax benefits associated with the loss on the sale of the TPD Assets. The effective rate for 2000 reflects the recognition of a tax benefit from exiting the Central European home canning test market.
  • 17. Jarden Corporation Management’s Discussion and Analysis (Continued) Financial Condition, Liquidity and Capital Resources During 2002, we made the following changes to our capital resources in connection with the financing of the Acquisition: completed an offering of $150 million of 93⁄4% senior subordinated notes (‘‘Notes’’) to qualified institutional buyers in a private placement pursuant to Rule 144A under the Securities Act of 1933, which were later wholly exchanged pursuant to an offering for 93⁄4% senior subordinated notes which are registered under the Securities Act of 1933, as amended (‘‘New Notes’’); in conjunction with the Notes, entered into a $75 million interest rate swap to receive a fixed rate of interest and pay a variable rate of interest based upon LIBOR; refinanced our existing indebtedness with a new $100 million five-year senior secured credit facility, which included a $50 million term loan facility and a $50 million revolving credit facility (‘‘New Credit Agreement’’); and entered into $15 million of seller debt financing. 15 PG. The Notes were issued at a discount such that we received approximately $147.7 million in net proceeds. The Notes will mature on May 1, 2012, however, on or after May 1, 2007, we may redeem all or part of the Notes at any time at a redemption price ranging from 100% to 104.875% of the principal amount, plus accrued and unpaid interest and liquidated damages, if any. Prior to May 1, 2005, we may redeem up to 35% of the aggregate principal amount of the Notes with the net cash proceeds from certain public equity offerings at a redemption price of 109.75% of the principal amount, plus accrued and unpaid interest and liquidated damages, if any. Interest on the Notes accrues at the rate of 9.75% per annum and is payable semi-annually in arrears on May 1 and November 1, with the first payment having occurred on November 1, 2002. During December 2002, the Company completed an offering to the holders of the Notes to exchange the Notes for the New Notes. The New Notes are substantially similar to the Notes except that certain mandatory redemption provisions and the transfer restrictions applicable to the Notes are not applicable to the New Notes. In conjunction with the Notes, on April 24, 2002, we entered into a $75 million interest rate swap (‘‘Initial Swap’’) to receive a fixed rate of interest and pay a variable rate of interest based upon LIBOR. The Initial Swap had a maturity date that was the same as the Notes. Interest was payable semi-annually in arrears on May 1 and November 1, commencing on November 1, 2002. The initial effective rate of interest that we established on this swap was 6.05%. This contract was considered to be an effective hedge against changes in the fair value of our fixed-rate debt obligation for both tax and accounting purposes. Effective September 12, 2002, we entered into an agreement, whereby we unwound the Initial Swap and contemporaneously entered into a new $75 million interest rate swap (‘‘Replacement Swap’’). The Replacement Swap has the same terms as the Initial Swap, except that we will pay a variable rate of interest based upon 6 month LIBOR in arrears. The spread on this contract is 470 basis points. Based upon this contract, we paid an effective interest rate of 6.32% on November 1, 2002. In return for unwinding the Initial Swap, we received $5.4 million in cash proceeds, of which $1 million related to accrued interest that was owed to us. The remaining $4.4 million of proceeds will be amortized over the remaining life of the Notes as a credit to interest expense and is included in our consolidated balance sheet as an increase to the value of the long-term debt. Such amortization amount offsets the increased effective rate of interest that we pay on the Replacement Swap. We have continued to accrue interest on the Replacement Swap at a 6.32% effective rate for the remainder of 2002. The Replacement Swap is also considered to be an effective hedge against changes in the fair value of our fixed-rate debt obligation for both tax and accounting purposes. The fair market value of the interest rate swap as of December 31, 2002 was approximately $2.4 million and is included as an asset within other assets in the consolidated balance sheet, with a corresponding offset to long-term debt. We are exposed to credit loss in the event of non-performance by the other party to the Replacement Swap, a large financial institution, however, we do not anticipate non-performance by the other party.
  • 18. Jarden Corporation Management’s Discussion and Analysis (Continued) The New Credit Agreement matures on April 24, 2007. The revolving credit facility and the term loan facility bear interest at a rate equal to (i) the Eurodollar Rate pursuant to an agreed formula or (ii) a Base Rate equal to the higher of (a) the Bank of America prime rate and (b) the federal funds rate plus .50%, plus, in each case, an applicable margin ranging from 2.00% to 2.75% for Eurodollar Rate loans and from .75% to 1.5% for Base Rate loans. The New Credit Agreement contains certain restrictions on the conduct of our business, including, among other things restrictions, generally, on: incurring debt; making investments; exceeding certain agreed upon capital expenditures; creating or suffering liens; completing certain mergers; consolidations and sales of assets and, with permitted exceptions, acquisitions; 16 PG. declaring dividends; redeeming or prepaying other debt; and certain transactions with affiliates. The New Credit Agreement also requires us to maintain certain financial covenants. During 2002, we incurred costs in connection with the issuance of the Notes, the New Notes and the New Credit Agreement of approximately $7.4 million. The seller debt financing for the Acquisition consists of a non-interest bearing note in the principal amount of $10 million that is due on March 31, 2003 and a note in the principal amount of $5 million, bearing interest at 5%, which is due on April 24, 2004. For accounting purposes, we have imputed an interest rate of 5% on the $10 million non-interest bearing note. Until it was replaced by the New Credit Agreement on April 24, 2002, our senior credit facility, as amended (‘‘Old Credit Agreement’’), provided for a revolving credit facility of $40 million and a term loan which amortized periodically as required by the terms of the agreement. Interest on borrowings under the Old Credit Agreement’s term loan and the revolving credit facilities were based upon fixed increments over adjusted LIBOR or the agent bank’s alternate borrowing rate as defined in the agreement. The agreement also required the payment of commitment fees on the unused balance. During the first quarter of 2002, approximately $38 million of tax refunds we received were used to repay a portion of the outstanding amounts under the Old Credit Agreement. In May 1999, we entered into a three-year interest rate swap with an initial notional value of $90 million. The swap effectively fixed the interest rate on approximately 60% of our term debt at a maximum rate of 7.98% for the three-year period. The swap matured and was terminated in March 2002. As of December 31, 2002, we had $47.5 million outstanding under the term loan facility of the New Credit Agreement, with a weighted average interest rate of 4.3%. As of December 31, 2002, we had not drawn down any of the $50 million available under the revolving credit facility of the New Credit Agreement, although we have used approximately $4.2 million of availability for the issuance of letters of credit. See ‘‘Recent Developments’’ below, for a discussion of the recent amendment to our New Credit Agreement. As a result of the losses arising from the sale of the TPD Assets, we recovered in January 2002 approximately $15.7 million of federal income taxes paid in 1999 and 2000 by utilizing the carryback of a tax net operating loss generated in 2001. On March 9, 2002, The Job Creation and Workers Assistance Act of 2002 was enacted which provides, in part, for the carryback of 2001 net operating losses for five years instead of the previous two year period. As a result, we filed for an additional refund of $22.8 million, of which $22.2 million was received in March 2002 and the remainder was received in April 2002.
  • 19. Jarden Corporation Management’s Discussion and Analysis (Continued) Working capital (defined as current assets less current liabilities) increased to approximately $101.6 million at December 31, 2002 from approximately $8.0 million at December 31, 2001 due primarily to: the working capital of the acquired home vacuum packaging business; a lower amount of current portion of debt and increased cash on hand amounts caused by our favorable operating results and the new financing relationships discussed above; and the receipt of $22.3 million of tax refunds which had not been included in working capital in 2001. Cash flow generated from operations, excluding net income tax refunds was approximately $31.0 million for the year ended December 31, 2002. Capital expenditures were $9.3 million in 2002 compared to $9.7 million for 2001 and are largely related to maintaining facilities, tooling projects, improving manufacturing efficiencies and a portion of the costs of the installation of new packaging lines for the branded consumables segment. As of December 31, 2002, we had capital expenditure commitments in the aggregate for all our segments of approximately $3.9 million, of which $2.5 million relates to the completion of the new packaging lines for the branded consumables segment. As of December 31, 2002, our home vacuum packaging segment had committed to purchase $18.5 million of 17 PG. inventory from various vendors in the year 2003. Additionally, as of December 31, 2002, our other segment had forward buy contracts for 2003 to purchase zinc ingots in the aggregate amount of approximately $2.5 million, which are expected to be used in operations in 2003. We believe that cash generated from our operations and our availability under our senior credit facility, are adequate to satisfy our working capital and capital expenditure requirements for the foreseeable future. However, we may raise additional capital from time to time to take advantage of favorable conditions in the capital markets or in connection with our corporate development activities. The following table includes aggregate information about our contractual obligations as of December 31, 2002 and the periods in which payments are due. Certain of these amounts are not required to be included in our consolidated balance sheet: Payments due by period (in millions) Less than 1-3 4-5 After Total 1 Year Years Years 5 Years Debt (1) $212.5 $ 16.3 $ 25.0 $ 21.2 $150.0 Operating Leases 16.1 5.6 8.4 2.1 — Unconditional Purchase Obligations 24.9 24.9 — — — Other Non-current Obligations 2.8 1.8 1.0 — — Total Contractual Cash Obligations $256.3 $ 48.6 $ 34.4 $ 23.3 $150.0 (1) The debt amounts are based on the principal payments that will be due upon their maturity and exclude approximately $6.6 million of non-debt balances arising from the interest rate swap transactions described in the notes to our consolidated financial statements. Commercial commitments are items that we could be obligated to pay in the future: As of December 31, 2002, we had $4.2 million in standby and commercial letters of credit that all expire in 2003; In connection with the Acquisition, we may be obligated to pay an earn-out in cash or our common stock of up to $25 million in 2005, provided that certain earnings performance targets are met; and In connection with a contract we have entered into to acquire additional intellectual property, we may be obligated to pay up to $7.5 million between 2003 and 2009, providing certain contractual obligations, including the issuance of patents amongst other things, are satisfied. These amounts are not required to be included in our consolidated balance sheet.
  • 20. Jarden Corporation Management’s Discussion and Analysis (Continued) Recent Developments In January 2003, we filed a shelf registration statement, which was declared effective by the Securities and Exchange Commission (the ‘‘Commission’’) on January 31, 2003. This shelf registration statement is intended to facilitate our access to growth capital for future acquisitions and allows us to sell over time up to $150 million of common stock, preferred stock, warrants, debt securities, or any combination of these securities in one or more separate offerings in amounts, at prices and on terms to be determined at the time of the sale. On February 7, 2003, we completed our acquisition of the business of Diamond Brands, Incorporated, and its subsidiaries (‘‘Diamond Brands’’), a manufacturer and distributor of kitchen matches, toothpicks and retail plastic cutlery under the Diamond® and Forster® trademarks, pursuant to an asset purchase agreement. The purchase price of this transaction was approximately $86 million in cash, net of cash on hand at Diamond Brands, paid at closing and a deferred payment in the amount of $6 million payable in cash or our common stock, at our election, on or before August 7, 2003. In connection with this acquisition, we amended our New Credit Agreement, increasing our term loan facility by $10 million and our revolving loan facility by $20 million. We used cash on hand and draw downs under our debt facilities to finance the transaction. As of December 31, 2002, approximately $1.5 million for an escrow deposit and expenses related to the Diamond 18 PG. Brands acquisition had been capitalized and included in our balance sheet. Following this acquisition and the effectiveness of our amendment, we had outstanding $57.5 million under our term loan facility and $14 million under our revolving credit facility. After taking account of the outstanding amount and issued letters of credit, we had approximately $45.8 million of availability remaining under the revolving credit agreement. Critical Accounting Policies Our financial statements are prepared in accordance with accounting principles generally accepted in the United States, which require us to make judgments, estimates and assumptions that affect the amounts reported in the financial statements and accompanying notes. The following list of critical accounting policies is not intended to be a comprehensive list of all our accounting policies. Our significant accounting policies are more fully described in the notes to our consolidated financial statements. The following represents a summary of our critical accounting policies, defined as those policies that we believe are the most important to the portrayal of our financial condition and results of operations, and/or require management’s significant judgments and estimates: Revenue recognition and product returns We recognize revenue when title transfers. In most cases, title transfers at the time product is shipped to customers. We allow customers to return defective or damaged products as well as certain other products for credit, replacement, or exchange. Our revenue is recognized as the net amount to be received after deducting estimated amounts for product returns, discounts, and allowances. We estimate future product returns based upon historical return rates and our judgment. If these estimates do not properly reflect future returns, they could be revised. Accounts receivable We maintain an allowance for doubtful accounts for estimated losses that may result from the inability of our customers to make required payments. If the financial condition of our customers were to deteriorate or our judgment regarding their financial condition was to change negatively, additional allowances may be required resulting in a charge to income in the period such determination was made. Conversely, if the financial condition of our customers were to improve or our judgment regarding their financial condition was to change positively, a reduction in the allowances may be required resulting in an increase in income in the period such determination was made. Inventory We write down our inventory for estimated obsolescence or unmarketable inventory equal to the difference between the cost of the inventory and the estimated market value based upon assumptions about
  • 21. Jarden Corporation Management’s Discussion and Analysis (Continued) future demand and market conditions. If actual market conditions are less favorable than those projected by us, additional inventory write-downs may be required resulting in a charge to income in the period such determination was made. Conversely, if actual market conditions are more favorable than those projected by us, a reduction in the write down may be required resulting in an increase in income in the period such determination was made. Deferred tax assets We record a valuation allowance to reduce our deferred tax assets to the amount that we believe is more likely than not to be realized. While we have considered future taxable income and ongoing prudent and feasible tax planning strategies in assessing the need for the valuation allowance, in the event we were to determine that we would not be able to realize all or part of our net deferred tax assets in the future, an adjustment to the deferred tax assets would be charged to income in the period such determination was made. Likewise, should we determine that we would be able to realize our deferred tax assets in the future in excess of our net recorded amount, an adjustment to the deferred tax assets would increase income in the period such determination was made. 19 PG. Intangible assets We have significant intangible assets on our balance sheet that include goodwill, trademarks and other intangibles fair valued in conjunction with acquisitions. The valuation and classification of these assets and the assignment of amortizable lives involves significant judgments and the use of estimates. The testing of these intangibles under established guidelines for impairment also requires significant use of judgment and assumptions. Our assets are tested and reviewed for impairment on an ongoing basis under the established accounting guidelines. Changes in business conditions could potentially require adjustments to these asset valuations. Contingencies We are involved in various legal disputes in the ordinary course of business. In addition, the Environ- mental Protection Agency has designated our Company as a potentially responsible party, along with numerous other companies, for the clean up of several hazardous waste sites. Based on currently available information, we do not believe that the disposition of any of the legal or environmental disputes our Company is currently involved in will require material capital or operating expenditures or will otherwise have a material adverse effect upon the financial condition, results of operations, cash flows or competitive position of our Company. It is possible, that as additional information becomes available, the impact on our Company of an adverse determination could have a different effect. New Accounting Pronouncements In July 2001, the Financial Accounting Standards Board (‘‘FASB’’) issued Statements of Financial Accounting Standards (‘‘SFAS’’) No. 141, Business Combinations, and No. 142, Goodwill and Other Intangible Assets, effective for fiscal years beginning after December 15, 2001. Under the new rules, goodwill and intangible assets deemed to have indefinite lives are no longer amortized, but are subject to annual impairment tests in accordance with the statements. Other intangible assets continue to be amortized over their useful lives. We applied the new rules on accounting for goodwill and other intangible assets beginning in the first quarter of 2002. We have performed the required tests of goodwill and indefinite lived intangible assets and, based on the results, have not recorded any charges related to the adoption of and subsequent conformity with SFAS No. 142. In 2001 and 2000, we recorded goodwill amortization of $5.2 million and $6.4 million, respectively. The adoption of SFAS No. 141 did not have a material impact on our results of operations or financial position. In August 2001, the FASB issued SFAS No. 144, Accounting for the Impairment or Disposal of Long-Lived Assets, effective for fiscal years beginning after December 15, 2001. This standard superceded Statement of Financial Accounting Standard No. 121, Accounting for the Impairment of Long-Lived Assets and for Long-Lived Assets to Be Disposed Of, and provided a single accounting model for long-lived assets to be
  • 22. Jarden Corporation Management’s Discussion and Analysis (Continued) disposed of. The new standard also superceded the provisions of APB Opinion No. 30 with regard to reporting the effects of a disposal of a segment of a business and required expected future operating losses from discontinued operations to be displayed in discontinued operations in the period(s) in which the losses are incurred. SFAS No. 144 was effective for our business beginning with the first quarter of 2002 and its adoption did not have a material impact on our results of operations or financial position. In April 2002, the FASB issued SFAS No. 145, Recision of SFAS Nos. 4, 44 and 64, Amendment of SFAS No. 13, and Technical Corrections as of April 2000. SFAS No. 145 revises the criteria for classifying the extinguishment of debt as extraordinary and the accounting treatment of certain lease modifications. SFAS No. 145 is effective in fiscal 2003 and we do not expect it to have a material impact on our consolidated financial statements. In 2003, we will conform with the requirements of SFAS No. 145 in our Selected Financial Data disclosure in connection with our early extinguishment of debt that occurred in 1999. In July 2002, the FASB issued SFAS No. 146, Accounting for Costs Associated with Exit or Disposal Activities. SFAS No. 146 provides guidance on the timing of the recognition of costs associated with exit or disposal activities. The new guidance requires costs associated with exit or disposal activities to be recognized when incurred. Previous guidance required recognition of costs at the date of commitment to an exit or disposal 20 PG. plan. The provisions of the statement are to be adopted prospectively for exit activities after December 31, 2002. Although SFAS No. 146 may impact the accounting for costs related to exit or disposal activities that we may enter into in the future, particularly the timing of recognition of these costs, the adoption of the statement will not have an impact on our present financial condition or results of operations. In December 2002, the FASB issued SFAS No. 148, Accounting for Stock-Based Compensation – Transition and Disclosure. SFAS No. 148 amends SFAS No. 123, Accounting for Stock-Based Compensation, to provide alternative methods of transition for a voluntary change to the fair value based methods of accounting for stock-based employee compensation. In addition, SFAS No. 148 amends the disclosure requirements of SFAS No. 123 to require more prominent disclosures in both annual and interim financial statements about the method of accounting for stock-based employee compensation and the effect of the method used on reported results. The additional disclosure requirements of SFAS No. 148 are effective for fiscal years ending after December 15, 2002. As provided for in SFAS No. 148, we have elected to continue to follow the intrinsic value method of accounting as prescribed by Accounting Principles Board Opinion No. 25, Accounting for Stock Issued to Employees, to account for stock options. Forward-Looking Statements From time to time, we may make or publish forward-looking statements relating to such matters as anticipated financial performance, business prospects, technological developments, new products, and similar matters. Such statements are necessarily estimates reflecting management’s best judgment based on current information. The Private Securities Litigation Reform Act of 1995 provides a safe harbor for forward-looking statements. Such statements are usually identified by the use of words or phrases such as ‘‘believes,’’ ‘‘anticipates,’’ ‘‘expects,’’ ‘‘estimates,’’ ‘‘planned,’’ ‘‘outlook’’ and ‘‘goal.’’ Because forward-looking statements involve risks and uncertainties, our actual results could differ materially. In order to comply with the terms of the safe harbor, we note that a variety of factors could cause our actual results and experience to differ materially from the anticipated results or other expectations expressed in forward-looking statements. While it is impossible to identify all such factors, the risks and uncertainties that may affect the operations, performance and results of our business include the following: Our significant indebtedness could adversely affect our financial health, and prevent us from fulfilling our obligations under the New Notes and the New Credit Agreement; We will require a significant amount of cash to service our indebtedness. Our ability to generate cash depends on many factors beyond our control; Reductions, cancellations or delays in customer purchases would adversely affect our profitability; We may be adversely affected by the financial health of the U.S. retail industry;
  • 23. Jarden Corporation Management’s Discussion and Analysis (Continued) We may be adversely affected by the trend towards retail trade consolidation; Sales of some of our products are seasonal and weather related; Competition in our industries may hinder our ability to execute our business strategy, sustain profitability, or maintain relationships with existing customers; If we fail to develop new or expand existing customer relationships, our ability to grow our business will be impaired; Our operations are subject to a number of Federal, state and local environmental regulations; We may be adversely affected by remediation obligations mandated by applicable environmental laws; We depend on key personnel; We enter into contracts with the United States government and other governments; Our operating results can be adversely affected by changes in the cost or availability of raw materials; 21 PG. We may have difficulty in integrating acquired businesses, which may interrupt our business operations; Continuation of the United States penny as a currency denomination; Our business could be adversely affected because of risks which are particular to international operations; We depend on our patents and proprietary rights; We may be adversely affected by problems that may arise between certain of our vendors, customers, and transportation services that we rely on and their respective labor unions that represent certain of their employees; Certain of our employees are represented by labor unions; and Any other factors which may be identified from time to time in our periodic Commission filings and other public announcements. Should one or more of these risks or uncertainties materialize, or should underlying assumptions prove incorrect, actual results may vary materially from those described in the forward-looking statement, we do not intend to update forward-looking statements. Quantitative and Qualitative Disclosures About Market Risk In general, business enterprises can be exposed to market risks including fluctuations in commodity prices, foreign currency values, and interest rates that can affect the cost of operating, investing, and financing. The Company’s exposures to these risks are low. The majority of the Company’s zinc business is conducted on a tolling basis whereby customers supply zinc to the Company for processing, or supply contracts provide for fluctuations in the price of zinc to be passed on to the customer. The Company’s plastic consumables business purchases resin from regular commercial sources of supply and, in most cases, multiple sources. The supply and demand for plastic resins is subject to cyclical and other market factors. With many of our customers, we have the ability to pass through price increases with an increase in our selling price and certain of our customers purchase the resin used in products we manufacture for them. The Company, from time to time, invests in short-term financial instruments with original maturities usually less than fifty days. The Company is exposed to short-term interest rate variations with respect to Eurodollar or Base Rate on its term and revolving debt obligations and 6 month LIBOR in arrears on its interest rate swap. The spread on the interest rate swap is 470 basis points. Settlements on the interest rate swap are made on May 1 and November 1, with the first one having been made on November 1, 2002. The Company is exposed to credit loss in the event of non-performance by the other party to the swap, a large financial institution, however, the Company does not anticipate non-performance by the other party.
  • 24. Jarden Corporation Management’s Discussion and Analysis (Continued) Changes in Eurodollar or LIBOR interest rates would affect the earnings of the Company either positively or negatively depending on the changes in short-term interest rates. Assuming that Eurodollar and LIBOR rates each increased 100 basis points over period end rates on the outstanding term debt and interest rate swap, the Company’s interest expense would have increased by approximately $0.8 million and $0.5 million for 2002 and 2001, respectively. The amounts were determined by considering the impact of the hypothetical interest rates on the Company’s borrowing cost, short-term investment rates, interest rate swap and estimated cash flow. Actual changes in rates may differ from the assumptions used in computing this exposure. The Company does not invest or trade in any derivative financial or commodity instruments, nor does it invest in any foreign financial instruments. 22 PG.
  • 25. Jarden Corporation Report of Independent Auditors Board of Directors and Shareholders Jarden Corporation and Subsidiaries We have audited the accompanying consolidated balance sheets of Jarden Corporation and subsidiaries as of December 31, 2002 and 2001, and the related consolidated statements of operations, comprehensive income, stockholders’ equity, and cash flows for each of the three years in the period ended December 31, 2002. These financial statements are the responsibility of the Company’s management. Our responsibility is to express an opinion on these financial statements based on our audits. 23 PG. We conducted our audits in accordance with auditing standards generally accepted in the United States. Those standards require that we plan and perform the audit to obtain reasonable assurance about whether the financial statements are free of material misstatement. An audit includes examining, on a test basis, evidence supporting the amounts and disclosures in the financial statements. An audit also includes assessing the accounting principles used and significant estimates made by management, as well as evaluating the overall financial statement presentation. We believe that our audits provide a reasonable basis for our opinion. In our opinion, the financial statements referred to above present fairly, in all material respects, the consolidated financial position of Jarden Corporation and subsidiaries at December 31, 2002 and 2001, and the consolidated results of their operations and their cash flows for each of the three years in the period ended December 31, 2002 in conformity with accounting principles generally accepted in the United States. As discussed in Note 2 to the consolidated financial statements, on January 1, 2002, the Company adopted Statement of Financial Accounting Standards No. 142, ‘‘Goodwill and Other Intangible Assets’’. /s/ ERNST & YOUNG LLP New York, New York January 30, 2003
  • 26. Jarden Corporation Consolidated Statements of Operations (in thousands, except per share amounts) Year ended December 31, 2002 2001 2000 Net sales . . . . . . . . . . . . . . . . . . . . . . . . . . . . . . . . . . . . . . . . . . . . . . . . . . $368,199 $ 304,978 $357,356 Costs and expenses: Cost of sales . . . . . . . . . . . . . . . . . . . . . . . . . . . . . . . . . . . . . . . . . . . . . 216,629 232,634 274,248 Selling, general and administrative expenses . . . . . . . . . . . . . . . . . . 86,461 53,254 57,342 Goodwill amortization . . . . . . . . . . . . . . . . . . . . . . . . . . . . . . . . . . . . — 5,153 6,404 Special charges (credits) and reorganization expenses . . . . . . . . . . — 4,978 380 Loss on divestitures of assets and product lines . . . . . . . . . . . . . . . . — 122,887 — Operating income (loss) . . . . . . . . . . . . . . . . . . . . . . . . . . . . . . . . . . . . . 65,109 (113,928) 18,982 Interest expense, net . . . . . . . . . . . . . . . . . . . . . . . . . . . . . . . . . . . . . . . . 12,611 11,791 11,917 Income (loss) before taxes and minority interest . . . . . . . . . . . . . . . . . 52,498 (125,719) 7,065 Income tax provision (benefit) . . . . . . . . . . . . . . . . . . . . . . . . . . . . . . . . 16,189 (40,443) 2,402 24 PG. Minority interest in gain (loss) of consolidated subsidiary . . . . . . . . . — 153 (259) Net income (loss) . . . . . . . . . . . . . . . . . . . . . . . . . . . . . . . . . . . . . . . . . . . $ 36,309 $ (85,429) $ 4,922 Basic earnings (loss) per share: Net income (loss) . . . . . . . . . . . . . . . . . . . . . . . . . . . . . . . . . . . . . . . . . $ 2.60 $ (6.71) $ 0.39 Diluted earnings (loss) per share: Net income (loss) . . . . . . . . . . . . . . . . . . . . . . . . . . . . . . . . . . . . . . . . . $ 2.52 $ (6.71) $ 0.39 Weighted average shares outstanding: Basic . . . . . . . . . . . . . . . . . . . . . . . . . . . . . . . . . . . . . . . . . . . . . . . . . . . 13,940 12,726 12,676 Diluted . . . . . . . . . . . . . . . . . . . . . . . . . . . . . . . . . . . . . . . . . . . . . . . . . 14,392 12,726 12,766 The accompanying notes are an integral part of the consolidated financial statements.
  • 27. Jarden Corporation Consolidated Balance Sheets (in thousands, except per share amounts) December 31, 2002 2001 Assets Current assets: Cash and cash equivalents . . . . . . . . . . . . . . . . . . . . . . . . . . . . . . . . . . . . . . . . . $ 56,779 $ 6,376 Accounts receivable, net of allowances of $6,095 and $778 . . . . . . . . . . . . . 40,470 14,917 Income taxes receivable . . . . . . . . . . . . . . . . . . . . . . . . . . . . . . . . . . . . . . . . . . . 1,039 16,252 Inventories, net . . . . . . . . . . . . . . . . . . . . . . . . . . . . . . . . . . . . . . . . . . . . . . . . . . 59,463 26,994 Deferred taxes on income . . . . . . . . . . . . . . . . . . . . . . . . . . . . . . . . . . . . . . . . . 10,312 4,832 Prepaid expenses and other current assets . . . . . . . . . . . . . . . . . . . . . . . . . . . . 4,667 3,134 Total current assets . . . . . . . . . . . . . . . . . . . . . . . . . . . . . . . . . . . . . . . . . . 172,730 72,505 Non-current assets: Property, plant and equipment, at cost Land . . . . . . . . . . . . . . . . . . . . . . . . . . . . . . . . . . . . . . . . . . . . . . . . . . . . . . . . . . . 782 782 Buildings . . . . . . . . . . . . . . . . . . . . . . . . . . . . . . . . . . . . . . . . . . . . . . . . . . . . . . . 25,109 24,356 Machinery and equipment . . . . . . . . . . . . . . . . . . . . . . . . . . . . . . . . . . . . . . . . . 115,637 106,106 25 PG. 141,528 131,244 Accumulated depreciation . . . . . . . . . . . . . . . . . . . . . . . . . . . . . . . . . . . . . . . . . (96,291) (87,701) 45,237 43,543 Intangibles, net . . . . . . . . . . . . . . . . . . . . . . . . . . . . . . . . . . . . . . . . . . . . . . . . . . . . . . 134,060 15,487 Deferred taxes on income . . . . . . . . . . . . . . . . . . . . . . . . . . . . . . . . . . . . . . . . . . . . . — 25,417 Other assets . . . . . . . . . . . . . . . . . . . . . . . . . . . . . . . . . . . . . . . . . . . . . . . . . . . . . . . . . 14,738 5,282 Total assets . . . . . . . . . . . . . . . . . . . . . . . . . . . . . . . . . . . . . . . . . . . . . . . . . . . . . . . . . $366,765 $162,234 Liabilities and stockholders’ equity Current liabilities: Short-term debt and current portion of long-term debt . . . . . . . . . . . . . . . . . $ 16,117 $ 28,500 Accounts payable . . . . . . . . . . . . . . . . . . . . . . . . . . . . . . . . . . . . . . . . . . . . . . . . 18,466 14,197 Accrued salaries, wages and employee benefits . . . . . . . . . . . . . . . . . . . . . . . 13,559 9,252 Other current liabilities . . . . . . . . . . . . . . . . . . . . . . . . . . . . . . . . . . . . . . . . . . . 23,031 12,521 Total current liabilities . . . . . . . . . . . . . . . . . . . . . . . . . . . . . . . . . . . . . . . . 71,173 64,470 Non-current liabilities: Long-term debt . . . . . . . . . . . . . . . . . . . . . . . . . . . . . . . . . . . . . . . . . . . . . . . . . . 200,838 56,375 Deferred taxes on income . . . . . . . . . . . . . . . . . . . . . . . . . . . . . . . . . . . . . . . . . 6,377 — Other non-current liabilities . . . . . . . . . . . . . . . . . . . . . . . . . . . . . . . . . . . . . . . 11,613 6,260 Total non-current liabilities . . . . . . . . . . . . . . . . . . . . . . . . . . . . . . . . . . . . 218,828 62,635 Commitments and contingencies (Notes 13 & 14) — — Stockholders’ equity: Common stock ($.01 par value, 50,000 shares authorized, 15,926 and 15,926 shares issued and 14,371 and 12,796 shares outstanding at December 31, 2002 and 2001, respectively) . . . . . . . . . . . . . . . . . . . . . . . . . 159 159 Additional paid-in capital . . . . . . . . . . . . . . . . . . . . . . . . . . . . . . . . . . . . . . . . . 34,076 41,694 Retained earnings . . . . . . . . . . . . . . . . . . . . . . . . . . . . . . . . . . . . . . . . . . . . . . . . 69,033 32,724 Notes receivable for stock purchases . . . . . . . . . . . . . . . . . . . . . . . . . . . . . . . . (5,109) — Accumulated other comprehensive loss . . . . . . . . . . . . . . . . . . . . . . . . . . . . . . (3,463) (1,862) Less: treasury stock (1,555 and 3,130 shares, at cost, at December 31, 2002 and 2001, respectively) . . . . . . . . . . . . . . . . . . . . . . . . . . . . . . . . . . . . . . . . . (17,932) (37,586) Total stockholders’ equity . . . . . . . . . . . . . . . . . . . . . . . . . . . . . . . . . . . . . 76,764 35,129 Total liabilities and stockholders’ equity . . . . . . . . . . . . . . . . . . . . . . . . . . . . . . . . . $366,765 $162,234 The accompanying notes are an integral part of the consolidated financial statements.