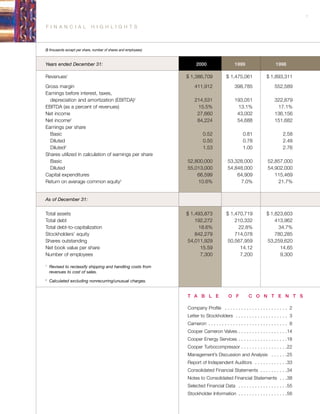
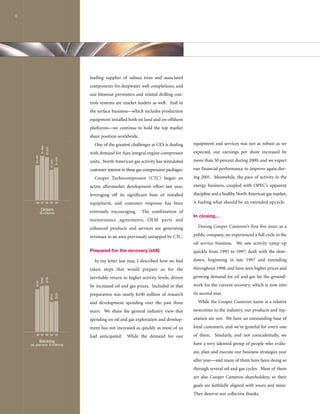
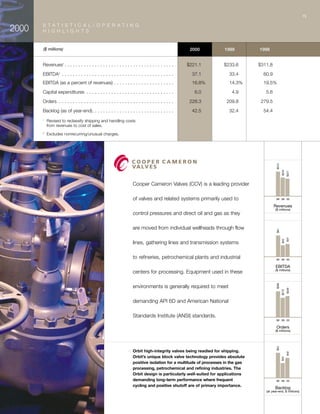
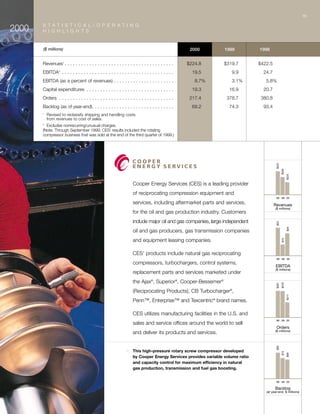
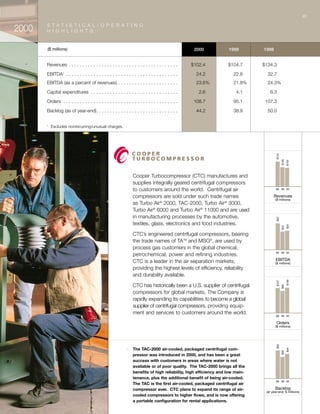
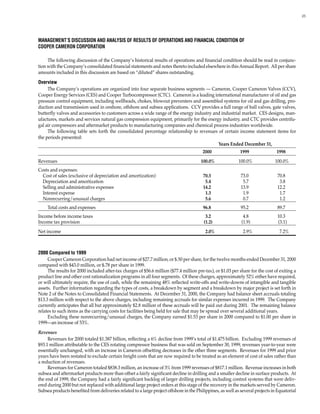
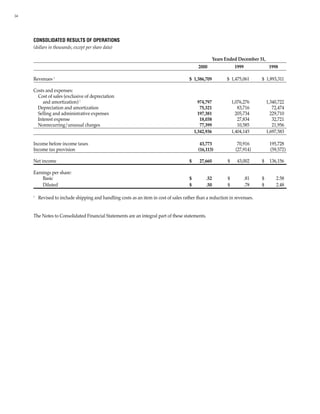
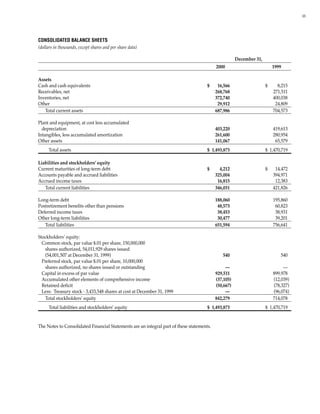
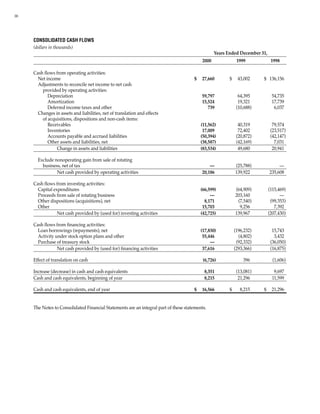
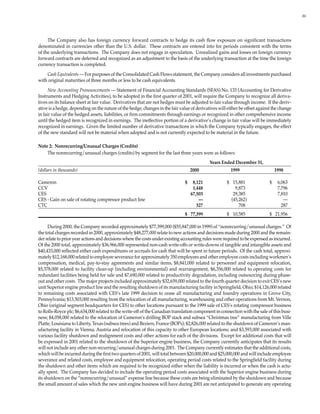
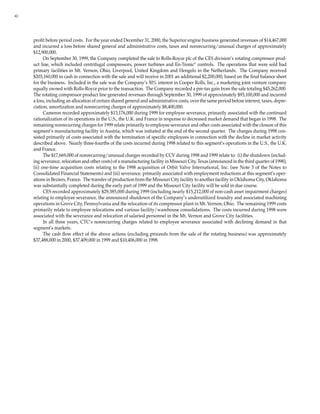
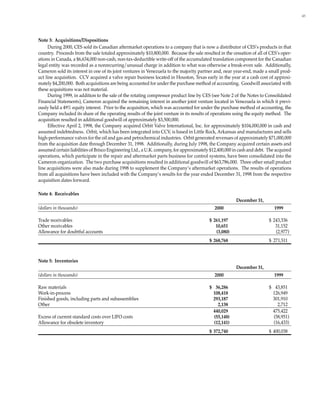
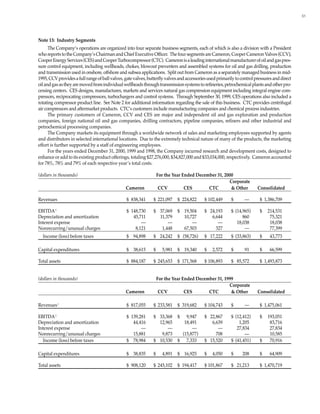
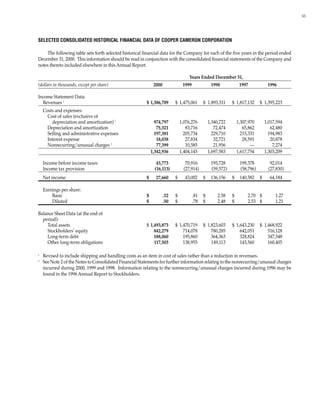
Cooper Cameron's annual report for 2000 provides financial highlights and discusses business performance. Key points include:
- Revenues for 2000 were $1.39 billion, down from 1999 but excluding a business that was sold. Earnings before interest, taxes, depreciation and amortization (EBITDA) increased 11% to $214.5 million.
- The company began a Six Sigma program to improve manufacturing and service results across divisions, with over 50 projects already underway.
- Nonrecurring restructuring charges of over $77 million were recorded, mostly related to closing old facilities. Restructuring is expected to be completed by mid-2001.
- The balance sheet remains strong with debt reduced to
Cooper Cameron Corporation is an international manufacturer of oil and gas pressure control equipment. In 1999, revenues were $1.46 billion, down 22% from 1998 due to declining orders from customers in the weak market. Net income was $43 million. Several plants were closed and about 1,000 employees were reduced through layoffs and attrition to control costs in the difficult market conditions. The rotating compressor business was sold to improve focus on reciprocating engines and compressors. Cash from the sale enhanced Cooper Cameron's financial flexibility with $210 million of debt and a debt-to-capitalization ratio of 22.8%.
Cooper Cameron Corporation is an international manufacturer of oil and gas equipment. In 1998, the company achieved record earnings but revenues and orders declined as oil and gas markets weakened. Cooper Cameron responded by acquiring other companies, focusing on new business units, investing in productivity improvements, reducing costs through layoffs and plant closures, and repurchasing stock. While earnings are under pressure due to the difficult market environment, cash generation remains a strength and the company is focused on managing through the downturn.
This annual report summarizes Cooper Cameron's financial performance in 2001 and provides an outlook for 2002. Key points include:
- Revenues increased 13% to $1.56 billion in 2001, while EBITDA grew 17% to $251 million. However, the stock price declined 40% due to industry uncertainty.
- Productivity improvement and cost reduction remain priorities through the Six Sigma program and other initiatives.
- Global energy demand is expected to grow long-term at 2-3% annually, though customers' spending may be flat or down slightly in 2002 from 2001 levels.
- Acquisitions in 2001 added to Cooper Cameron's portfolio, as mergers and acquisitions activity was stepped up.
This document provides supplemental financial information for SLM Corporation for Q3 2006. It includes their statement of income for Q3 2006, Q2 2006, Q3 2005, and the first nine months of 2006 and 2005. It shows interest income increased from $1.2 billion to $1.7 billion from Q3 2005 to Q3 2006. Net income was $263 million for Q3 2006. The document also provides adjustments to net income figures to exclude special one-time items.
This document summarizes TXU Corp.'s consolidated income statements and balance sheets for the three months, six months, and twelve months ended June 30, 2001 and 2000. Some key details:
- Operating revenues increased 33.4%, 54.8%, and 48.4% respectively compared to the prior year.
- Total operating expenses also increased significantly due to higher energy purchase costs and other factors.
- Net income decreased 8.8%, 2.9%, and 19.6% respectively compared to the prior year.
SLM Corporation reported its financial results for the second quarter of 2006. Net interest income decreased from the prior quarter due to higher interest expenses. However, net income increased significantly due to a large gain from student loan securitizations. Overall, net income for the first half of 2006 was higher than the same period in 2005, driven by growth in interest income from student loans and gains on securitizations.
The document provides financial information for DTE Energy Company and its subsidiaries for the fourth quarter and full year of 2005. It includes statements of operating income, financial position, cash flows, and debt to equity calculations. For the quarter, DTE Energy reported net income of $378 million compared to $151 million in the prior year. For the full year, net income was $577 million compared to $445 million in 2004. Total assets as of December 31, 2005 were $23.36 billion with total debt of $6.6 billion and shareholders' equity of $5.55 billion.
This document provides condensed financial statements for Qwest Communications International Inc. as of June 30, 2008. It includes statements of operations, balance sheets, and cash flows. For the six months ended June 30, 2008, Qwest reported total operating revenues of $3,382 million and net income of $188 million. Total assets as of June 30, 2008 were $21,894 million, with total liabilities of $21,391 million resulting in total stockholders' equity of $503 million. For the six months ended June 30, 2008, cash provided by operating activities was $1,297 million and cash used for investing activities, primarily capital expenditures, was $950 million.
DTE Energy filed its second quarter 2003 Form 10-Q with the SEC, reporting a loss of $39 million compared to an unaudited loss of $23 million previously announced. This was due to less insurance coverage than expected for an April ice storm. Operating earnings for the quarter were $70 million, in line with the company's full-year 2003 operating earnings guidance of $3.10-$3.30 per share. The earnings revision did not impact the company's operating earnings outlook or internal performance measures.
Qwest Communications International Inc. reported financial results for the quarter ended March 31, 2008. Total operating revenue for Qwest was $3.4 billion for the quarter. Net income was $157 million, with basic earnings per share of $0.09. Total assets as of March 31, 2008 were $21.9 billion, with current assets of $3.2 billion. Cash provided by operating activities for the quarter was $388 million.
This document provides consolidated financial information for Duke Energy Corporation for the years 2004-2001, including:
- Earnings before interest and taxes from continuing operations by business segment, showing quarterly and annual EBIT figures for each segment.
- A consolidating statement of operations for 2004, showing operating revenues and expenses by segment. Total operating revenues were $22.5 billion.
- Common stock data such as earnings per share from continuing/discontinued operations, shares outstanding, dividends paid, and book value per share for each year.
The document contains consolidated financial highlights and quarterly/annual segment data to provide an overview of Duke Energy's performance and operations.
This document is Southern Company's 2007 annual report. It discusses challenges facing the energy industry like rising demand and an aging workforce. Southern Company is meeting these challenges through investments in new generation capacity, transmission infrastructure, and energy efficiency programs. The annual report highlights how Southern Company reliably served record-breaking electricity demand during a major heat wave in 2007 while continuing to improve operational performance.
Xcel Energy Inc. filed a quarterly report with the SEC for the period ending March 31, 2001. The report includes consolidated statements of income and cash flows. For the quarter, Xcel Energy reported net income of $209 million on revenues of $4.2 billion. Operating income was $493 million. Cash provided by operating activities was $260 million, while cash used in investing activities was $1.7 billion, consisting largely of nonregulated capital expenditures and utility construction costs. Cash from financing activities was $1.6 billion, including proceeds from debt and equity issuances.
This document contains condensed consolidated financial statements for Qwest Communications International Inc. as of September 30, 2008. It includes statements of operations, balance sheets, and cash flows for quarterly and annual periods between 2006 and 2008. The statements show that in 2007 Qwest reported a net income of $2.9 billion compared to $593 million in 2006, driven largely by a one-time $2.1 billion tax benefit recognized in the third quarter of 2007. Total operating revenues have remained relatively steady between $13-14 billion annually over this period.
This document is Gannett's 2003 annual report. It discusses Gannett's financial results for 2003, which included record operating revenues of $6.7 billion and net income of $1.21 billion, up 4% from 2002. It provides an overview of Gannett's business segments, which include newspapers, broadcasting stations, and digital media. The letter to shareholders discusses some of the challenges Gannett faced in 2003 from economic conditions and regulatory changes, but also highlights areas of growth such as new youth-oriented newspaper publications and increased online revenues. Acquisitions that expanded Gannett's operations in the U.S. and U.K. are also summarized.
Advance Auto Parts is the second largest aftermarket auto parts retailer in the US, with over 2,500 stores across 39 states, Puerto Rico, and the Virgin Islands. In 2003, their nearly 35,000 team members provided excellent customer service, building momentum for future growth. Advance aims to be "ready in advance" for customers' needs. Their expanding store network and growing sales demonstrate their success in meeting this goal.
This document presents financial highlights for MGM Resorts International from 1998 to 2002. It shows that over this period the company grew substantially, with net revenues increasing from $703.9 million in 1998 to $4.03 billion in 2002. Operating income and net income also increased every year over this period. The number of outstanding shares grew from 104.1 million in 1998 to 154.6 million in 2002.
This document contains condensed consolidated financial statements and notes for Qwest Communications International Inc. for quarters ending March 31, 2005 through September 30, 2007. Some key details include:
- Operating revenue ranged from $3.4 to $3.5 billion per quarter while operating expenses ranged from $3.1 to $3.3 billion per quarter.
- Net income/loss fluctuated each quarter from a loss of $528 million in Q4 2005 to a gain of $2.065 billion in Q3 2007.
- Total assets ranged from $21.1 to $24.1 billion while total liabilities ranged from $24.1 to $26.7 billion.
The 2002 annual report summarizes Gannett Co.'s financial performance for the year. Key highlights include operating revenues of $6.4 billion, a 1.9% increase over 2001, operating income of $1.9 billion, a 21.2% increase over 2001, and net income of $1.16 billion, a 39.6% increase over 2001. The CEO notes that while the economy remained weak, Gannett performed well due to its preparations and success-focused culture, with operating cash flow increasing 5.7% and diluted earnings per share increasing 10% after adjusting for new accounting rules.
The document is ADM's 2004 annual report. It provides an overview of ADM's oilseeds processing segment. ADM processes a variety of oilseeds at facilities around the world, producing protein meals and vegetable oils. Meals are used mainly in animal feed while oils are used in food products and industrial applications. In fiscal 2004, oilseeds processing contributed $388 million in operating profit, or 19% of ADM's total operating profit. ADM has expanded its oilseeds processing capacity significantly in South America and Asia to capitalize on growth in those markets.
Unisys Corporation reported financial results for the first quarter of 2004 and 2003. Revenue increased slightly from $1.4 billion to $1.46 billion year-over-year. Net income was $28.9 million compared to $38.5 million in the prior year. Earnings per share were $0.09 compared to $0.12. The company also provided supplemental non-GAAP information excluding pension expenses/income to enhance understanding of operational performance. Free cash flow was $16.1 million compared to negative $154.3 million in the prior year period.
el paso F01E85AA-D20E-424D-B73A-588DF65EC38A_Proxy_Statement_2009finance49
The document is a letter inviting El Paso stockholders to the company's 2009 Annual Meeting of Stockholders. It provides details about the meeting such as the date, time, and location. It states that stockholders will be asked to vote on the election of 11 directors, amendments to the 2005 Omnibus Incentive Compensation Plan and Employee Stock Purchase Plan, and the ratification of Ernst & Young LLP as the independent auditor. Three directors will be retiring pursuant to the company's mandatory retirement policy. The letter urges stockholders to vote and attend if possible.
El Paso Corporation is focused on growing its pipeline and E&P businesses in a sustainable manner over the long term. The company has a large committed growth backlog for its pipeline segment and plans for 8-12% annual production growth in its E&P segment through 2010. El Paso aims to deliver meaningful and profitable results through its focus on core assets and execution of growth projects.
El Paso Corporation provides natural gas and related energy products safely and reliably. The company focuses on developing a positive culture as the place to work, neighbor to have, and company to own. El Paso's interstate pipelines are the cornerstone of its business, with the largest franchise in the U.S., $2.2 billion in new projects, and expected 4-6% annual growth. The company plans to launch an MLP IPO for part of its pipeline business in the fourth quarter of 2007.
The Pipeline Group had a strong fourth quarter and 2007. EBIT increased 2% and 7% respectively compared to the prior year. Throughput increased 7% in 2007. Notable events included placing the WIC Kanda project in service and acquiring a 50% stake in Gulf LNG. The group signed a precedent agreement to support expansion of the FGT pipeline and has a committed backlog approaching $4 billion.
The document provides an overview of El Paso Corporation's strategy to be a meaningful company doing meaningful work and delivering meaningful results. It discusses the company's focus on providing natural gas and related energy products in a safe, efficient, and dependable manner. It also summarizes El Paso Pipeline Group's leading franchise with its unparalleled market presence, excellent expansion inventory, and visible 4-6% EBITDA growth. Finally, it outlines the company's significant pipeline connectivity and organic growth opportunities from superior supply access and LNG projects.
James C. Yardley, President and CEO of El Paso Pipeline GP Company, gave a presentation at the IPAA MLP Conference on January 17, 2008. He discussed El Paso Corporation's pipeline assets and its formation of El Paso Pipeline Partners, an MLP. El Paso retains a majority ownership in the MLP and its pipelines provide stable cash flows from long-term contracts. The MLP represents an opportunity for growth through organic expansion projects and potential dropdowns or third party acquisitions.
Cooper Cameron Corporation is an international manufacturer of oil and gas pressure control equipment and turbines, compressors, engines and turbochargers. It produces valves, wellheads, blowout preventers and other equipment for drilling, production and transmission. It provides products and services to customers in oil and gas, pipelines, power generation and other industries. The 1998 annual report discusses Cooper Cameron's financial highlights for 1998, with revenues of $1.88 billion and net income of $136 million. It also gives an overview of the company's divisions and products.
This document provides an overview of an exploration and production company's goals, operations, and strategic path forward. Key points include:
- The company aims to demonstrate clear progress on performance and become a "Top Tier" operator.
- Operations are focused on unconventional and low-risk conventional programs in key US basins, with production and reserves heavily weighted to US onshore assets.
- The strategy is to build competencies in repeatable programs, improve efficiency, and divest weaker assets in order to become a top performer based on growth, inventory, costs, reserve replacement, and value creation.
- Various US onshore programs are detailed that provide predictable growth, repeatability, and upside potential
This document is a Form 10-K annual report filed by Universal Health Services, Inc. with the SEC for the fiscal year ended December 31, 2003. It provides an overview of UHS's business operations, including that it operates acute care hospitals and behavioral health facilities across the US, Puerto Rico, and France. It also summarizes UHS's recent acquisitions and development activities in 2003 and early 2004, which included acquiring or opening several new hospitals. The report includes standard sections for a 10-K filing, such as business descriptions, properties, legal proceedings, market information for stock, financial data, and risk factors.
This document is Chiquita Brands International's 2003 annual report. It summarizes the company's financial performance and operational highlights for 2003. The key points are:
- Operating income doubled to $140 million compared to previous periods, due in part to asset sales. Debt was reduced by $122 million, achieving a $400 million target early.
- Productivity increased 12% on owned banana farms and a new fresh cut fruit business was successfully launched. Labor and food safety certifications were also earned.
- The company aims to leverage its brand and expand into higher-margin fruit businesses, targeting 30% of revenues from new businesses in 5 years. Transformation will include a focus on marketing and new talent.
The 2004 annual report of Holly Corporation provides an overview of the company's financial and operating highlights for 2004 as well as its mission, company profile, and refined product markets. Key details include Holly operating three petroleum refineries in New Mexico, Utah, and Montana with total refining capacity of 109,000 barrels per day. Holly also owns a 48% interest in Holly Energy Partners which owns over 1,500 miles of refined product pipelines and terminals. Holly achieved record financial results in 2004 with sales of $2.2 billion and net income of $83.9 million compared to $1.4 billion and $46.1 million respectively in 2003.
Texas Eastern Transmission reported financial results for the first quarter of 2007. Revenue was $226 million, down from $248 million in the prior year. Operating expenses declined to $107 million from $118 million. Net income was $63 million compared to $85 million in 2006. Total assets were $5.048 billion as of March 31, 2007.
This document is El Paso Corporation's annual report on Form 10-K filed with the United States Securities and Exchange Commission for the fiscal year ended December 31, 2007. It provides information on El Paso's business operations, legal proceedings, financial statements, management's discussion and analysis, and corporate governance. El Paso owns and operates North America's largest natural gas transmission pipeline network and has natural gas exploration and production operations. The report provides details on El Paso's pipeline systems and storage facilities, as well as its strategy to grow its natural gas transmission and storage business.
Jim Yardley, president of a pipeline group, presented at a conference on the natural gas pipeline outlook. He discussed several challenges facing the industry, including ensuring adequate gas supply for the US, building needed infrastructure given rising costs and workforce issues, determining gas's role in greenhouse gas policy, and maintaining safety in pipeline operations and damage prevention. While there are significant opportunities, meeting these challenges will be important for the continued delivery of gas safely and reliably.
This document provides an overview and update from Lisa Stewart, President of El Paso Production and Non-Regulated Operations, on Gulf of Mexico operations. It discusses El Paso's large acreage position in the GOM, its 52 ready-to-drill prospects of varying depths, its capital management system for evaluating and tracking drilling prospects, its balanced 2005 drilling program consisting of development and exploration wells, and the technologies it employs for 3D seismic, drilling, completions, and developing deep shelf plays.
El Paso Corporation reported strong financial results for the second quarter of 2007, with EBIT of $470 million and diluted EPS of $0.22. Exploration and Production was ahead of target for the quarter and on target for the full year. The Pipelines business was also ahead of target for the quarter and on target for the year with more opportunities on the horizon. Adjusted diluted EPS, excluding one-time costs, was $0.29. The company remains focused on delivering meaningful results through its core businesses of Pipelines and Exploration and Production.
El Paso Pipeline Partners owns and operates three major interstate natural gas pipelines: Wyoming Interstate Company, Colorado Interstate Gas, and Southern Natural Gas. The company generates stable cash flow from long-term capacity reservation contracts averaging over 8 years. El Paso Pipeline Partners has several organic expansion projects underway and is well positioned to pursue additional growth opportunities through sponsor drop downs and third party acquisitions. The company maintains a strong financial position to support its current expansion program.
This document is Cooper Cameron Corporation's 1999 annual report. It summarizes the company's financial performance for 1999, which saw revenues of $1.46 billion, down 22% from 1998 due to declining orders in a weak market. Earnings before interest, taxes, depreciation and amortization (EBITDA) were $193 million, down 40% from 1998. The company reduced its workforce by over 20% through layoffs and plant closures to control costs in the difficult market environment. It also sold its rotating compressor business to improve its financial flexibility going forward as market conditions improve.
Danaher Corporation reported its fourth quarter and full year 2001 results. For the fourth quarter, net earnings excluding restructuring charges were $76.6 million compared to $87.8 million in 2000. Full year 2001 net earnings excluding restructuring charges were $341.2 million, a 5% increase over 2000. However, Danaher recorded a $69.7 million restructuring charge in the fourth quarter related to manufacturing facility consolidations. For the full year, net earnings including restructuring charges were $297.7 million. Despite difficult economic conditions, Danaher was able to grow earnings in 2001 through aggressive cost reductions and restructuring actions.
This document provides supplemental financial information for SLM Corporation for the fourth quarter of 2006. It includes statements of income for the fourth quarter of 2006, the third quarter of 2006, and the fourth quarter of 2005, as well as for the full years 2006 and 2005. It also summarizes certain income statement items that were separately disclosed in the Company's earnings press releases and conference calls for each period. Key figures include net income of $18 million for Q4 2006, $263 million for Q3 2006, and $431 million for Q4 2005. For full year 2006, net income was $1.16 billion compared to $1.38 billion for 2005.
Advance Auto Parts experienced strong growth in 2003, building momentum across key metrics. With over 2,500 stores in 39 states, Puerto Rico and the Virgin Islands, the company served over 200 million customers in 2003. Same store sales grew 3.1% as initiatives like expanded private brands and improved supply chain efficiencies increased the number of customers and average transaction size. Operating margins increased to 8.3% of sales, up from 7.2% the prior year. Earnings per share also grew substantially.
This document provides financial and operating reports for TXU Corp. and subsidiaries for the first quarter of 2001 and full year 2000. It includes statements of consolidated income, operating revenues and expenses, net income, earnings per share, and statements of consolidated cash flows. Some key details are revenues for the first quarter of 2001 were $8.4 billion, a 75% increase from the same period in 2000. Net income for the full year 2000 was $907 million, an 9% decrease from 1999. Cash provided by operating activities for 2000 was $2.5 billion.
The document is the 2005 annual report of Erie Indemnity Company. It discusses Erie Indemnity's financial results for 2005 which showed a 2.1% increase in net income to $231.1 million and a 4.0% increase in net income per share to $3.34. The report also discusses strategic initiatives undertaken in 2005 to strengthen Erie Insurance Group's competitive position and underwriting discipline. These initiatives have positioned the company to pursue balanced growth through disciplined underwriting and expansion of its agency force.
The 2002 annual report provides financial information for a company. It includes a table of contents and sections on management discussion/analysis, independent auditors report, consolidated financial statements, risk factors, and selected financial data. The management discussion notes that operating results for the year were in line with projections. Continental US revenues were $1.8 billion while expenses were $1.46 billion. Prior year Medicare lab revenue recognition allowed higher revenue recognition in 2002.
plains all american pipeline 2004 10-K part 2finance13
This document provides an overview and financial data for Plains All American Pipeline, L.P. It discusses the company's operations in crude oil transportation, gathering, marketing, terminalling and storage. Key details include:
- The company owns approximately 15,000 miles of crude oil pipelines and 37 million barrels of storage capacity, handling over 2.4 million barrels per day.
- For 2004, revenues were $20.975 billion and net income was $133.1 million, up from $59.4 million in 2003.
- The document provides historical financial and operating data from 2000-2004, including revenue, expenses, pipeline volumes, capital expenditures, and cash flow statements.
- It discusses
This document contains Credit Suisse's condensed consolidated financial statements for the second quarter of 2007. It includes:
1) Statements of income showing a 17% increase in net income from the prior year quarter to CHF 3.19 billion.
2) Balance sheets as of the end of the second quarter of 2007 and prior periods, showing total assets of CHF 1.42 trillion, a 1% increase from the prior year.
3) Details of shareholders' equity such as common shares, retained earnings, and treasury shares.
1) Cooper Cameron is an international manufacturer of oil and gas equipment that experienced relatively flat revenues in 2003 due to flat customer spending despite high oil and gas prices. 2) The company's subsea systems projects underperformed, missing 4th quarter earnings targets, but other businesses performed as expected. 3) Cooper Cameron is focused on creating shareholder value through new products and markets, cost reductions, defending market leadership, and maintaining a strong financial position.
This annual report summarizes Cooper Cameron's performance in 2003. It discusses how each of Cooper Cameron's business segments performed, with revenues increasing for some segments but margins declining across several segments due to competitive market conditions. It also notes that Cooper Cameron missed earnings expectations in the fourth quarter due to difficulties executing multiple subsea projects simultaneously. The report emphasizes that Cooper Cameron's focus remains on creating shareholder value through improving operations and capitalizing on its leadership positions, despite the relatively flat spending environment among its customers in the oil and gas industry.
This document provides quarterly financial data for Citigroup from 2006 to 2008. It includes consolidated income statements, balance sheets, and key metrics by business segment and region. The first page shows high-level financial summary tables with metrics such as total revenues, expenses, earnings per share, and return on equity. Subsequent pages provide more detailed financial statements and supplementary financial ratios to analyze Citigroup's performance.
Allstate operates from a strong financial position with over $104 billion in assets and $17.5 billion in shareholders' equity. It provides insurance and financial services to over 14 million households in the US. Allstate has $104.8 billion in assets and generates most of its revenues from property-liability insurance premiums and contract charges from its financial business. For 2000, Allstate reported revenues of $29.1 billion and net income of $2.2 billion.
This annual report summarizes Tech Data Corporation's fiscal year 1998. It saw record financial results, with net sales of $7.1 billion and net income of $89.5 million. Tech Data expanded internationally through the acquisition of Macrotron AG, making it a leader in the German market. It also grew its presence in Canada, Latin America, and Europe. The company increased its market share in the U.S. through new product offerings and innovative services like e-commerce and custom assembly. Tech Data attributed its success to its 5,000 employees worldwide and strategic partnerships with customers and vendors.
C.H. Robinson achieved strong success in 2007 despite challenging market conditions. The company grew gross profits 14.9% to $1.2 billion through its diverse mix of transportation services and customer relationships. Its non-asset based model and over 7,300 employees enabled it to efficiently manage over 6.5 million shipments. Looking ahead, C.H. Robinson is well positioned for continued growth given industry trends, its financial strength with no debt and $455 million in cash, and opportunities to expand internationally and through acquisitions.
C.H. Robinson achieved strong success in 2007 despite economic challenges. The company grew gross profits 14.9% to $1.2 billion through its diverse business lines and relationships with customers and carriers. Its non-asset based model allowed it to efficiently manage costs. The company continued investing in its business by expanding its office network and adding employees. C.H. Robinson is well positioned for future growth given ongoing trends driving demand for third party logistics.
The document is HCA's 2002 annual report. It summarizes that 2002 was a successful year for HCA financially and in resolving investigations by the federal government. HCA reinvested $1.7 billion in its existing facilities and acquired additional hospitals. It also initiated several long-term programs to develop its workforce, such as scholarships through HCA Cares and military training through Army PaYS, to address the national nursing shortage. The CEO and COO were pleased with progress in 2002, their first full year in their roles, and committed to continued investment in facilities, technology, and employees.
plains all american pipeline 2005 10-K part 2finance13
- The document provides financial and operating data for Plains All American Pipeline, L.P. for the years 2001-2005, including revenues, expenses, assets, liabilities, net income, cash flows, and common unit price and distribution information.
- It discusses that Plains All American's common units are publicly traded on the NYSE and provides unit price and distribution data for 2004-2005.
- It also summarizes Plains All American's cash distribution policy to unitholders and incentive distribution rights for its general partner.
This investor presentation provides an overview of Jarden Corporation. In 3 sentences: Jarden is a diversified global consumer products company with a portfolio of over 100 brands across multiple segments. It has established processes for continuous improvement to drive organic growth and integrate acquisitions. The presentation discusses Jarden's strategy, brand strengths, growth approach, operating culture, and framework for ongoing process improvement.
This investor presentation provides an overview of Jarden Corporation. In 3 sentences: Jarden is a diversified global consumer products company with a portfolio of over 100 brands across multiple segments. It has established resilient business platforms and market-leading brands. Jarden's growth strategy focuses on organic growth through increased investment and acquisitions of core, tuck-in businesses that strategically fit with its international focus.
Alltrista Corporation is a leading provider of niche consumer products used for home food preservation. In 2001, Alltrista undertook strategic initiatives to focus on its core consumer products business, including the divestiture of non-core businesses. As a result, Alltrista reported a net loss of $85.4 million for 2001 due to special charges associated with divestitures and restructuring costs. However, the divestitures and restructuring positioned Alltrista to focus on growing its consumer products business through the planned acquisition of Tilia International, which would make Alltrista the market leader in home vacuum packaging systems.
Alltrista sold off non-core businesses in 2001 to focus on consumer products, especially those related to home food preservation. This included brands for canning and vacuum packaging. The divestitures removed financial burdens and generated tax refunds. Alltrista also closed an office to reduce costs. Going forward, the strategy is to leverage leadership in niche consumer product markets to drive growth, with an acquisition of Tilia planned to expand into vacuum packaging.
This document is Jarden Corporation's 2002 Annual Report. It provides an overview of the company's performance in 2002 including financial highlights and summaries of its main business segments: branded consumables, home vacuum packaging, plastic consumables, and other. It discusses the company's acquisition of Tilia and strategic direction to build a world-class consumer products company with leading market shares in niche branded consumable products.
The 2003 annual report summarizes Jarden Corporation's financial and operating results for the year. It discusses record financial performance with revenues surpassing $500 million and cash flow from operations exceeding $70 million. It also highlights the acquisitions of Diamond Brands and Lehigh Consumer Products, which added over $250 million in annual revenue. The Chairman expresses optimism that 2004 will be another record year as the company continues executing its strategy of building a portfolio of market-leading consumer brands.
The 2003 annual report summarizes Jarden Corporation's financial and operating results for the year. It discusses record financial performance with revenues surpassing $500 million and cash flow from operations exceeding $70 million. It also highlights the acquisitions of Diamond Brands and Lehigh Consumer Products, which added over $250 million in annual revenue. The Chairman expresses optimism that this is just the beginning and that Jarden will continue executing its strategy to deliver strong growth.
The document summarizes Jarden Corporation's 2004 annual report. It discusses record financial results in 2004, including 5% organic sales growth and 18% EBITDA margins. It also highlights acquisitions of The United States Playing Card Company and American Household, Inc., owner of brands like Coleman and Sunbeam. The acquisition of American Household tripled Jarden's revenue base and provides opportunities for margin expansion and earnings growth.
The document is Jarden Corporation's 2004 annual report. It discusses Jarden's record financial results in 2004, including organic sales growth of 5% and EBITDA margins of 18% excluding non-cash charges. It also summarizes two acquisitions completed in 2004 - The United States Playing Card Company and American Household, Inc. - and how they will help Jarden expand its business and drive margin improvement towards a target of 15% over five years. The report highlights the company's focus on innovation through new product introductions and maintaining financial flexibility.
This annual report summarizes Jarden Corporation's financial performance in 2005. It discusses the company's acquisition of American Household and The Holmes Group, which expanded its consumer solutions segment. It also highlights initiatives across its various business segments, including new product introductions, employee programs, and efforts to improve operations. The Chairman expresses pride in the company's strong growth and record results in 2005, with revenues reaching $3.2 billion, nearly halfway to its goal of doubling EPS within 3 to 5 years.
Jarden Corporation reported record financial performance in 2006, with net sales increasing 21% to $3.85 billion and consolidated segment earnings growing 23% to $442 million. The annual report provides an overview of the company's three business segments - Branded Consumables, Consumer Solutions, and Outdoor Solutions - and their financial contributions. It also highlights new products, operational efficiencies, and initiatives around veterans hiring, outdoor recreation, and sustainability. Chairman Martin Franklin expressed confidence that the company is on track to double adjusted earnings per share within three to five years.
Chiquita Brands experienced a difficult year in 1999 due to severe banana price declines in Europe resulting from an overallocation of EU banana import licenses. Weak economies in Eastern Europe and Russia also negatively impacted pricing. Operating income declined compared to 1998. However, the company's Processed Foods business saw improved earnings. Chiquita completed a workforce reduction to streamline operations and generate annual savings. The EU banana import regime remains in noncompliance with international trade laws and continues to be challenged at the WTO.
Chiquita Brands International announced a proposed restructuring of $862 million in publicly-held debt discussed in the annual report. If successful, the restructuring would convert a significant portion of the debt into common equity, diluting existing shareholders. The restructuring process is still in the early stages and will continue past the customary May date for the annual shareholder meeting, which has been rescheduled for September 12, 2001. Shareholders will receive proxy materials in advance of the September meeting. The company's website and SEC filings provide information on the restructuring, operations, and other developments.
This document provides an update on Chiquita's progress against its three-year strategic plan to focus on its core banana business, drive better performance through cost reductions, and strengthen its balance sheet. Some key updates include selling non-core assets to focus on bananas, implementing cost saving programs with a target of $70 million in annual savings by 2005, reducing debt by over $100 million in 2002, and plans to invest cash flow into new growth opportunities once debt targets are met.
Chiquita Brands International is a leading marketer and producer of bananas and other fresh produce. In 2004, the company achieved several financial and operational goals including 18% sales growth to $3.1 billion, a 23% increase in operating cash flow to $92 million, and an 11% reduction in total debt. The CEO discusses the company's strategy to strengthen its core banana business, pursue profitable growth through new acquisitions and segments, build a high-performance organization, and improve profitability in North America. Key goals for 2005 include completing the acquisition of Fresh Express to diversify product offerings and integrating the new leadership team to execute the long-term strategy.
This document is Chiquita Brands International's 2005 Annual Report. Some key highlights include:
- Net sales grew 27% to a record $3.9 billion in 2005. Operating income increased 66% to $188 million and net income grew 138% to $131 million.
- The company continued strengthening its management team and board. It also acquired Fresh Express, the US market leader in value-added salads.
- In Europe, Chiquita reinforced its brand leadership in the face of a controversial new EU banana import regime. In North America, it achieved its first meaningful increase in banana pricing in over 15 years.
- Fresh Express accelerated its market leadership in retail value-added salads to a
This document is Chiquita Brands International's 2006 Annual Report. It summarizes the company's financial highlights for 2006, including a net loss of $96 million compared to a net income of $131 million in 2005. It also discusses challenges the company faced in 2006, such as higher EU tariffs on banana imports and an E. coli outbreak affecting the fresh-cut industry. The letter from the Chairman and CEO provides additional context on the company's operational and strategic progress in 2006 despite facing difficulties that impacted financial performance.
Abhay Bhutada, the Managing Director of Poonawalla Fincorp Limited, is an accomplished leader with over 15 years of experience in commercial and retail lending. A Qualified Chartered Accountant, he has been pivotal in leveraging technology to enhance financial services. Starting his career at Bank of India, he later founded TAB Capital Limited and co-founded Poonawalla Finance Private Limited, emphasizing digital lending. Under his leadership, Poonawalla Fincorp achieved a 'AAA' credit rating, integrating acquisitions and emphasizing corporate governance. Actively involved in industry forums and CSR initiatives, Abhay has been recognized with awards like "Young Entrepreneur of India 2017" and "40 under 40 Most Influential Leader for 2020-21." Personally, he values mindfulness, enjoys gardening, yoga, and sees every day as an opportunity for growth and improvement.
OJP data from firms like Vicinity Jobs have emerged as a complement to traditional sources of labour demand data, such as the Job Vacancy and Wages Survey (JVWS). Ibrahim Abuallail, PhD Candidate, University of Ottawa, presented research relating to bias in OJPs and a proposed approach to effectively adjust OJP data to complement existing official data (such as from the JVWS) and improve the measurement of labour demand.
The Universal Account Number (UAN) by EPFO centralizes multiple PF accounts, simplifying management for Indian employees. It streamlines PF transfers, withdrawals, and KYC updates, providing transparency and reducing employer dependency. Despite challenges like digital literacy and internet access, UAN is vital for financial empowerment and efficient provident fund management in today's digital age.
Fabular Frames and the Four Ratio ProblemMajid Iqbal
Digital, interactive art showing the struggle of a society in providing for its present population while also saving planetary resources for future generations. Spread across several frames, the art is actually the rendering of real and speculative data. The stereographic projections change shape in response to prompts and provocations. Visitors interact with the model through speculative statements about how to increase savings across communities, regions, ecosystems and environments. Their fabulations combined with random noise, i.e. factors beyond control, have a dramatic effect on the societal transition. Things get better. Things get worse. The aim is to give visitors a new grasp and feel of the ongoing struggles in democracies around the world.
Stunning art in the small multiples format brings out the spatiotemporal nature of societal transitions, against backdrop issues such as energy, housing, waste, farmland and forest. In each frame we see hopeful and frightful interplays between spending and saving. Problems emerge when one of the two parts of the existential anaglyph rapidly shrinks like Arctic ice, as factors cross thresholds. Ecological wealth and intergenerational equity areFour at stake. Not enough spending could mean economic stress, social unrest and political conflict. Not enough saving and there will be climate breakdown and ‘bankruptcy’. So where does speculative design start and the gambling and betting end? Behind each fabular frame is a four ratio problem. Each ratio reflects the level of sacrifice and self-restraint a society is willing to accept, against promises of prosperity and freedom. Some values seem to stabilise a frame while others cause collapse. Get the ratios right and we can have it all. Get them wrong and things get more desperate.
"Does Foreign Direct Investment Negatively Affect Preservation of Culture in the Global South? Case Studies in Thailand and Cambodia."
Do elements of globalization, such as Foreign Direct Investment (FDI), negatively affect the ability of countries in the Global South to preserve their culture? This research aims to answer this question by employing a cross-sectional comparative case study analysis utilizing methods of difference. Thailand and Cambodia are compared as they are in the same region and have a similar culture. The metric of difference between Thailand and Cambodia is their ability to preserve their culture. This ability is operationalized by their respective attitudes towards FDI; Thailand imposes stringent regulations and limitations on FDI while Cambodia does not hesitate to accept most FDI and imposes fewer limitations. The evidence from this study suggests that FDI from globally influential countries with high gross domestic products (GDPs) (e.g. China, U.S.) challenges the ability of countries with lower GDPs (e.g. Cambodia) to protect their culture. Furthermore, the ability, or lack thereof, of the receiving countries to protect their culture is amplified by the existence and implementation of restrictive FDI policies imposed by their governments.
My study abroad in Bali, Indonesia, inspired this research topic as I noticed how globalization is changing the culture of its people. I learned their language and way of life which helped me understand the beauty and importance of cultural preservation. I believe we could all benefit from learning new perspectives as they could help us ideate solutions to contemporary issues and empathize with others.
Governor Olli Rehn: Inflation down and recovery supported by interest rate cu...
ccc_2000AR
1. ANNUAL REPORT
2000
W h e r e Tr a d i t i o n a n d Te c h n o l o g y C o m e To g e t h e r
2. COOPER CAMERON
Cooper Cameron is a leading international manufacturer of oil
Where Tradition and Technology
Come Together
and gas pressure control equipment, including valves, wellheads, controls,
chokes, blowout preventers and assembled systems for oil and gas
drilling, production and transmission used in onshore, offshore and
subsea applications. Cooper Cameron is also a leading manufacturer of
centrifugal air compressors, integral gas compressors and turbochargers.
Additional information about the Company is available on Cooper Cameron’s home page
at www.coopercameron.com.
3. 1
FINANCIAL HIGHLIGHTS
($ thousands except per share, number of shares and employees)
Years ended December 31: 2000 1999 1998
Revenues1 $ 1,386,709 $ 1,475,061 $ 1,893,311
Gross margin 411,912 398,785 552,589
Earnings before interest, taxes,
depreciation and amortization (EBITDA)2 214,531 193,051 322,879
EBITDA (as a percent of revenues) 15.5% 13.1% 17.1%
Net income 27,660 43,002 136,156
Net income2 84,224 54,688 151,682
Earnings per share
Basic 0.52 0.81 2.58
Diluted 0.50 0.78 2.48
Diluted2 1.53 1.00 2.76
Shares utilized in calculation of earnings per share
Basic 52,800,000 53,328,000 52,857,000
Diluted 55,013,000 54,848,000 54,902,000
Capital expenditures 66,599 64,909 115,469
Return on average common equity2 10.6% 7.0% 21.7%
As of December 31:
Total assets $ 1,493,873 $ 1,470,719 $ 1,823,603
Total debt 192,272 210,332 413,962
Total debt-to-capitalization 18.6% 22.8% 34.7%
Stockholders’ equity 842,279 714,078 780,285
Shares outstanding 54,011,929 50,567,959 53,259,620
Net book value per share 15.59 14.12 14.65
Number of employees 7,300 7,200 9,300
Revised to reclassify shipping and handling costs from
1
revenues to cost of sales.
Calculated excluding nonrecurring/unusual charges.
2
TABLE OF CONTENTS
Company Profile . . . . . . . . . . . . . . . . . . . . . . . 2
Letter to Stockholders . . . . . . . . . . . . . . . . . . . 3
Cameron . . . . . . . . . . . . . . . . . . . . . . . . . . . . . 8
Cooper Cameron Valves . . . . . . . . . . . . . . . . . .14
Cooper Energy Services . . . . . . . . . . . . . . . . . .18
Cooper Turbocompressor . . . . . . . . . . . . . . . . .22
Management’s Discussion and Analysis . . . . . .25
Report of Independent Auditors . . . . . . . . . . . .33
Consolidated Financial Statements . . . . . . . . . .34
Notes to Consolidated Financial Statements . . .38
Selected Financial Data . . . . . . . . . . . . . . . . . .55
Stockholder Information . . . . . . . . . . . . . . . . . .56
4. 2
COMPANY PROFILE
CUSTOMERS
PRODUCTS
Provides pressure control systems, Oil and gas majors,
Surface and subsea ®
equipment and services for oil independent producers,
production systems,
and gas drilling and production engineering and
blowout preventers,
in onshore, offshore and construction companies,
drilling and production ® ®
subsea applications. drilling contractors,
control systems, gate
rental companies and
valves, actuators,
geothermal energy ®
chokes, wellheads, ®
producers.
drilling and production
riser and aftermarket
parts and services.
PRODUCTS CUSTOMERS
®
Oil and gas majors,
Provides products and services to Gate valves, ball
independent producers,
the gas and liquids pipelines, oil valves, butterfly valves,
engineering and
and gas production and industrial Orbit valves, rotary
®
construction companies,
process markets. process valves, block
pipeline operators,
& bleed valves, plug
drilling contractors
valves, actuators,
® ®
and major chemical,
chokes, and aftermarket
petrochemical and
parts and services.
refining companies.
®
PRODUCTS CUSTOMERS
Integral engine-
Provides products and services to Oil and gas majors,
compressors,
the oil and gas production, gas independent producers,
reciprocating
transmission and process markets. gas transmission
compressors, companies, equipment
turbochargers, leasing companies and
control systems independent power
and aftermarket producers.
parts and services.
PRODUCTS CUSTOMERS
Integrally geared Petrochemical and
Manufactures and services
centrifugal compressors, refining companies,
centrifugal air compression
compressor systems durable goods
equipment for manufacturing ®
and controls. Complete manufacturers, basic
and process applications.
aftermarket services resource, utility, air
including spare parts, separation and chemical
technical services, process companies.
repairs, overhauls and Specific focus on
compressor upgrade automotive, glass,
engineering. textile, electronics, food,
container, pharmaceutical
and other companies
that require oil-free
compressed air.
5. 3
TO THE STOCKHOLDERS OF COOPER CAMERON
We began 2000 with hopes that 1999’s resurgence in oil and gas prices would be sustained
at levels that would support a much-anticipated recovery in spending by our customers.
Midway through, we were encouraged by the demand/supply scenario that appeared to
support a long-term stabilization of prices. By year-end, we were surprised that activity had
not accelerated more strongly and that our backlog remained relatively constant, rather than
increasing. While our order book did not grow as briskly as we originally expected and would
have liked, Cooper Cameron’s profits showed steady improvement during the year.
Financial performance
improves over prior year
Recovery under way,
Revenues totaled $1.39 billion for 2000, down
but at modest pace
almost six percent from 1999’s $1.48 billion. 1999
results, however, included $93 million in rev- Oil and gas prices rose during 2000 to the high-
enues from the rotating compressor business, est levels seen in the past decade. Oil prices spent
which we sold at the end of last year’s third quarter. most of the second half of the year above $30 per
Despite the lower revenue base, earnings before barrel before returning to a more moderate level
interest, taxes, depreciation and amortization in the high 20s by year-end. Natural gas prices
(EBITDA) were up by approximately 11 percent, rose steadily throughout the year, and with the
to $215 million compared with last year’s $193 approaching winter months, broke the $10 per
million. Earnings per share, excluding nonrecur- mcf barrier on the futures market. Oil and gas
ring items, increased from $1.00 to $1.53, up 53 markets have clearly uncoupled, with oil remain-
percent from 1999. The percentage increase in ing a global commodity and North American
EPS exceeded that of EBITDA, primarily because natural gas demand being influenced more and
of lower interest expense as a result of our having more by growing electric power markets fueled by
reduced debt with the proceeds from the sale of natural gas.
the rotating business, as well as the absence of Many expected higher prices to be the catalyst
depreciation and amortization associated with for a rapid recovery in drilling and development
that business. activity by energy producers worldwide.
Although that has been true among certain
customers focusing on natural gas in North
6. 4
America, higher oil prices have not generated
similar increases in spending in most interna-
tional markets. Mergers among major producers,
uncertainty about future hydrocarbon prices,
cautious economic assumptions on large develop-
needs and expectations become the focus of the
ment projects and a measured approach to doing
manufacturing or service effort; data are accumu-
business in new international arenas like West
lated to measure performance versus standards,
Africa appeared to instill an extreme sense
and opportunities are identified for improving
of conservatism in many of our customers
$1,893
$1,817
that performance; and resources are allocated to
during the year.
$1,475
$1,395
$1,387
aggressively address the opportunities.
We like the feel of this energy market. We
The most important resources for the program
believe that the current pace of activity is con-
are the people who execute the plan. Cooper
ducive to a sustained upcycle, and will bring
Cameron began training key personnel in Six
about a relatively longer-term recovery. Spending
Sigma practices in late 2000, and there are already
by our primary customers is forecast to increase
more than 50 projects under way in the various
by approximately 20 percent during 2001; we
96 97 98 99 00
Revenues divisions.
expect to capture a reasonable share of that incre-
($ millions)
We expect these projects to generate meaning-
mental business.
ful contributions to earnings over the next several
Six Sigma program begins years. This will be an ongoing business practice,
not a short-term program.
In September 2000, Cooper Cameron initiated
This effort, combined with Cooper Cameron’s
its Six Sigma program, with a goal of improving
long-time emphasis on quality programs and
manufacturing and service results across each of
“best practices” initiatives, is expected to give rise
the Company’s divisions. Six Sigma has been
to significant improvements in business processes,
successfully implemented in numerous world-
$323
$294
customer satisfaction and overall profitability.
class companies, and the standards and practices
are well-suited to Cooper Cameron’s quality and
$215
$193
Restructuring expected to
$183
customer service goals.
be completed by mid-year 2001
While Six Sigma’s literal definition offers a
We recorded significant nonrecurring charges
statistical measure of variation from the norm,
during 2000 related to ongoing restructuring
the program uses selected tools for evaluating,
96 97 98 99 00
activity in our businesses, particularly in the
measuring and, most importantly, improving
EBITDA Cooper Energy Services (CES) operations. We
processes within an organization. Customer
($ millions)
recognized more than $77 million in nonrecur-
ring charges during the year, including nearly $37
million in non-cash write-offs of assets. About 87
percent of the charges were related to CES.
Included were remaining costs from the 1999
decision to close the Grove City, Pennsylvania
7. 5
Taking advantage of a
healthy balance sheet
At year-end, our balance sheet was as strong as
it’s ever been. Total debt was down to $192 mil-
lion, and our debt-to-capitalization ratio was 18.6
facility; the transfer of equipment and operations
percent. We will continue to seek out acquisition
from Mount Vernon, Ohio to other locations,
opportunities, subject to our usual standards of
including our new facility in Waller, Texas, west of
strategically fitting within the current framework
Houston; and our recent decision to exit the
of our businesses. Such opportunities are difficult
17.1%
16.2%
15.5%
Superior gas engine line and close CES’
to find in a market where the prospects appear so
13.1%
13.1%
Springfield, Ohio plant. That process will continue
encouraging for potential sellers.
into the first half of 2001 and require additional
We may also choose to again repurchase our
charges along the way. Closing these old and
own common shares. We bought approximately
expensive facilities clearly benefits us financially,
3.5 million shares at the end of 1999, at an aver-
and our product and market positions will be
age cost of about $28 per share. One of our stated
96 97 98 99 00
strengthened for the future. Other charges during
objectives is to control our share count through
EBITDA
(as a percent of revenues)
2000 were related to facility closure, restructuring
repurchases, and we would certainly look on any
and workforce reductions in a variety of Cameron
decline in the stock price as an opportunity to
locations, and there were some modest costs associ-
reenter that market.
ated with Cooper Cameron Valves (CCV) and
Cooper Turbocompressor (CTC). Encouraging performances
We separate these charges from our operating
We spend a lot of time dealing with challenges
results because they do not represent an ongoing
across our businesses, and we sometimes forget to
component of doing business and they stem from
acknowledge the successes. Examples of these can
actions separate from day-to-day operations.
$115
be found throughout our operations.
Still, we cringe every time we characterize these
Cameron remains the primary driver of our
items as nonrecurring or unusual, simply because
operating and financial performance, and contin-
$72
$67
$65
they seem to have become a too-regular part of
ues to raise the bar for performance as an indus-
our financial reporting. One of our goals during
$37
try leader. Cameron’s worldwide aftermarket
the first half of 2001 is to record the last of such
initiative, CAMSERVTM, has reinforced Cameron’s
charges. We can’t guarantee there will be no more
role as an industry leader in parts and service, and
96 97 98 99 00
similar charges, but we’ll do our best to wrap up
boosted the aftermarket business to more than
Capital Expenditures
the restructuring process as quickly as possible.
($ millions)
one-third of Cameron’s revenues. We remain a
Still, when we see substantial opportunities to
improve our business, we won’t hesitate to take
decisive action.
8. 6
leading supplier of subsea trees and associated
components for deepwater well completions, and
our blowout preventers and related drilling con-
trols systems are market leaders as well. And in
the surface business—which includes production
equipment installed both on land and on offshore
platforms—we continue to hold the top market
share position worldwide.
equipment and services was not as robust as we
One of the greatest challenges at CES is dealing
$1,894
$1,843
expected, our earnings per share increased by
with demand for Ajax integral engine-compressor
$1,497
$1,406
more than 50 percent during 2000, and we expect
units. North American gas activity has stimulated
$1,303
our financial performance to improve again dur-
customer interest in these gas compression packages.
ing 2001. Meanwhile, the pace of activity in the
Cooper Turbocompressor (CTC) began an
energy business, coupled with OPEC’s apparent
active aftermarket development effort last year,
discipline and a healthy North American gas market,
leveraging off its significant base of installed
is fueling what should be an extended upcycle.
equipment, and customer response has been
96 97 98 99 00
Orders extremely encouraging. The combination of
($ millions)
In closing…
maintenance agreements, OEM parts and
During Cooper Cameron’s first five years as a
enhanced products and services are generating
public company, we experienced a full cycle in the
revenues in an area previously untapped by CTC.
oil service business. We saw activity ramp up
Prepared for the recovery (still) quickly from 1995 to 1997; dealt with the slow-
down, beginning in late 1997 and extending
In my letter last year, I described how we had
throughout 1998; and have seen higher prices and
taken steps that would prepare us for the
growing demand for oil and gas lay the ground-
inevitable return to higher activity levels, driven
$790
$786
$728
work for the current recovery, which is now into
by increased oil and gas prices. Included in that
its second year.
preparation was nearly $100 million of research
$528
$513
While the Cooper Cameron name is a relative
and development spending over the past three
newcomer to the industry, our products and rep-
years. We share the general industry view that
utation are not. We have an outstanding base of
spending on oil and gas exploration and develop-
loyal customers, and we’re grateful for every one
ment has not increased as quickly as most of us
of them. Similarly, and not coincidentally, we
96 97 98 99 00
had anticipated. While the demand for our
Backlog
have a very talented group of people who evalu-
(at year-end, $ millions)
ate, plan and execute our business strategies year
after year—and many of them have been doing so
through several oil and gas cycles. Most of them
are also Cooper Cameron shareholders; so their
goals are faithfully aligned with yours and mine.
They deserve our collective thanks.
9. 7
Lastly, I want to express my personal thanks to Sincerely,
one of our directors, who will retire from our
board at this year’s annual meeting. Michael J.
Sebastian has been on our board since Cooper
Cameron’s formation in 1995, and we were Sheldon R. Erikson
fortunate to reap the benefits of his leadership Chairman of the Board,
and experience over the past five years. President and Chief Executive Officer
On behalf of Cooper Cameron’s employees, we
appreciate your support, and we will do our best
to continue the standards of performance and
profitability your Company has established.
11. 9
STATISTICAL/OPERATING
2000 HIGHLIGHTS
($ millions) 2000 1999 1998
Revenues1 . . . . . . . . . . . . . . . . . . . . . . . . . . . . . . . . . . . . . . . . $838.3 $817.1 $1,024.7
EBITDA2 . . . . . . . . . . . . . . . . . . . . . . . . . . . . . . . . . . . . . . . . . 148.7 139.3 215.0
EBITDA (as a percent of revenues) . . . . . . . . . . . . . . . . . . . . . . 17.7% 17.0% 21.0%
Capital expenditures . . . . . . . . . . . . . . . . . . . . . . . . . . . . . . . . 38.6 38.8 82.0
Orders . . . . . . . . . . . . . . . . . . . . . . . . . . . . . . . . . . . . . . . . . . 851.4 619.5 1,074.9
Backlog (as of year-end). . . . . . . . . . . . . . . . . . . . . . . . . . . . . . 372.3 367.0 592.6
Revised to reclassify shipping and handling costs
1
from revenues to cost of sales.
Excludes nonrecurring/unusual charges.
2
$1,025
$838
$817
Cameron is one of the world’s leading providers of
systems and equipment used to control pressures
98 99 00
and direct flows of oil and gas wells. Products Revenues
($ millions)
include wellheads, Christmas trees, controls, chokes,
$215
blowout preventers and assembled systems,
$149
$139
employed in a wide variety of operating
environments—basic onshore fields, highly 98 99 00
EBITDA
($ millions)
complex onshore and offshore environments, $1,075
deepwater subsea applications and ultra-high $851
$620
temperature geothermal operations.
98 99 00
Orders
($ millions)
$593
< The model “TL” is a lightweight version of the industry’s
most popular and widely used ram-type blowout preventer.
$372
$367
98 99 00
Backlog
(at year-end, $ millions)
12. 10
Cameron’s drilling business remains committed to providing innovative systems solutions
to allow safer, more cost-effective and reliable drilling for its global customers.
Financial overview Cameron’s leading market position in Among recent operational successes,
this business segment provides a large Shell Shearwater, a High Pressure/High
Cameron’s revenues increased to $838.3
installed base requiring aggressive world- Temperature platform in the North Sea,
million in 2000, up three percent from
wide aftermarket support, which results in was commissioned during 2000 using
$817.1 million in 1999. EBITDA (excluding
higher margin and better flowthrough Cameron 5″ 15,000 psi surface Christmas
nonrecurring charges) was up from
sales volume. New business sales will con- trees, including Cameron wellheads, actu-
year-ago levels, reaching $148.7 million,
tinue to shift from the large-bore subsea ators and chokes. More recently, Cameron
compared with 1999’s $139.3 million.
and deepwater market, which fueled provided six platform wellheads and trees
EBITDA as a percent of revenues was 17.7
major drilling business growth from 1997 and assisted in the engineering and start-
percent, up from 17.0 percent.
through 1999, to platform, jackup, land, up of Anadarko’s high-profile Hickory
and specialty blowout preventer tech- and Tanzanite projects offshore Louisiana.
Drilling
nology. For example, Cameron recently Equipment for this high-pressure develop-
Cameron provides surface and subsea received several orders for large-bore sur- ment was delivered on a fast-track schedule,
blowout preventer (BOP) stacks, drilling face-based BOP stacks, including several and production began in December.
riser, drilling valves and choke and kill platform stacks to be delivered into the Operators and industry experts alike
manifolds, as well as hydraulic and multi- Norwegian market. Orders for this equip- remain bullish on the fundamentals for
plexed electro-hydraulic (MUX) control ment are projected to be at the highest natural gas in North America. With con-
systems used to operate surface and subsea level since the early 1980s. tinued high levels of drilling activity
BOP stacks, to multiple customers in the anticipated in key gas-producing regions
drilling business worldwide. Cameron Surface like the Northern Rockies, onshore
also provides complete aftermarket services and offshore Louisiana, the Canadian
Surface equipment represents the
under the CAMSERV™ brand and Foothills and South Texas, Cameron’s
largest component of Cameron’s revenue
replacement parts for drilling equipment, market presence and quality reputation
base, and includes wellheads, Christmas
including elastomer products specifically should allow it to take full advantage of
trees and chokes used on land or installed
designed for drilling applications and increasing demand for surface products.
on offshore platforms. Cameron holds
manufactured at Cameron’s state-of-the-
the leading market position in supplying
art Elastomer Technology facility. Subsea
this type of equipment. Cameron also
Cameron’s drilling business remains
Subsea equipment includes systems,
recently increased its emphasis on supplying
committed to providing innovative systems
products and services associated with
control systems for surface markets.
solutions to allow safer, more cost-effective
underwater drilling and production appli-
The oil and natural gas price recovery
and reliable drilling for its global customers.
cations, including subsea wellheads, mod-
has driven improving demand for
Drilling business revenues decreased in
ular Christmas trees, chokes, manifolds,
Cameron’s surface products. Both majors
2000 compared with 1999, as large-bore
flow bases, modular CAMTROLTM control
and independent operators in North
subsea BOP stacks, MUX control systems,
systems, and flowline connection systems.
America spurred an increase in spending
and drilling riser orders were substantially
The subsea market is another area in
which drove U.S. and Canadian rig counts
completed and delivered for the recent
which Cameron holds a leading share of
to new ten-year highs, with natural gas
newbuild cycle of Mobile Offshore
the installed base worldwide and is one of
drilling the main driver. In this environment,
Drilling Units. Cameron will continue
the primary providers to the industry.
Cameron’s market-leading position as the
to provide the best value delivered for
Highlights of Cameron’s business in this
premier supplier of high pressure surface
drilling systems, maintain its core compe-
market during 2000 included the award
wellheads and trees led to record highs in
tency in this important business segment,
and delivery of the Triton Energy Ceiba
North American surface products orders.
and look to continuous improvement
development off Equatorial Guinea in West
Tightening availability of products and
with regard to reliability and availability
Africa. Cameron’s systems capabilities
personnel justified Cameron’s decision to
of the overall system. With this in mind,
enabled Triton Energy to achieve first oil
implement price increases in the North
a Six Sigma statistically based quality
from Ceiba less than fourteen months
American markets during the fourth
improvement process has been imple-
after field discovery, which set an industry
quarter of 2000. This increase should be
mented. This process is aimed at break-
record for a deepwater development.
reflected in the Company’s results begin-
through improvements in the performance
Cameron’s scope of work includes overall
ning in early 2001, and the impact should
and product commercialization of the
systems engineering and project manage-
become more apparent during the year as
drilling business. The first such project is
previous supply contracts are renewed at
scheduled for completion early in 2001.
the new price levels. Cameron’s focus on
Other projects have been started or are
product quality and service responsiveness
under review.
should assist in the retention of price-sen-
sitive customers.
13. 11
The subsea market is another area in which Cameron holds a leading share of the
installed base worldwide and is one of the primary providers to the industry.
ment, as well as modular SpoolTrees, facilities in the Gulf. In the international Controls’ CAMTROL production control
modular CAMTROL production control arena, Cameron was awarded BG’s system a technical rating higher than all
systems, manifolds, flow bases, subsea Scarab/Saffron project, including subsea other major competitors’ subsea production
wellheads, and pipeline connection trees and related hardware to be installed control systems. Deliveries were completed
systems. The system was designed and offshore Egypt. in 2000 for three major projects: Shell
integrated using MOSAICTM philosophy, Order inquiry and project planning Malampaya, Texaco Captain and Triton
Cameron’s field-proven modular building activity for large-scale subsea projects has Energy Ceiba.
block solution for subsea systems. been at very high levels in 2000 and is Recent new awards for subsea produc-
An equally significant project for expected to continue in 2001. Project tion control systems include Repsol’s
Cameron is the Shell Malampaya Natural activity has been greatest in deepwater Chipiron project in Spain, and Petrobaltic’s
Gas to Power Project, served by Cameron’s areas of the Gulf of Mexico and West development in Poland.
Singapore facility. The Malampaya devel- Africa. Project sanction and order book- Cameron Controls’ two primary manu-
opment will reliably supply natural gas ings have been delayed in both Nigeria facturing, assembly and testing facilities,
directly to three land-based power stations and Angola, however, due to difficulties in in Celle, Germany and Houston, Texas,
that provide more than a third of the negotiation with host governments and completed their second full year of opera-
power requirements for the Philippines. state oil companies over terms and tion in 2000. The new facilities have
This MOSAIC system scope of supply conditions of participation and project succeeded in reducing lead times, increas-
includes modular SpoolTrees, modular control. Project potential for Cameron ing on-time deliveries and improving
CAMTROL production and workover and other critical equipment suppliers is effective manufacturing capacity. The
control systems, subsea wellheads, chokes, unprecedented, with individual projects locations of the two facilities allow
manifolds, flow bases, and pipeline con- ranging in size from $50 million to more Cameron Controls to conveniently serve
nection systems. The system is designed to than $200 million. and support markets worldwide, including
be fault-tolerant so as to ensure a highly West Africa, the North Sea, South America,
reliable gas supply. Cameron Controls Asia Pacific and the Gulf of Mexico.
Finally, the installation and start of Cameron Controls expects to exploit
Although Cameron Controls was
operations of the Texaco Captain subsea opportunities in the controls market
organized as a separate business unit only
development in the United Kingdom sec- in several areas during 2001. CAMTROL
four years ago, Cameron has been in the
tor of the North Sea represents another will be expanded to include all of
controls business since the late 1970s.
milestone. Another MOSAIC solution, Cameron’s controls capabilities, including
Drawing on a long history of research and
Captain’s scope of supply includes production, drilling and workover.
field experience, the Cameron Controls
Christmas trees, modular CAMTROL Continued product development in sub-
organization was formed to design, man-
production control systems, subsea well- sea production controls, bolstered by the
ufacture and service drilling, production
heads, chokes, and a joint venture with successful installation of the projects iden-
and workover control systems worldwide.
Brown & Root providing a football field- tified above, will strengthen and expand
Its early growth was fueled by orders for
sized unitized template manifold. the Company’s market position and product
MUX subsea drilling controls, combining
In each of these endeavors, Cameron’s offerings. The common threads for all
Cameron’s reliable hydraulics with elec-
responsibilities encompassed overall systems CAMTROL systems are modularity, fault
tronic technology to provide the rapid
engineering and project execution. tolerance and integrity assurance to pro-
actuation needed for BOPs in deepwater
In recent activity, Cameron was awarded vide high reliability systems. The drilling
drilling applications. Upgrading Cameron’s
Marathon’s Camden Hills and Total Fina controls focus will be on maintaining
subsea production controls technology
Elf ’s Aconcagua projects in the Gulf of Cameron’s leading market position,
with the state-of-the-art CAMTROL
Mexico. Along with the previously award- attained as a result of providing reliable,
system was a logical extension of
ed BP King/King’s Peak project, this will cost-effective systems for the BOP market,
Cameron’s drilling controls technology.
be the deepest subsea development in the and on enhancing that position by further
CAMTROL now incorporates Cameron’s
world at water depths of more than 7,000 improving the product selection to
drilling control systems and industry-
feet, marking another Cameron first. include innovative emerging market
leading workover control systems.
Cameron was also awarded the subsea drilling controls applications. As a logical
Cameron Controls’ role as a world-class
trees, manifolds and jumpers for BP’s Gulf extension of the above, aftermarket capa-
supplier is confirmed by its current
of Mexico Infrastructure Lead Exploration bilities will be expanded in several markets,
position as the leading supplier of deep-
(ILX) project,a program targeted to increase including Brazil and West Africa, in
water MUX control systems to the drilling
production from numerous pre-existing order to support the growing number of
market. E&P operators are beginning to
controls systems installations worldwide.
recognize Cameron Controls as a signifi-
cant and qualified provider of production
control systems worldwide. In fact, one
of the supermajors awarded Cameron
14. 12
The oil and natural gas price recovery has driven improving
demand for Cameron’s surface products.
Cameron Controls’ customer support and the unique position to supply wellheads,
response effort will benefit from the related Christmas trees, valves, actuators, chokes
CAMSERV efforts and Cameron’s extensive and surface safety systems, the building
network of service facilities. As the largest blocks necessary to provide a complete
global provider of system maintenance single-well surface-automated system.
and support for drilling and production Cameron Willis will continue to grow
systems, Cameron provides the depth and with the offshore markets as projects are
breadth of facilities, equipment, personnel developed in deeper water, creating an
and experience that is required of a cus- ever-increasing demand for this level of
tomer-centric organization. technology, experience and breadth of
product solutions. As surface and subsea
Cameron Willis production activity improves in the wake
of higher oil and gas prices, substantial
Cameron Willis’ product portfolio
opportunities for new orders should
includes Cameron and Willis brand
develop during 2001.
drilling choke systems, and Cameron and
Willis brand chokes and choke actuators
Aftermarket
for the surface and subsea production
markets. Cameron Willis was created in Aftermarket revenues, which have
order to take advantage of opportunities for consistently produced attractive profit
manufacturing consolidation, technology margins (as a result of customers’ willingness
improvement and product cost reduc- to share the life cycle cost reductions
tions. As a result, Cameron Willis has clearly achieved through the application of
established its position as the worldwide CAMSERV), continued to increase as a
market share leader in subsea chokes. percent of total revenue. Meanwhile,
Gate valve actuator product rationaliza- Cameron’s worldwide market share has
tion and manufacturing consolidation, continued to increase, particularly in the
processes completed during 1999, have drilling business.
resulted in lower manufacturing costs in Cameron continues to enhance its
2000. Surface gate valve actuator manu- market presence worldwide. Construction
facturing is primarily provided by the of a new joint venture facility in Saudi
Houston operation, which now accounts Arabia will be completed by the end of
for half of the Cameron Willis shipments. 2001 and will expand Cameron’s after-
Increased focus on actuator manufacturing market capabilities in the Middle East.
lead times and consistently high on-time Efforts will continue to grow the aftermarket
delivery performance from Cameron business through acquisitions, increased
Willis has all but removed the delays penetration of existing markets and identi-
caused by commercial actuator manufac- fication of new markets that can be served
turers, enabling Cameron to shorten the by Cameron’s extensive worldwide facilities.
>
lead times of its Christmas trees. Cameron’s CAMSERV initiatives are
Function testing of a 4 1/16″ API 15,000 psi
Surface Safety Systems that control sur- designed to provide flexible, cost-effective
face actuated gate valves and Christmas solutions to customer aftermarket needs Christmas tree, complete with tubing spool
trees supplied by Cameron continue to be throughout the world. CAMSERV com- and hanger, prior to shipment to Anadarko
a growth market. Cameron’s leading position bines traditional aftermarket services and
Petroleum Corporation’s Hickory platform.
in the surface production (Christmas tree) products, such as equipment maintenance
markets and operators’ desire to automate and reconditioning, with Cameron’s infor-
field operations, thereby lowering operating mation technology toolset. As operators
expenses, make this a natural extension to continue to look for ways to reduce
Cameron’s core business. Cameron is in drilling, completion and production costs,
additional opportunities to provide such
services to customers will develop.
17. 15
STATISTICAL/OPERATING
2000 HIGHLIGHTS
($ millions) 2000 1999 1998
Revenues1 . . . . . . . . . . . . . . . . . . . . . . . . . . . . . . . . . . . . . . . . $221.1 $233.6 $311.8
EBITDA2 . . . . . . . . . . . . . . . . . . . . . . . . . . . . . . . . . . . . . . . . . 37.1 33.4 60.9
EBITDA (as a percent of revenues) . . . . . . . . . . . . . . . . . . . . . . 16.8% 14.3% 19.5%
Capital expenditures . . . . . . . . . . . . . . . . . . . . . . . . . . . . . . . . 6.0 4.9 5.6
Orders . . . . . . . . . . . . . . . . . . . . . . . . . . . . . . . . . . . . . . . . . . 228.3 209.8 279.5
Backlog (as of year-end). . . . . . . . . . . . . . . . . . . . . . . . . . . . . . 42.5 32.4 54.4
Revised to reclassify shipping and handling costs
1
from revenues to cost of sales.
Excludes nonrecurring/unusual charges.
2
$312
$234
$221
Cooper Cameron Valves (CCV) is a leading provider
of valves and related systems primarily used to 98 99 00
Revenues
($ millions)
control pressures and direct oil and gas as they
are moved from individual wellheads through flow
$61
$37
$33
lines, gathering lines and transmission systems
to refineries, petrochemical plants and industrial 98 99 00
EBITDA
($ millions)
centers for processing. Equipment used in these
$280
environments is generally required to meet $228
$210
demanding API 6D and American National
Standards Institute (ANSI) standards.
98 99 00
Orders
($ millions)
$54
< Orbit high-integrity valves being readied for shipping.
$42
Orbit’s unique block valve technology provides absolute
$32
positive isolation for a multitude of processes in the gas
processing, petrochemical and refining industries. The
Orbit design is particularly well-suited for applications
demanding long-term performance where frequent 98 99 00
cycling and positive shutoff are of primary importance.
Backlog
(at year-end, $ millions)
18. 16
CCV believes that it is well positioned to benefit from future deepwater activity worldwide
and is proving to be a leader in technology development in this critical environment.
Financial overview Focus on aftermarket continues ductivity improvements in manufacturing
contributed to a higher profit percentage.
CCV’s orders were up approximately Aftermarket growth continued to be
Investment in more efficient equipment,
nine percent during the year, driven a priority throughout the year, with
as well as ongoing analysis of workflows
primarily by growth in the oilfield market. revenues in this area more than doubling
and setup times, enabled the Company to
Revenues were $221.1 million for the year, over 1999. CCV significantly expanded its
further decrease costs.
down five percent from 1999’s $233.6 field services efforts throughout the year,
million. EBITDA (excluding nonrecurring and also acquired Valve Sales Inc., a
2001 outlook
charges) increased to $37.1 million, up 11 Houston-based valve repair company,
percent from the $33.4 million of a year in the first quarter of 2000. CCV will In 2001, CCV is prepared for increased
ago. EBITDA as a percent of revenues continue to evaluate new aftermarket ini- spending activity in its primary pipeline
increased to 16.8 percent, up from 1999’s tiatives, including additional acquisitions market and significant growth in the oil-
14.3 percent. The increased profit margin and grassroots start-ups, in both domestic field. The higher activity levels in CCV’s
in 2000 reflects a full year’s impact of the and international markets. traditional markets will be complemented
cost reduction initiatives that were started by opportunities in the rapidly growing
in 1999, significant productivity improve- Other growth initiatives underway deepwater market, the power generation
ments and a price increase that was initiated sector, and initiatives in the aftermarket
Activity in the power generation sector
in the third quarter of 2000. business. The Company will continue
is expected to be robust in 2001. Based on
Operations restructuring was essentially its foreign sourcing and productivity
a bullish construction outlook, CCV is
completed during 2000 in both Europe improvement programs into 2001, including
dedicating additional resources to sales
and North America. Some minor restruc- an increased capital investment budget
efforts in this market segment. In addition,
turing continues in the Beziers, France designed to reduce lead times and overall
CCV plans to introduce a low-cost butterfly
operation, and CCV has targeted the Far manufacturing cost.
valve as part of the Company’s efforts to
East as a location for future manufacturing broaden its product line. This valve will
due to the low cost of labor and material complement CCV’s existing high-per-
in that region. formance butterfly valve and will be sold
into the industrial and oilfield markets.
Emphasis on subsea market
CCV’s recent product development Investment in
efforts in the subsea market have further web-based technology
enhanced the Company’s position as an CCV views web-enabled electronic
industry technology leader. Development commerce as a powerful tool in streamlining
was completed for a range of ball valves >
operations and communicating with the
capable of performing at pressures of customer. In addition to its existing web- As subsea production depths have continued to
10,000 psi and in water depths of 10,000 site and participation in the OFS Portal increase, Cooper Cameron Valves has recognized
feet. In addition, CCV is part of a consor- initiative, CCV intends to launch a valve
the need for subsea ball valves suitable for the
tium of industry suppliers who have configurator and quotes management system
rigorous demands of high external and internal
developed a technology that enables hot for use by both CCV’s internal sales group
pressures. To meet these challenging require-
tapping of pipelines in water depths down and customers. Both products will enhance
ments, CCV has introduced a line of 2″ to 16″
to 10,000 feet. CCV believes that it is well the ease of doing business with CCV.
ball valves suitable for 10,000 psi of internal
positioned to benefit from future deepwater
pressure and for use in water depths of as
activity worldwide and is proving to be a Foreign sourcing
much as 10,000 feet.
leader in technology development in this and productivity improvements
critical environment. The prototype shown here utilizes the proven
In addition to the Six Sigma program,
technology of the industry-leading Cameron
CCV has continued to aggressively source
welded-body ball valve, and incorporates existing
foreign materials in an effort to reduce
metal-to-metal seat sealing technology. The
product cost while maintaining high
compact, lightweight design of the Cameron
quality standards. Agreements reached
welded-body ball valve make it ideally suited
with suppliers in other countries have
for subsea applications.
contributed to a significant reduction in
material purchase prices. Similarly, pro- Orders are currently in production for a subsea
project in the Gulf of Mexico and for topside use
in South America.
19. 17
CCV’s recent product development efforts in the subsea market have further
enhanced the company’s position as an industry technology leader.