This document summarizes a presentation on climate change given to the Michigan Energy Forum. It addresses the following key points:
- The presentation discusses the four central questions around climate change: is it occurring, what is causing it, what will be the consequences, and what should we do about it.
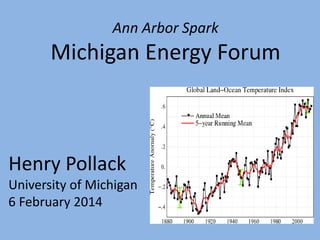
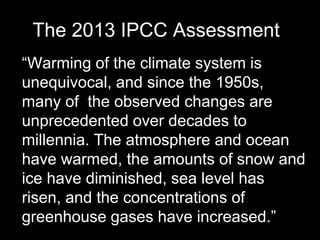
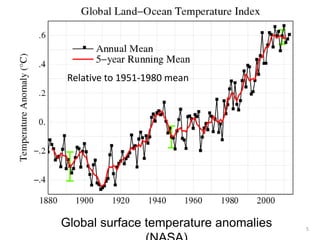
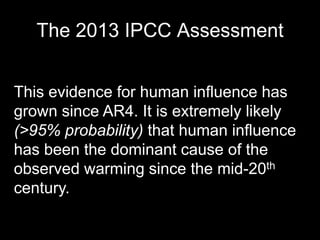
- It reviews evidence from the IPCC and other scientific studies that warming trends are unequivocal and human activity is extremely likely the dominant cause of warming since 1950.
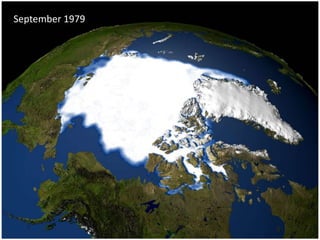
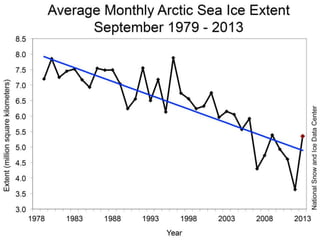
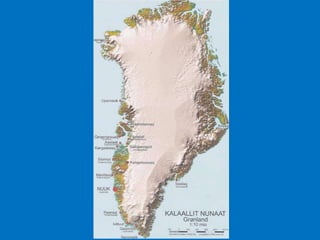
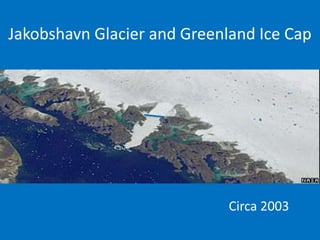
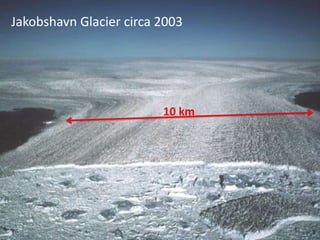
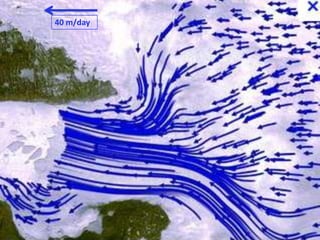
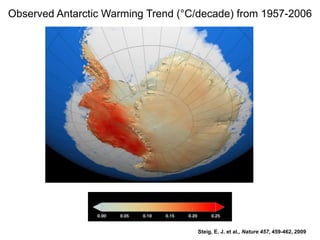
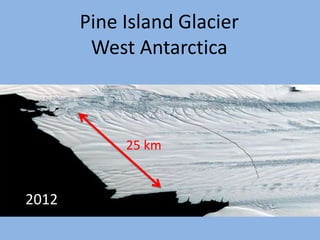
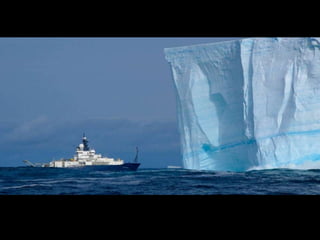
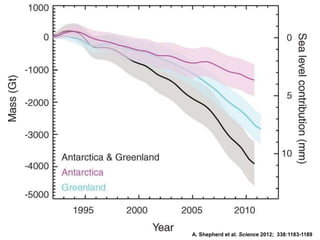
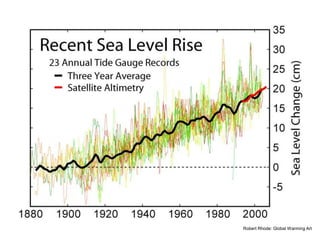
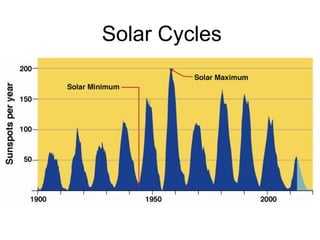
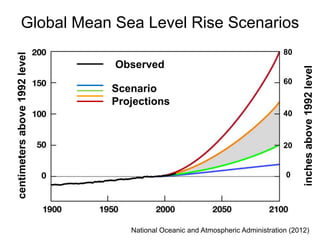
- Examples of effects like rising temperatures, sea levels, and shrinking glaciers and ice sheets are presented.
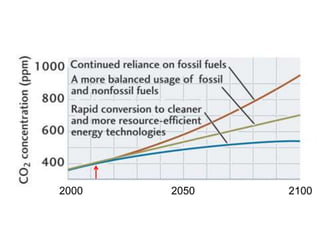
- The presentation discusses potential economic and environmental consequences of climate change if left unaddressed.
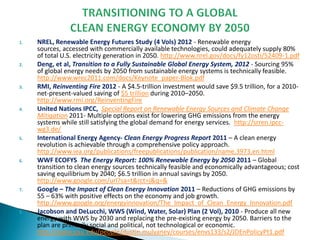
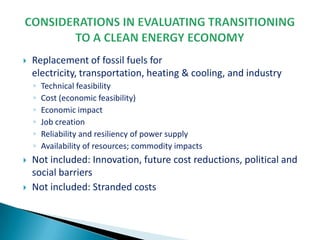
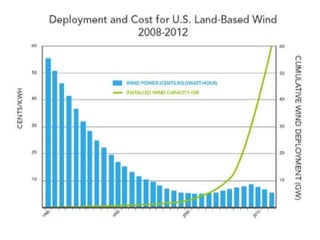
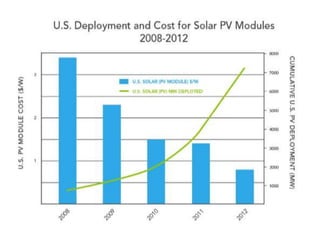
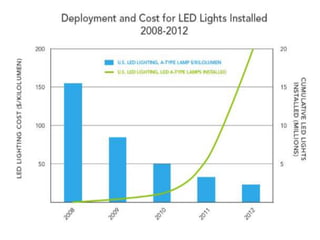
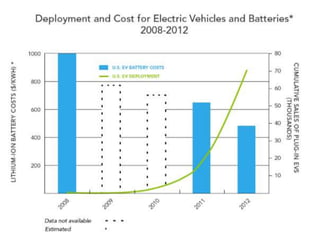
- It argues that transition