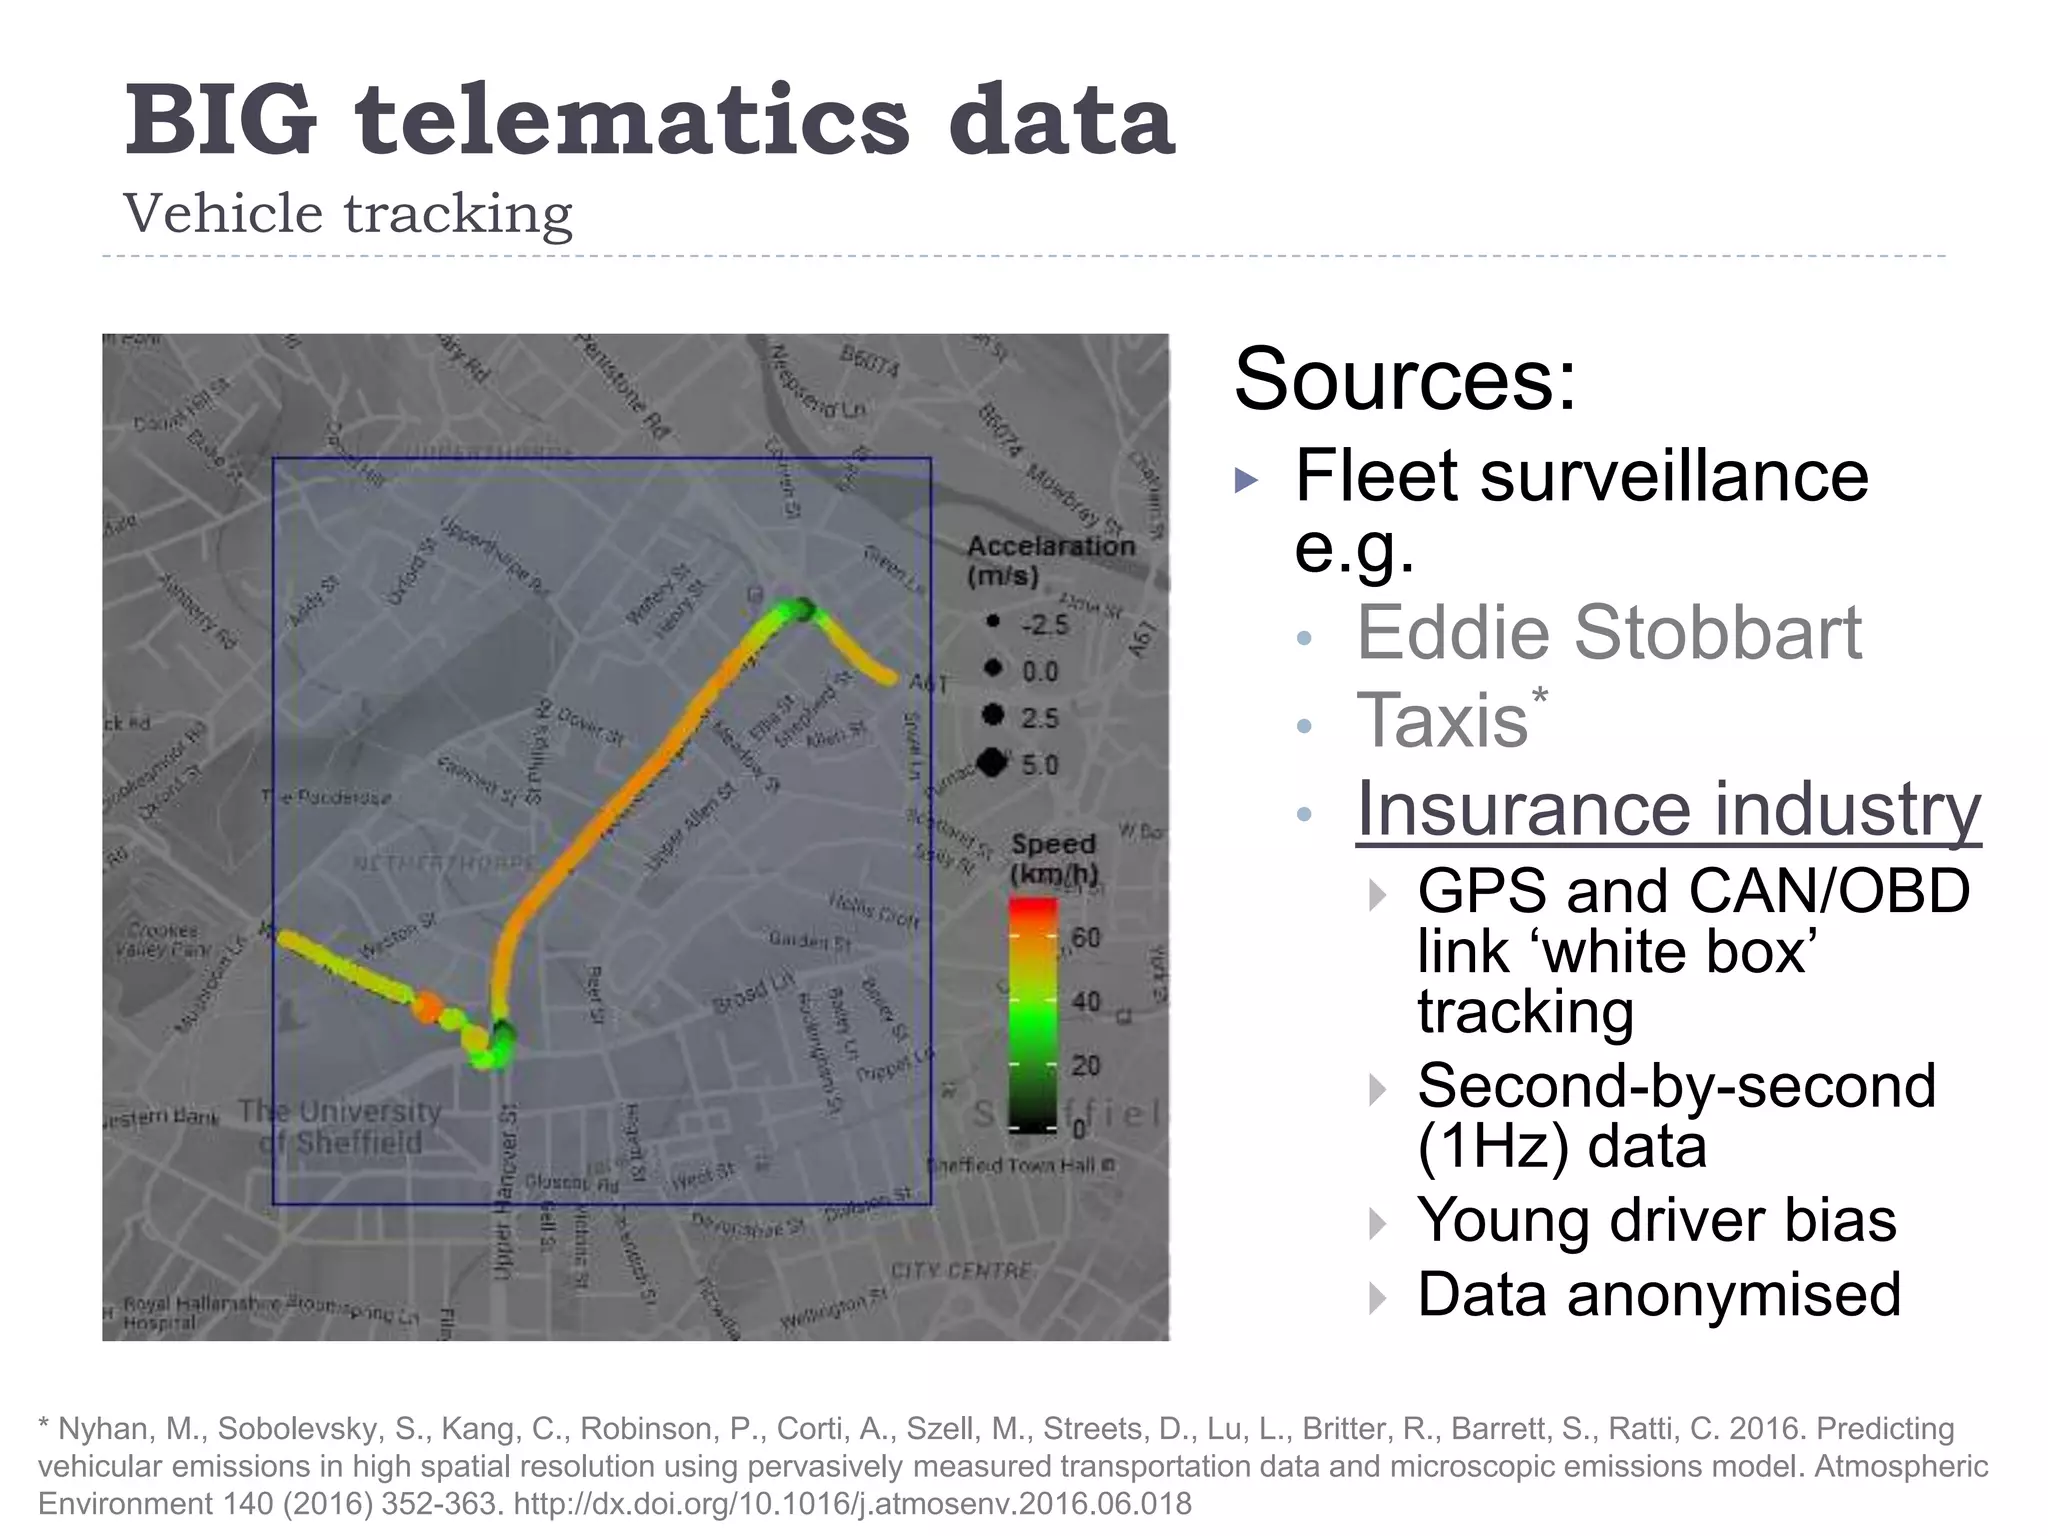
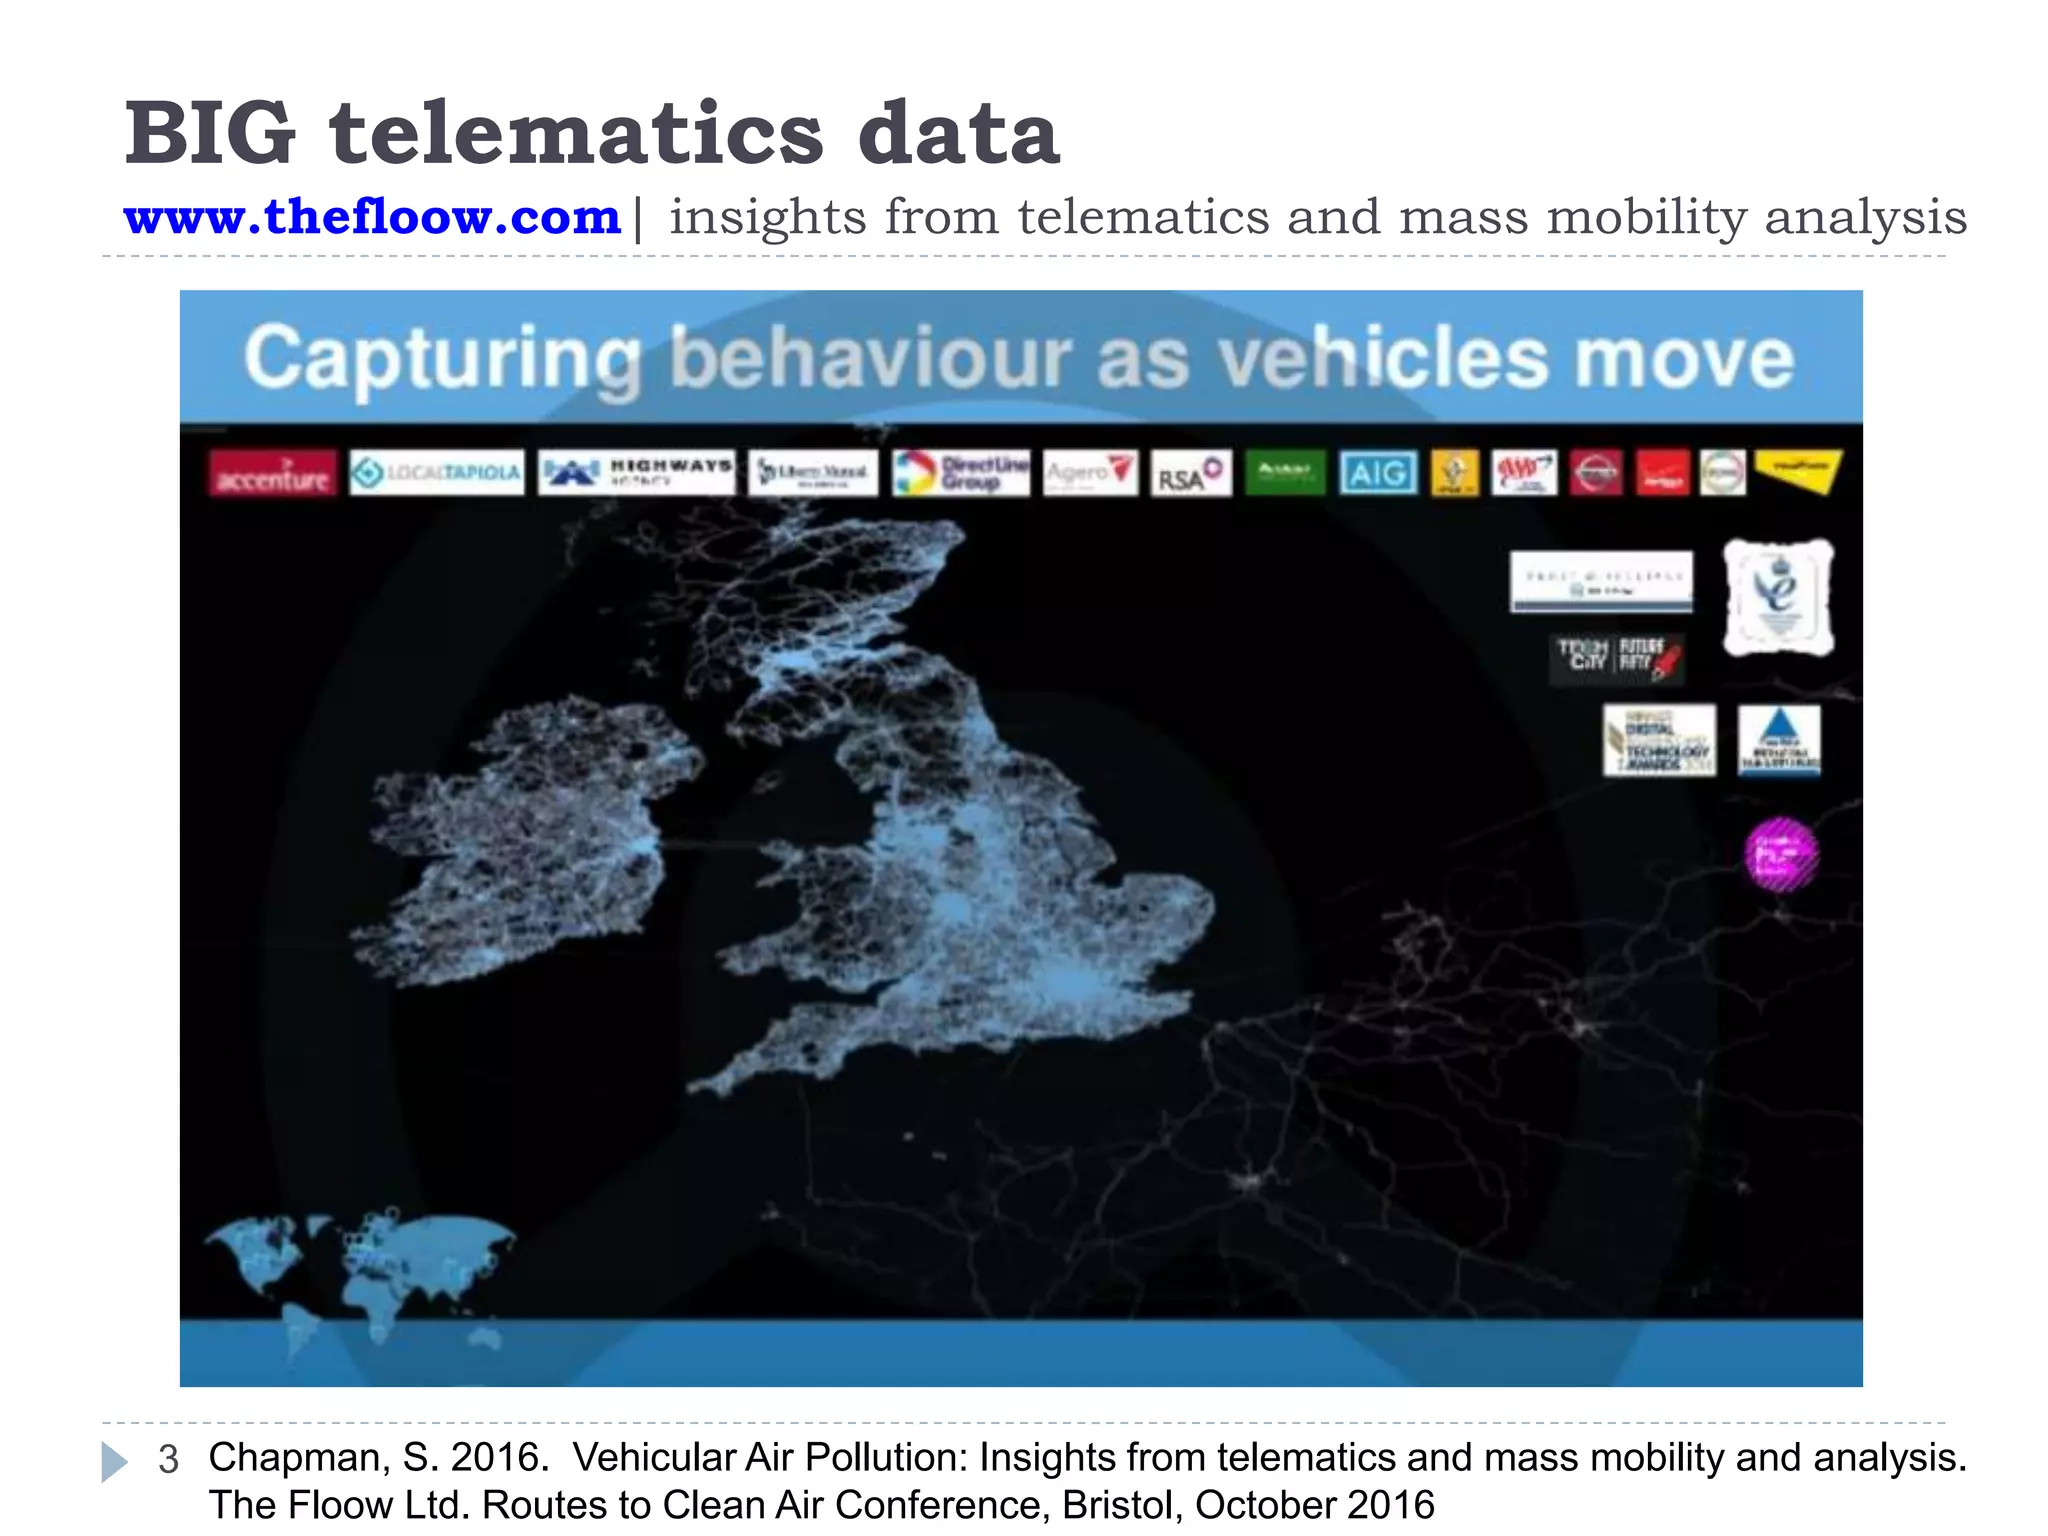
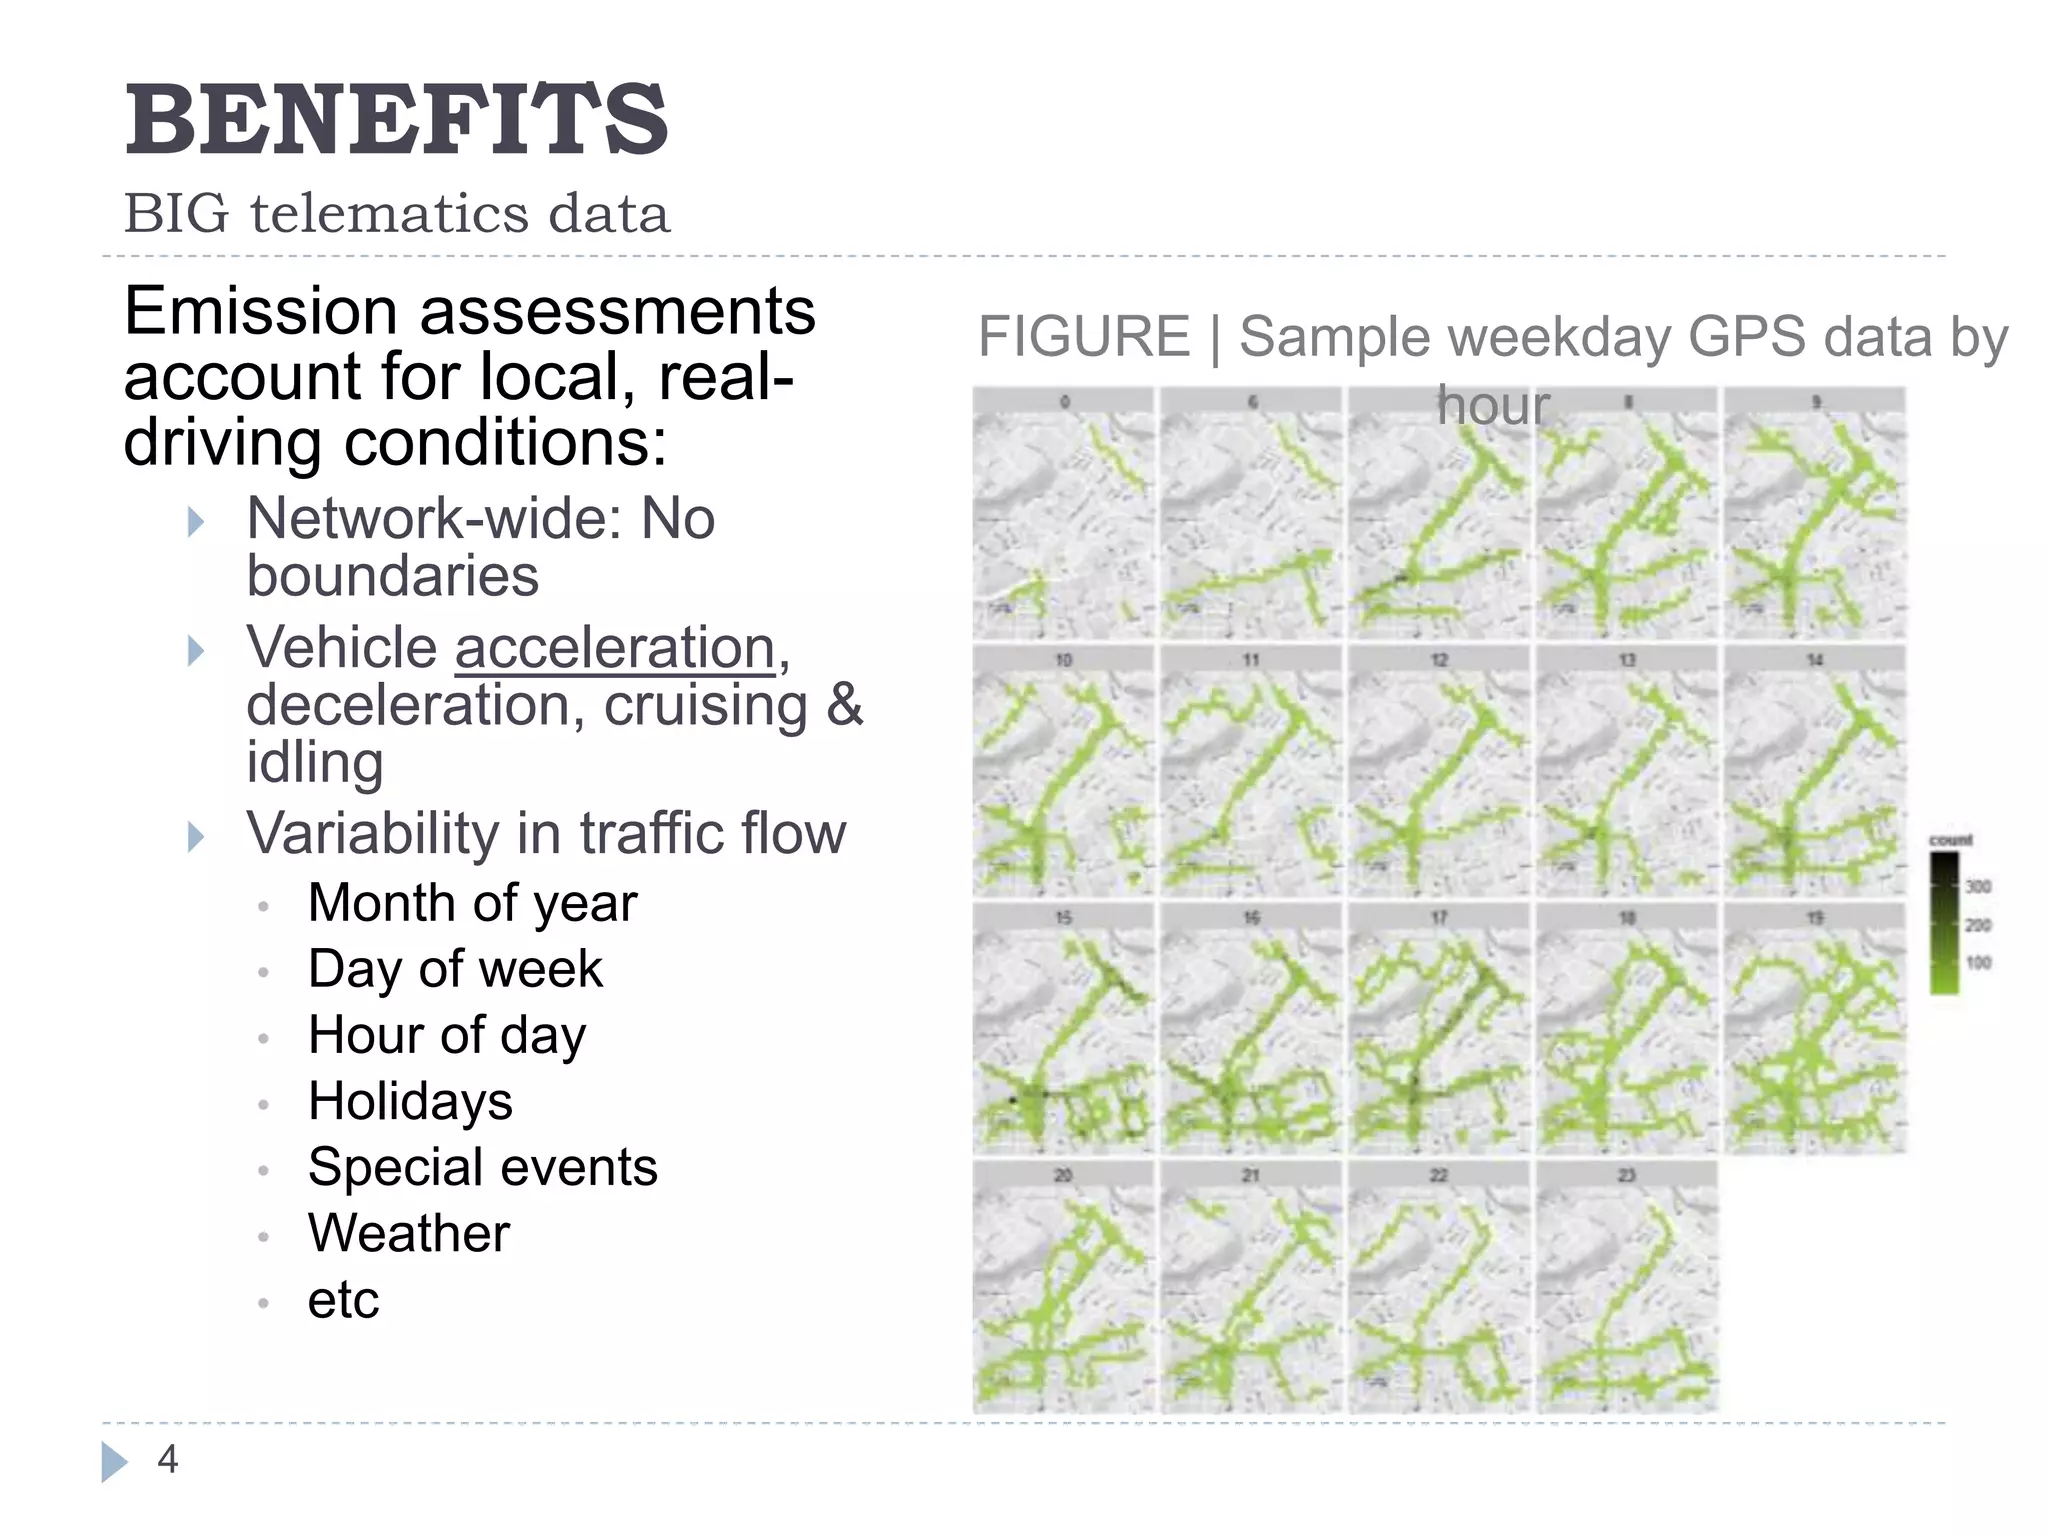
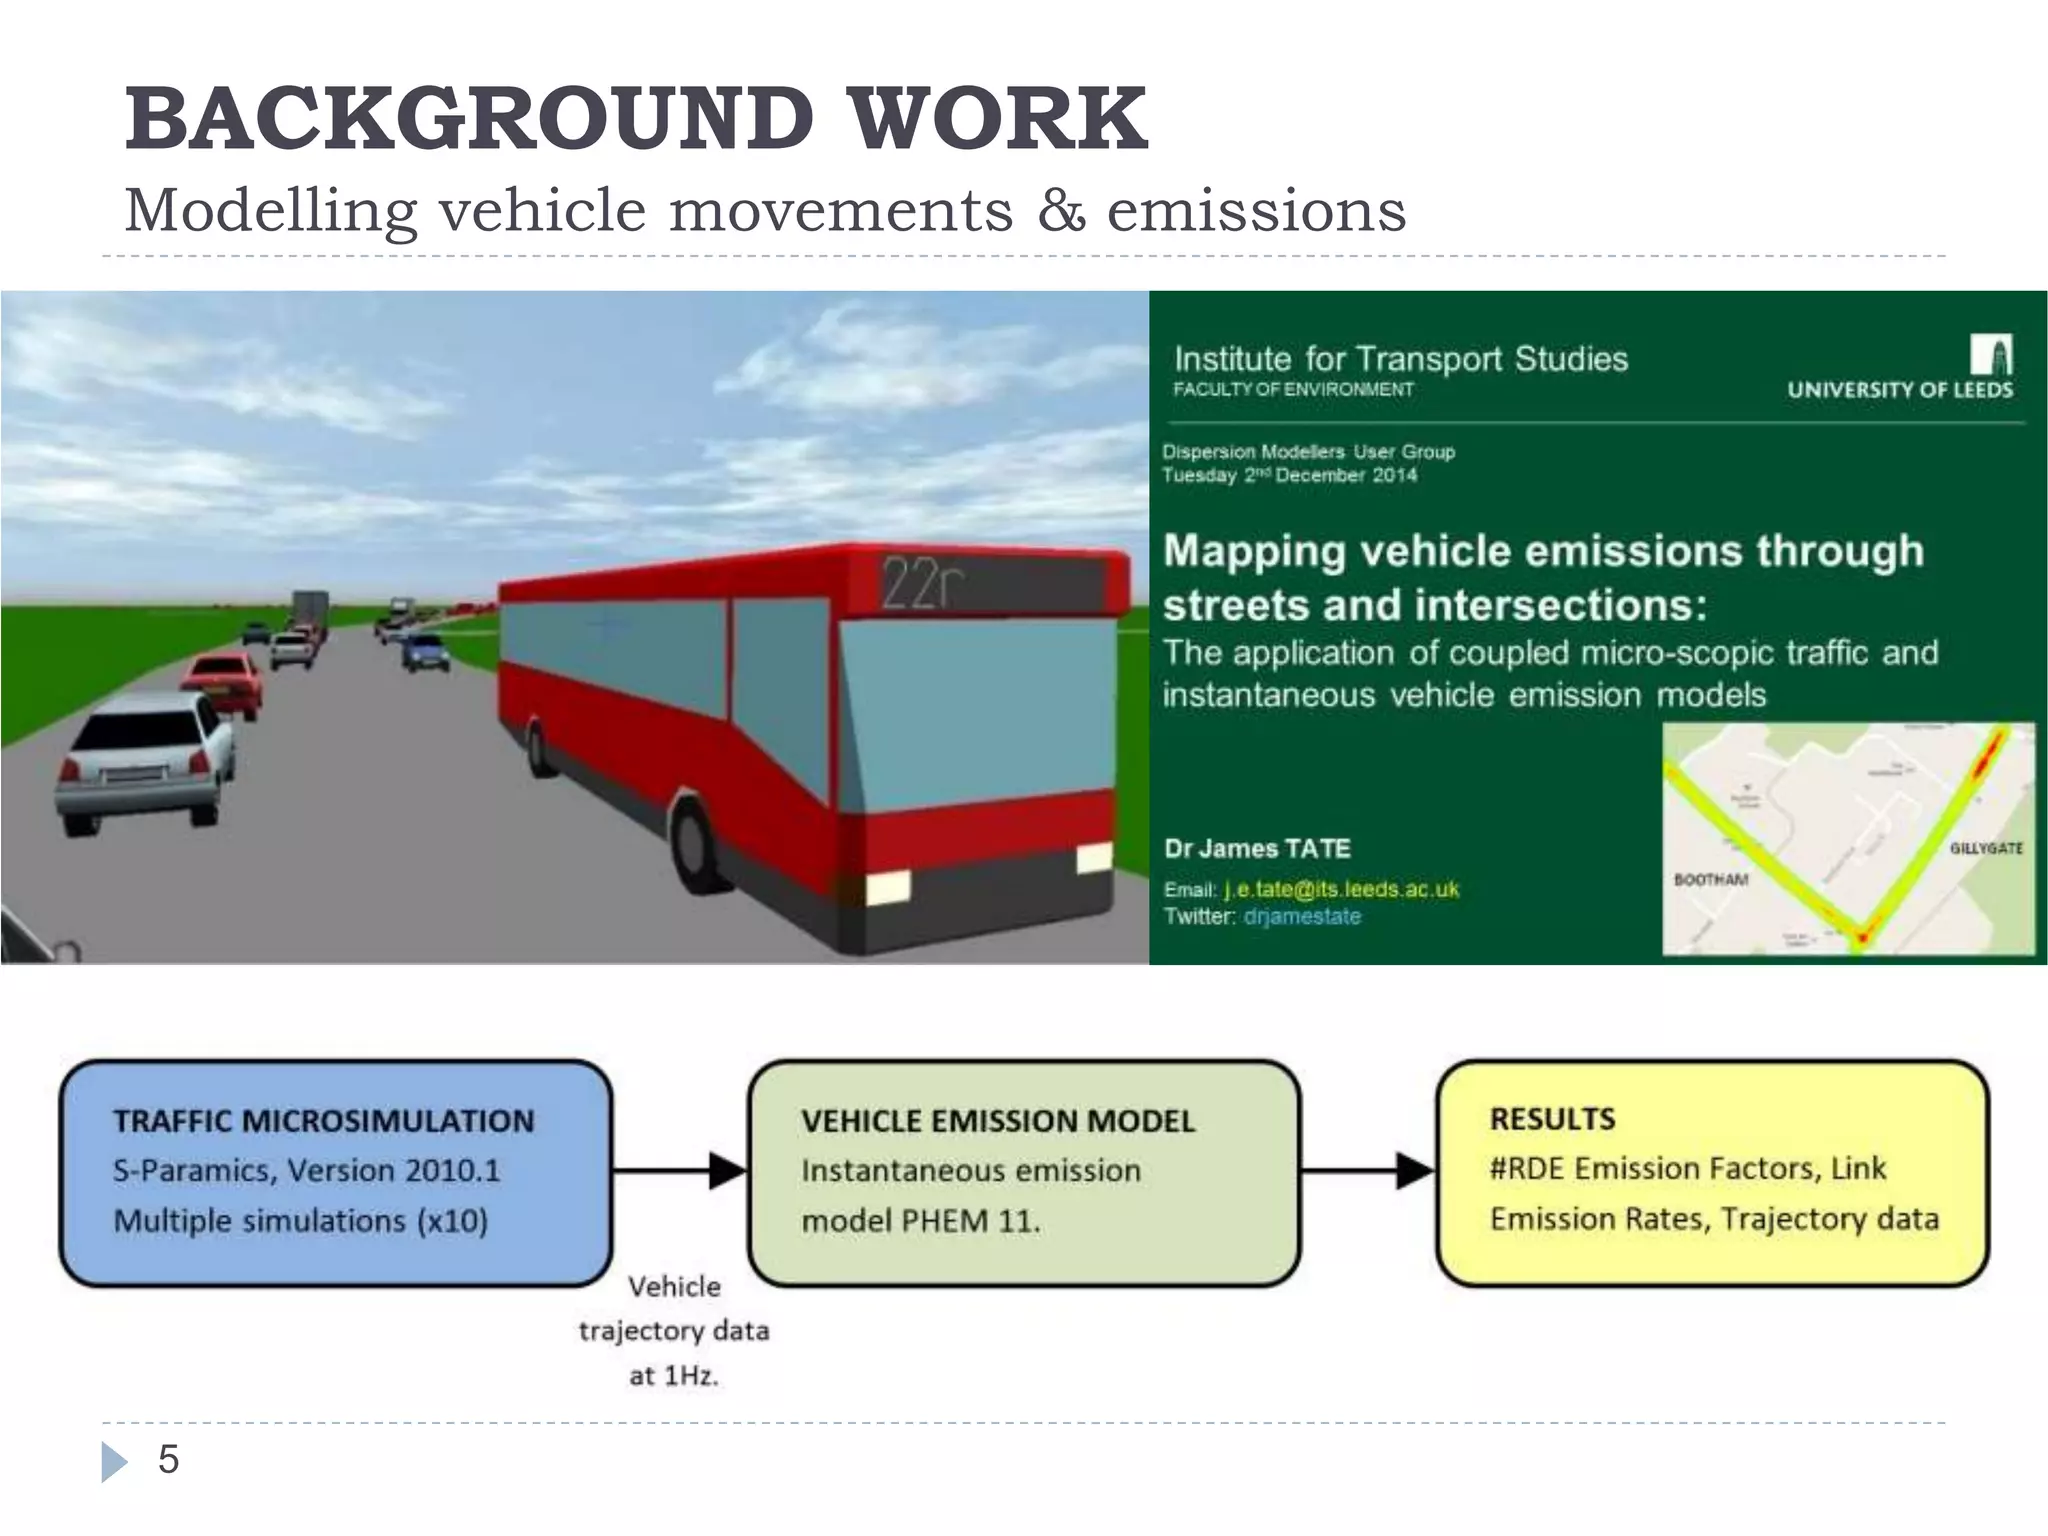
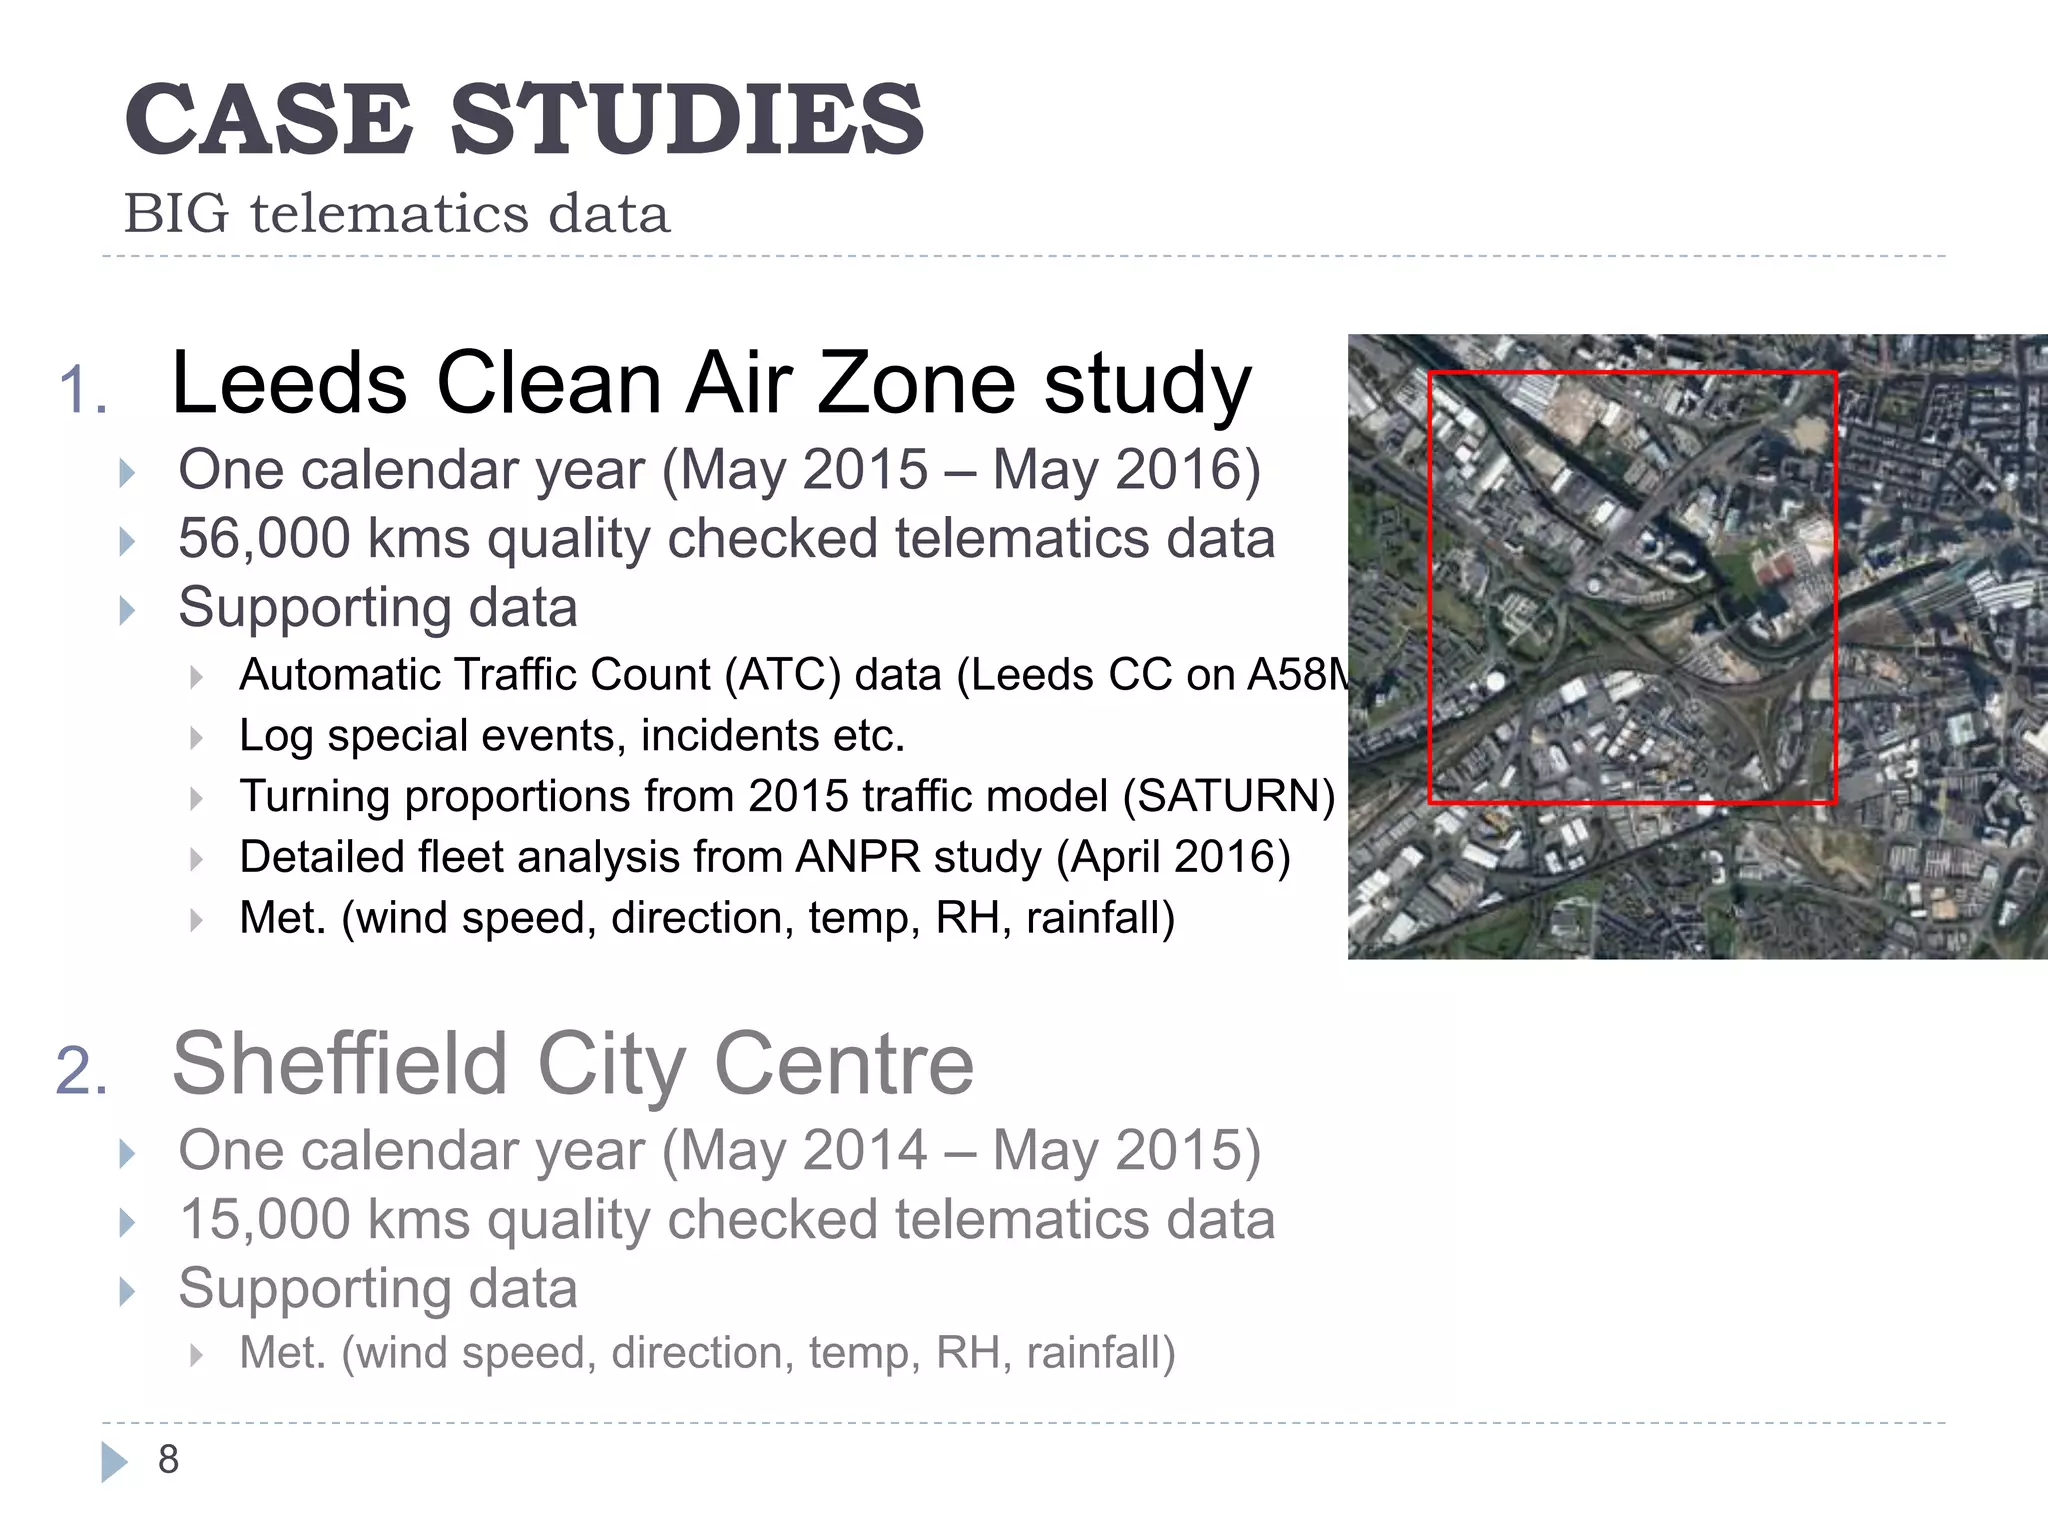
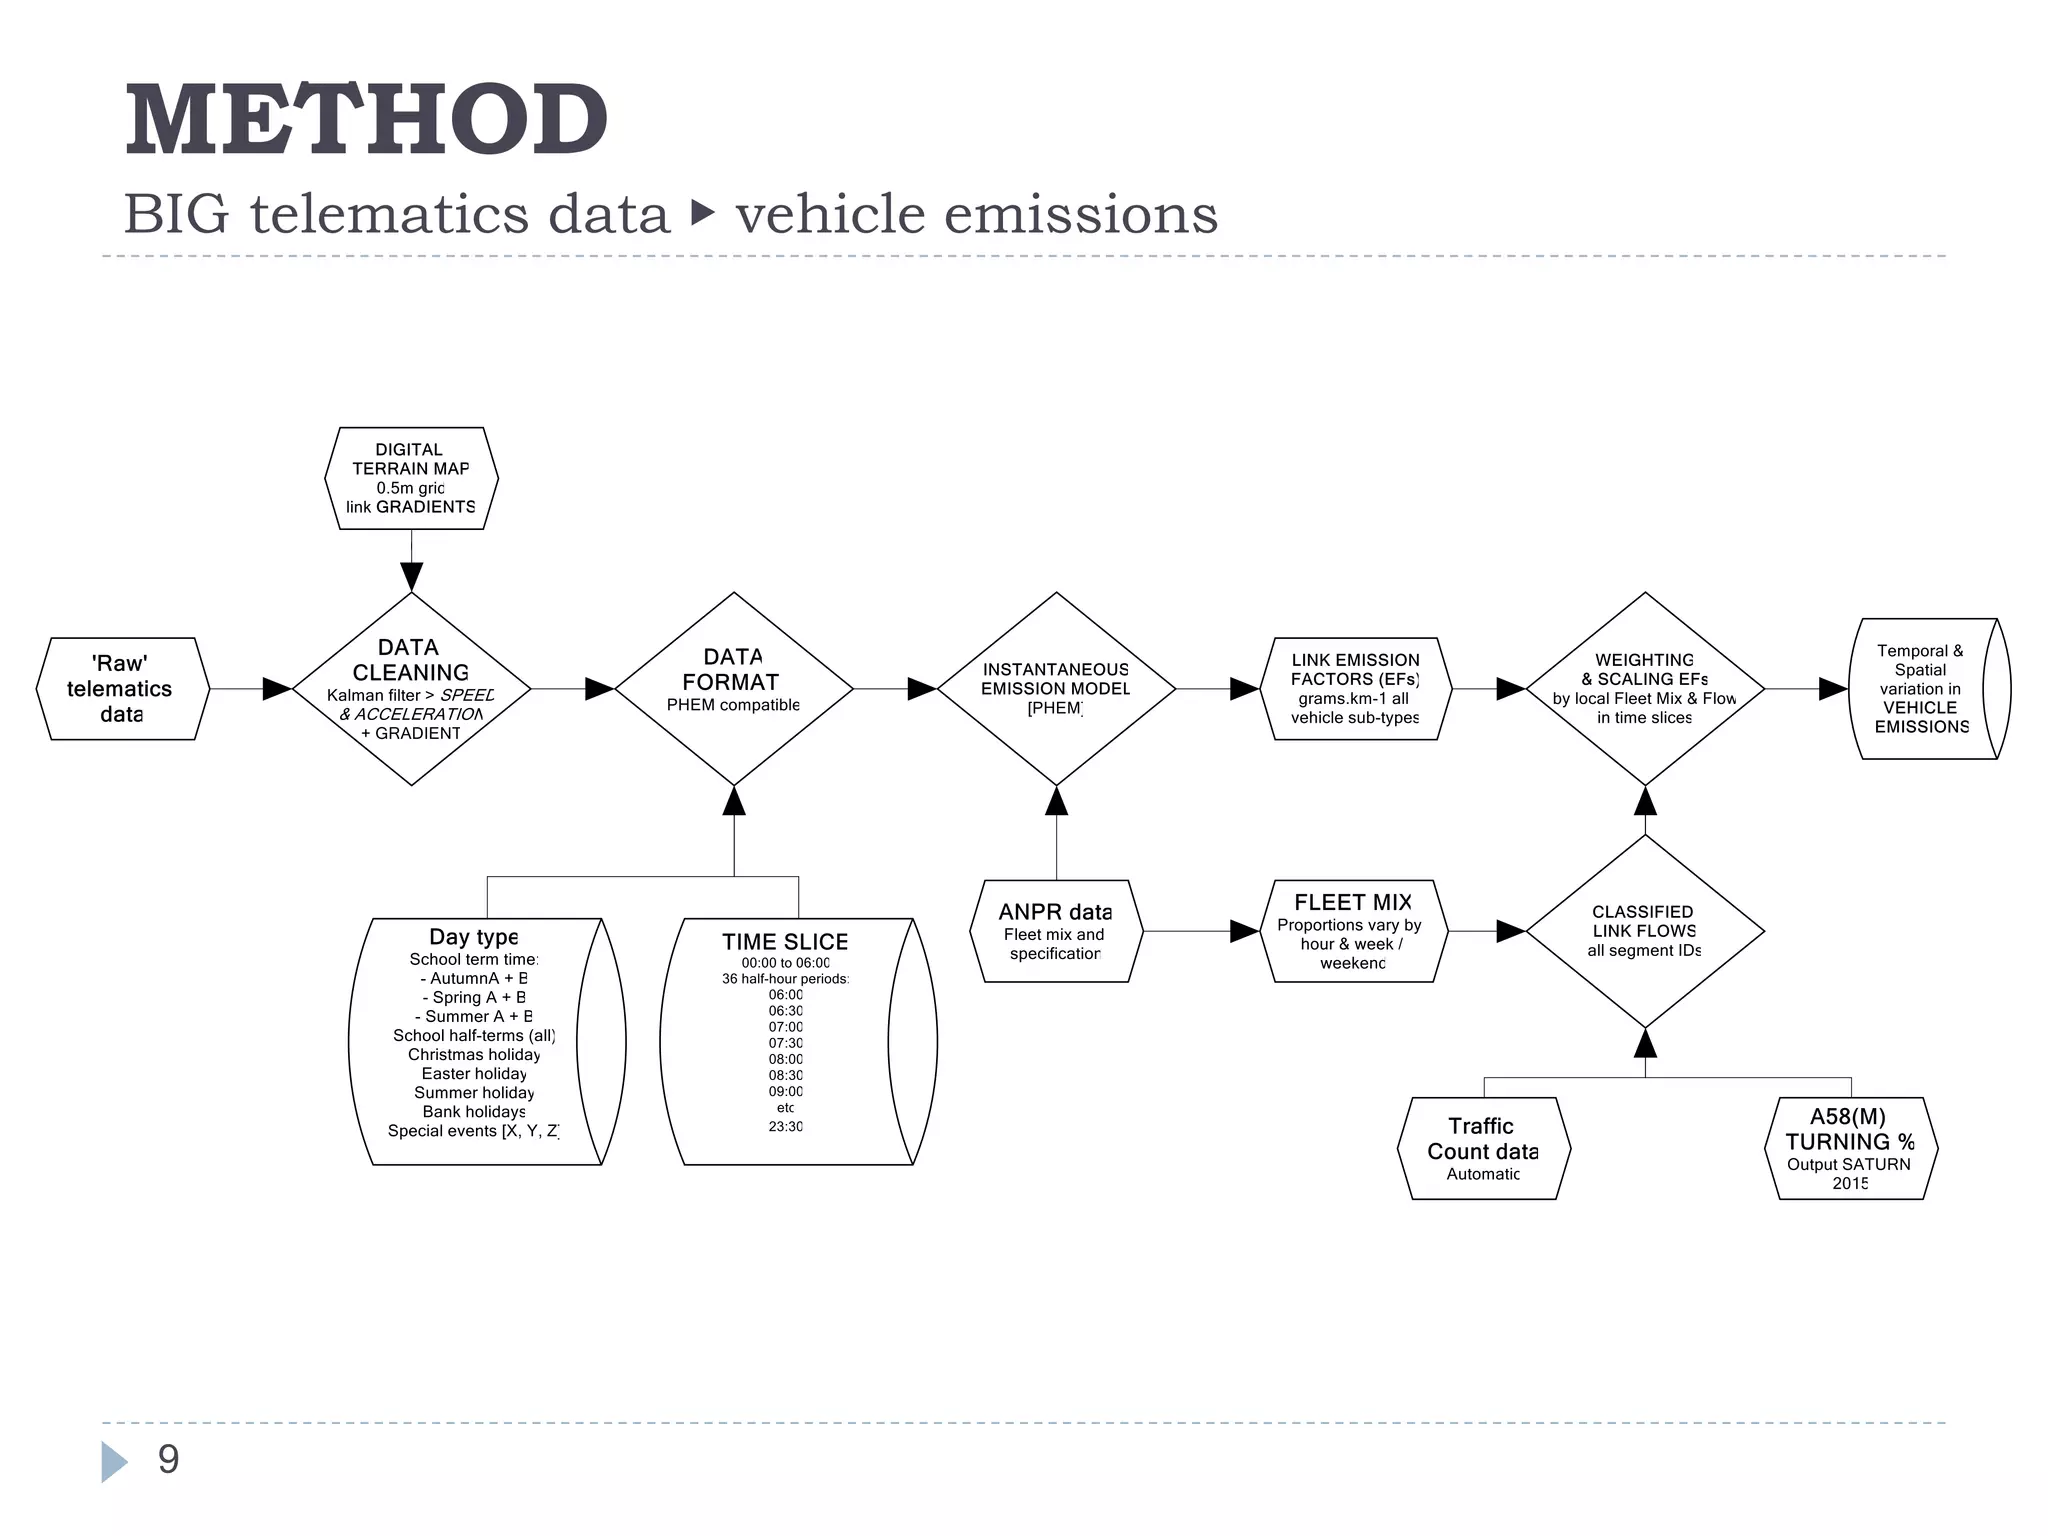
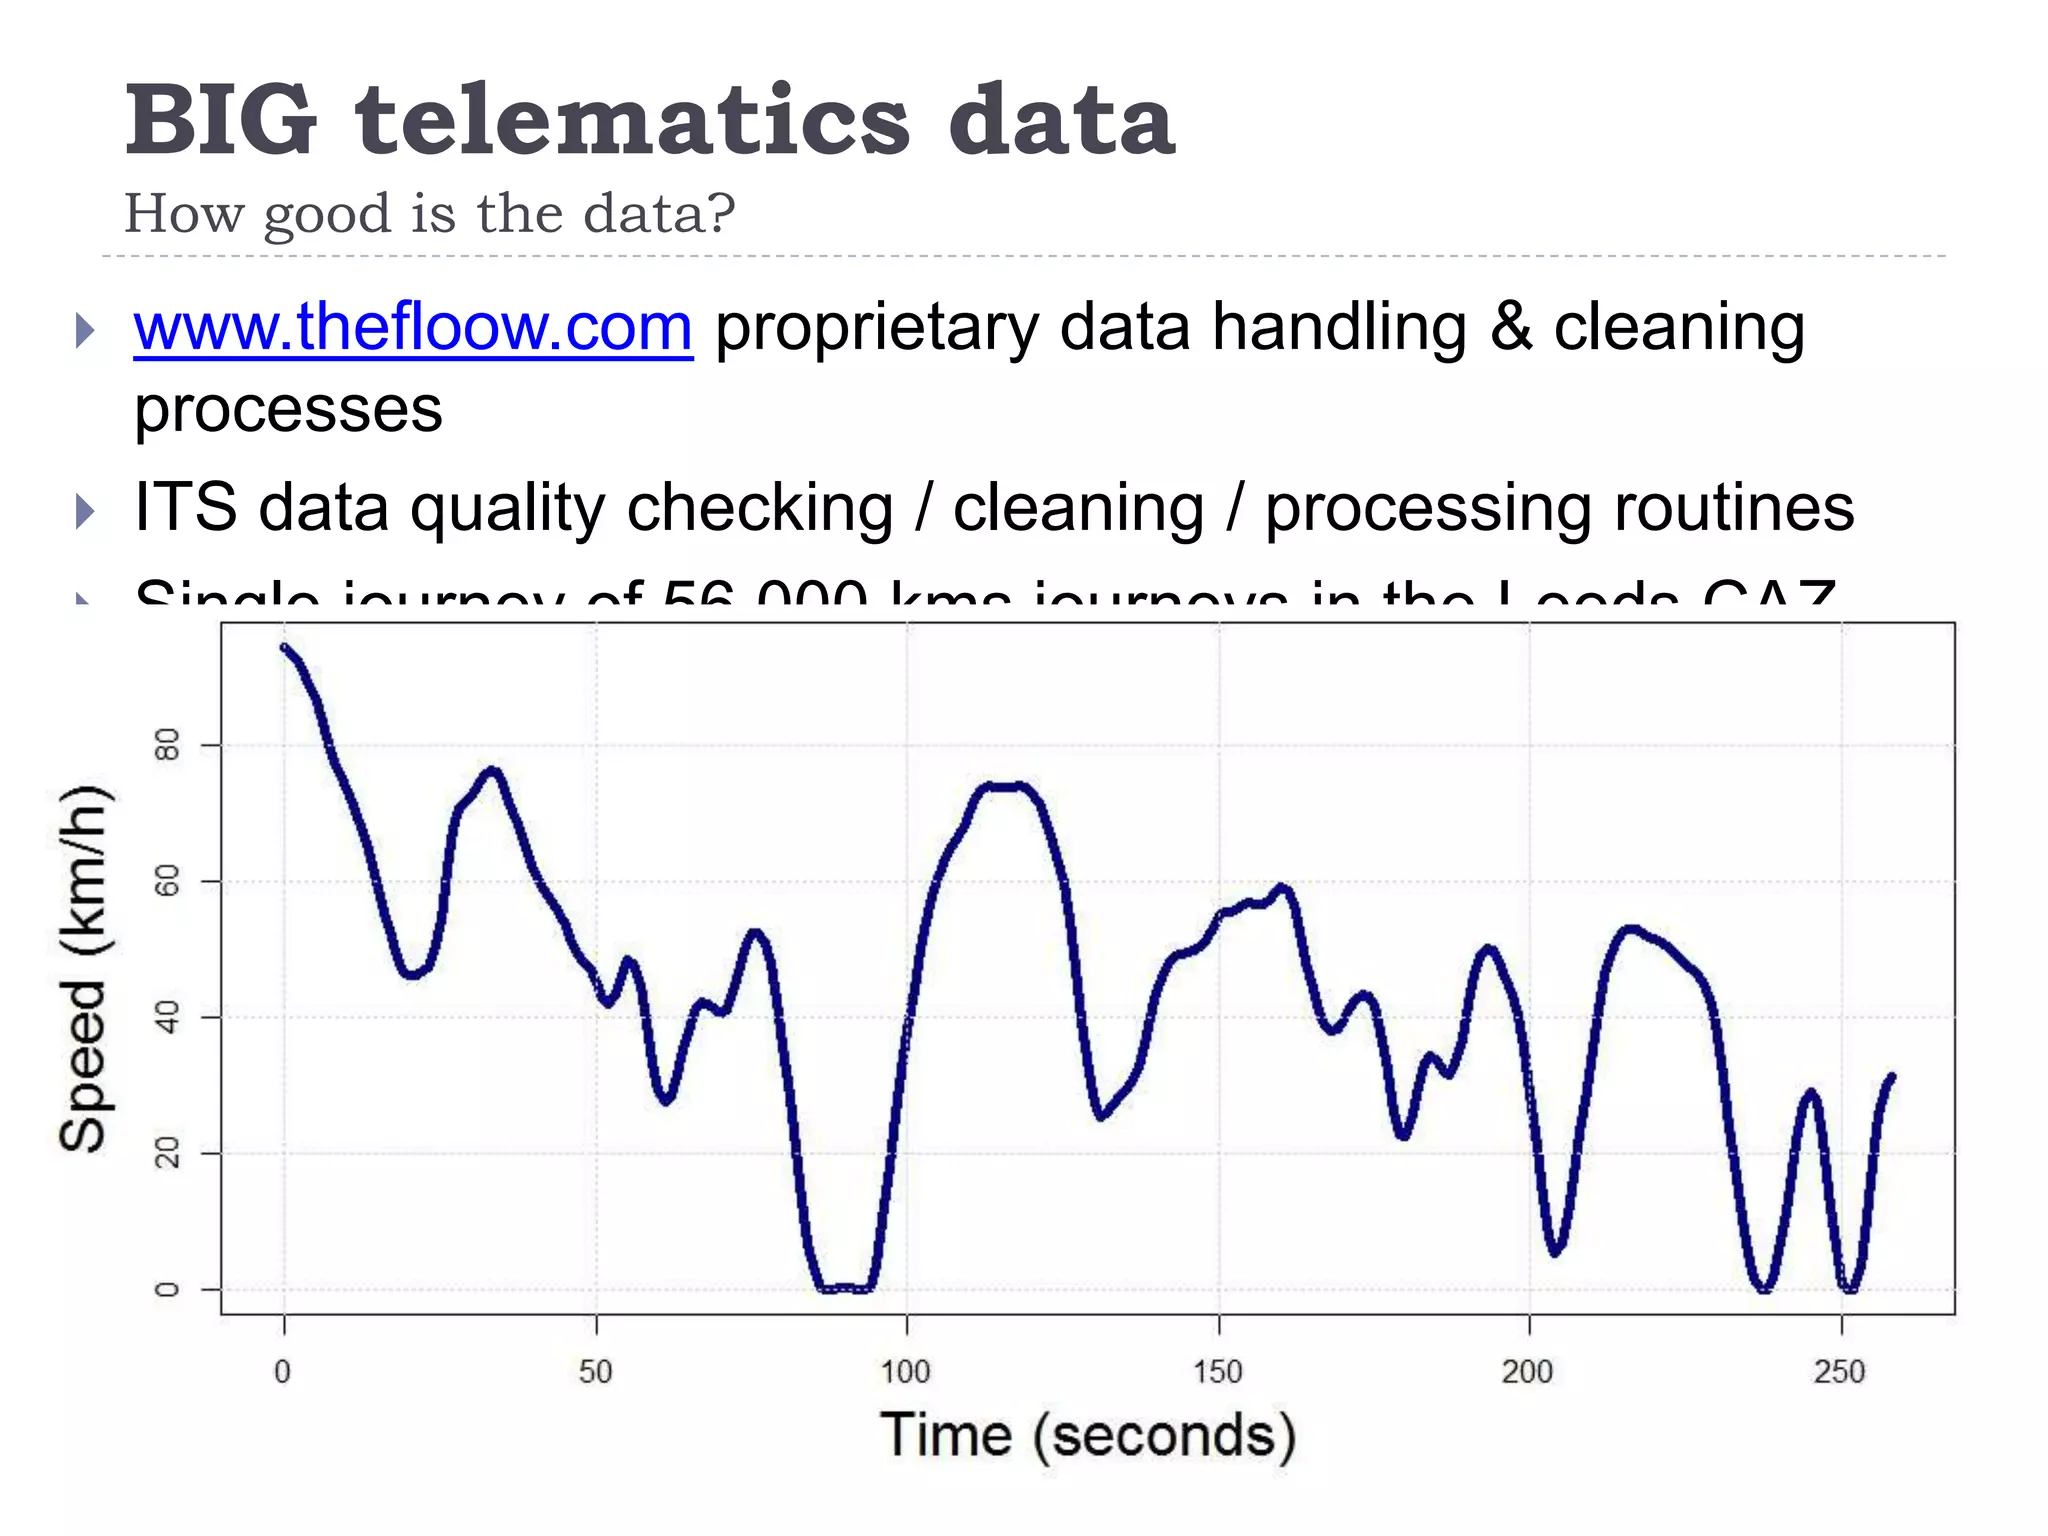
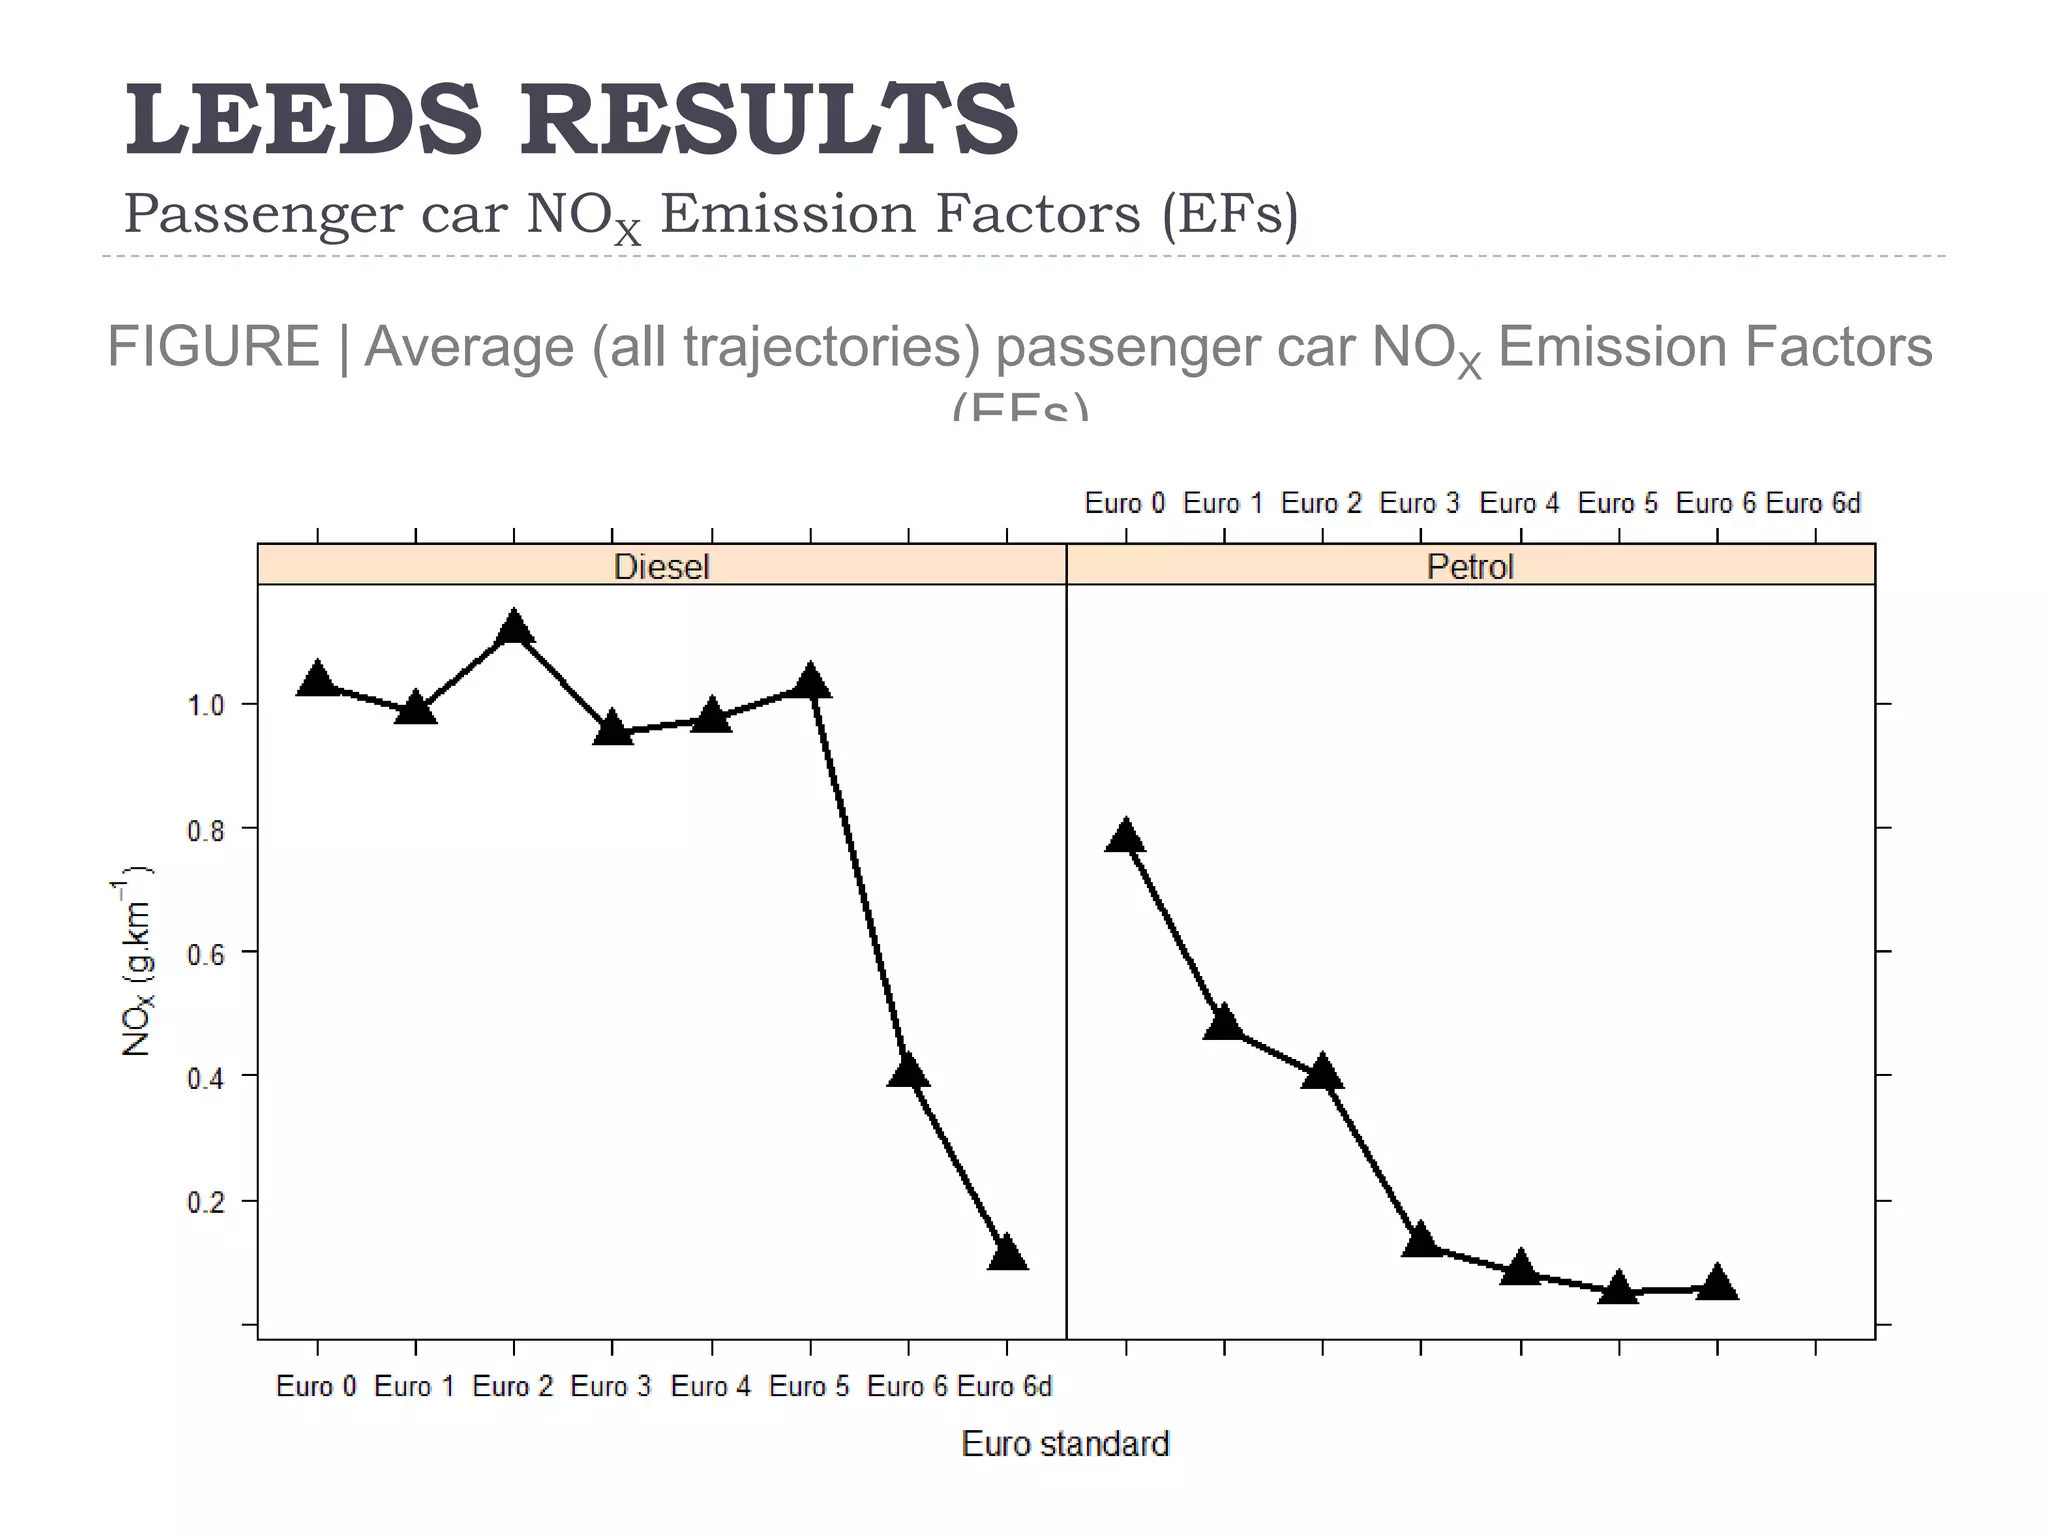
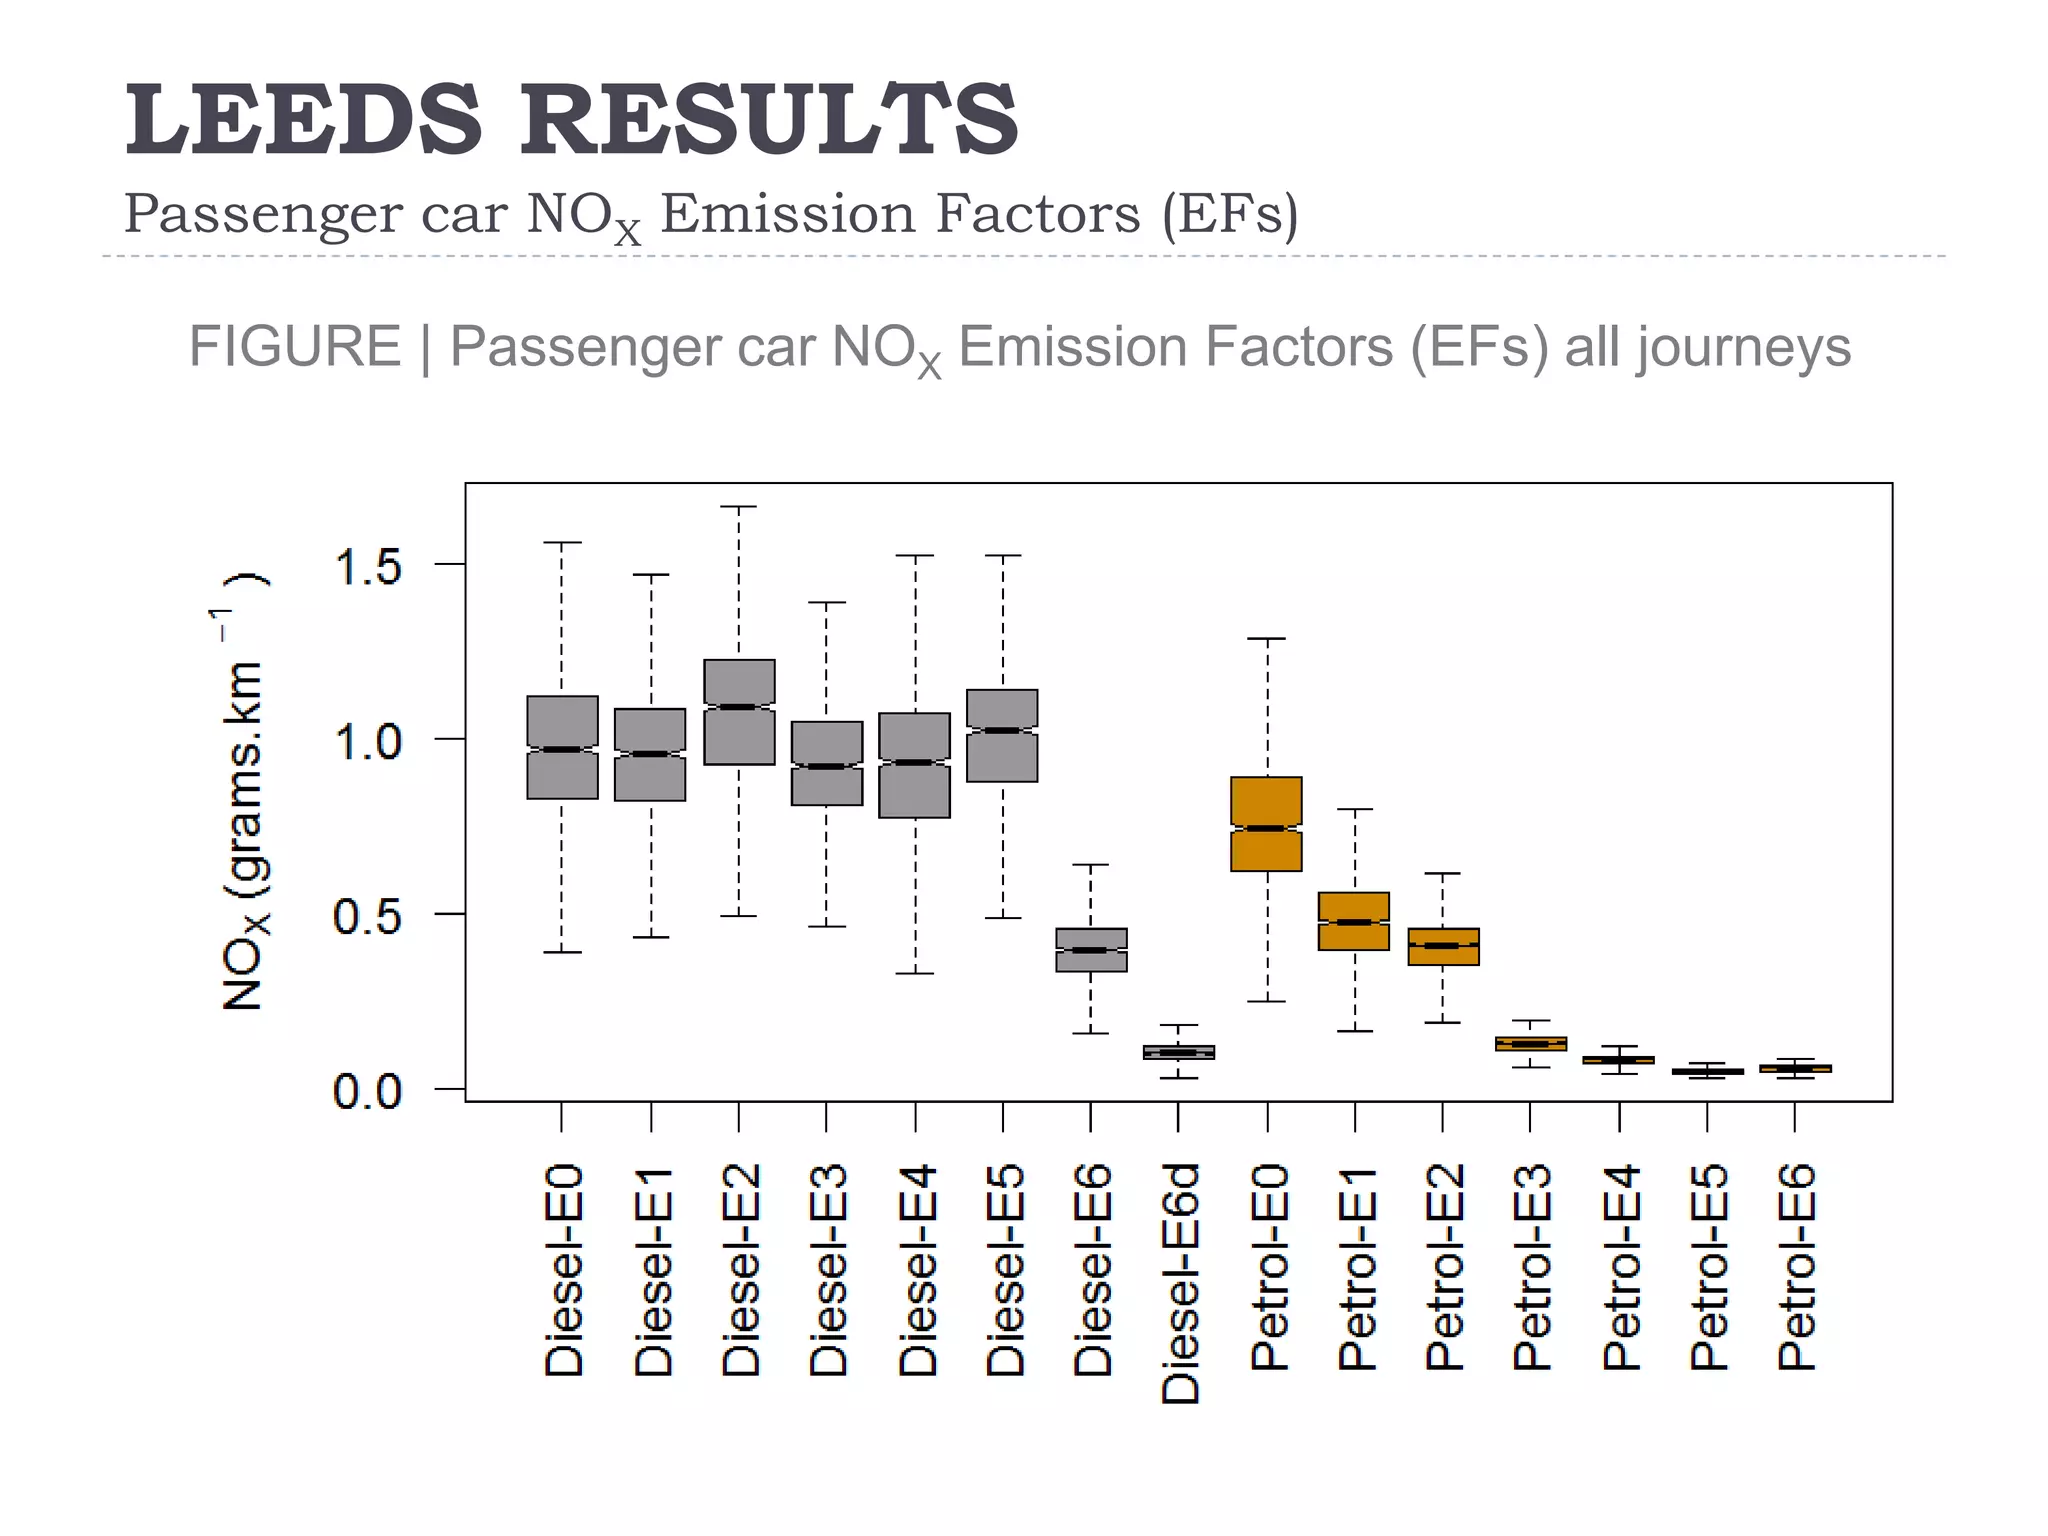
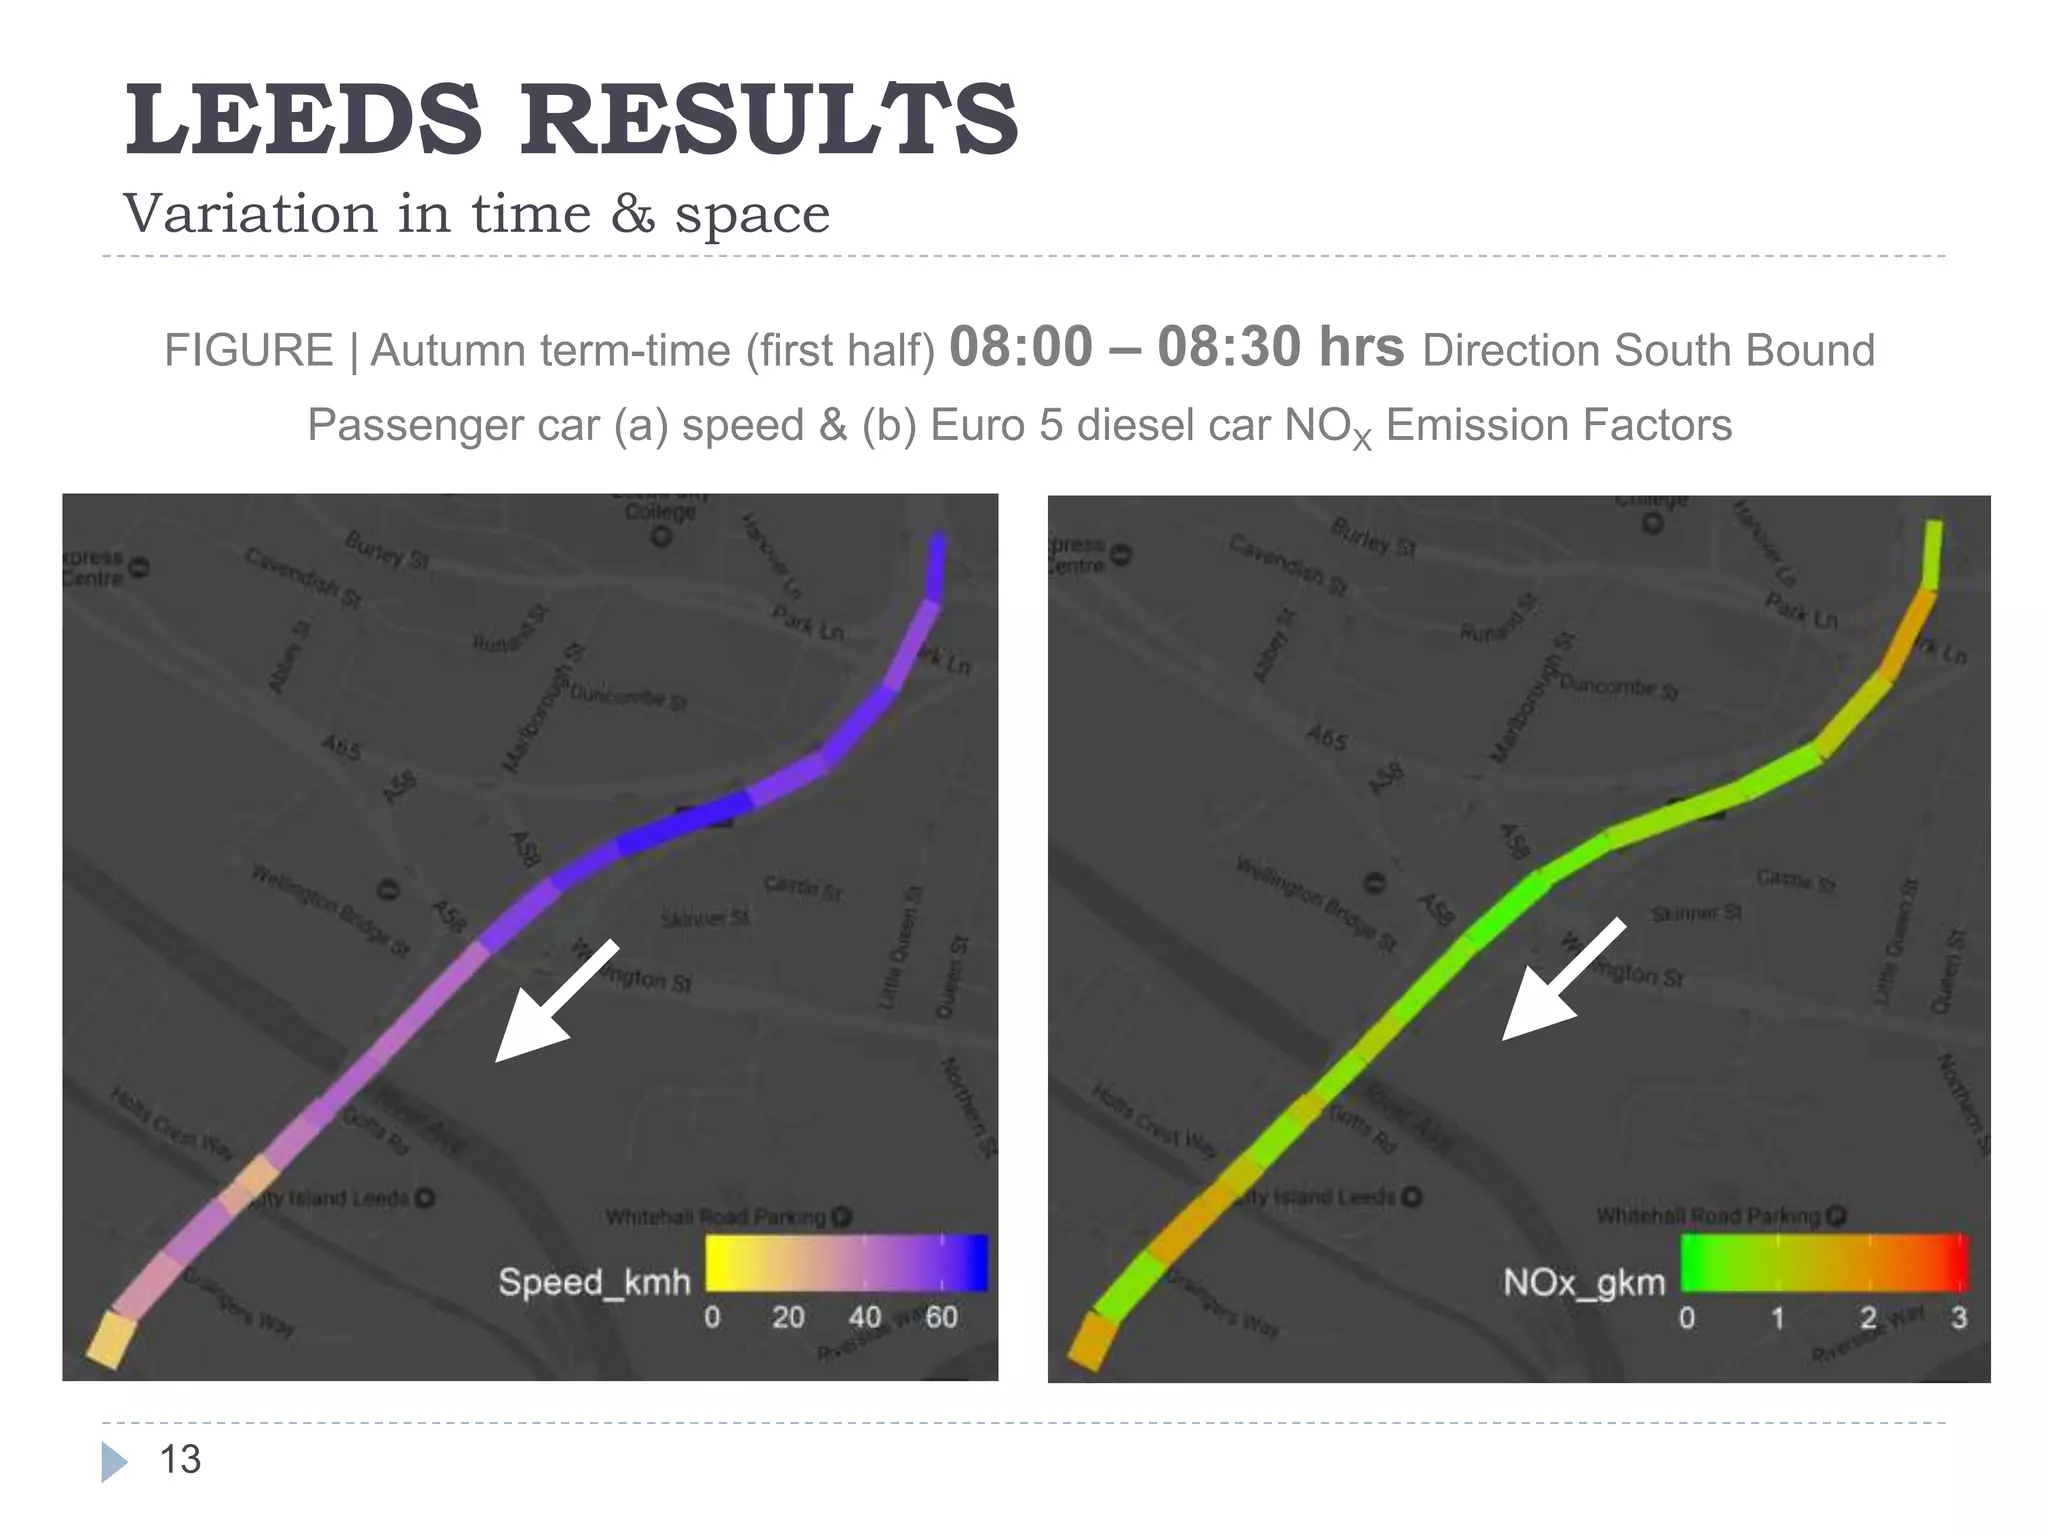
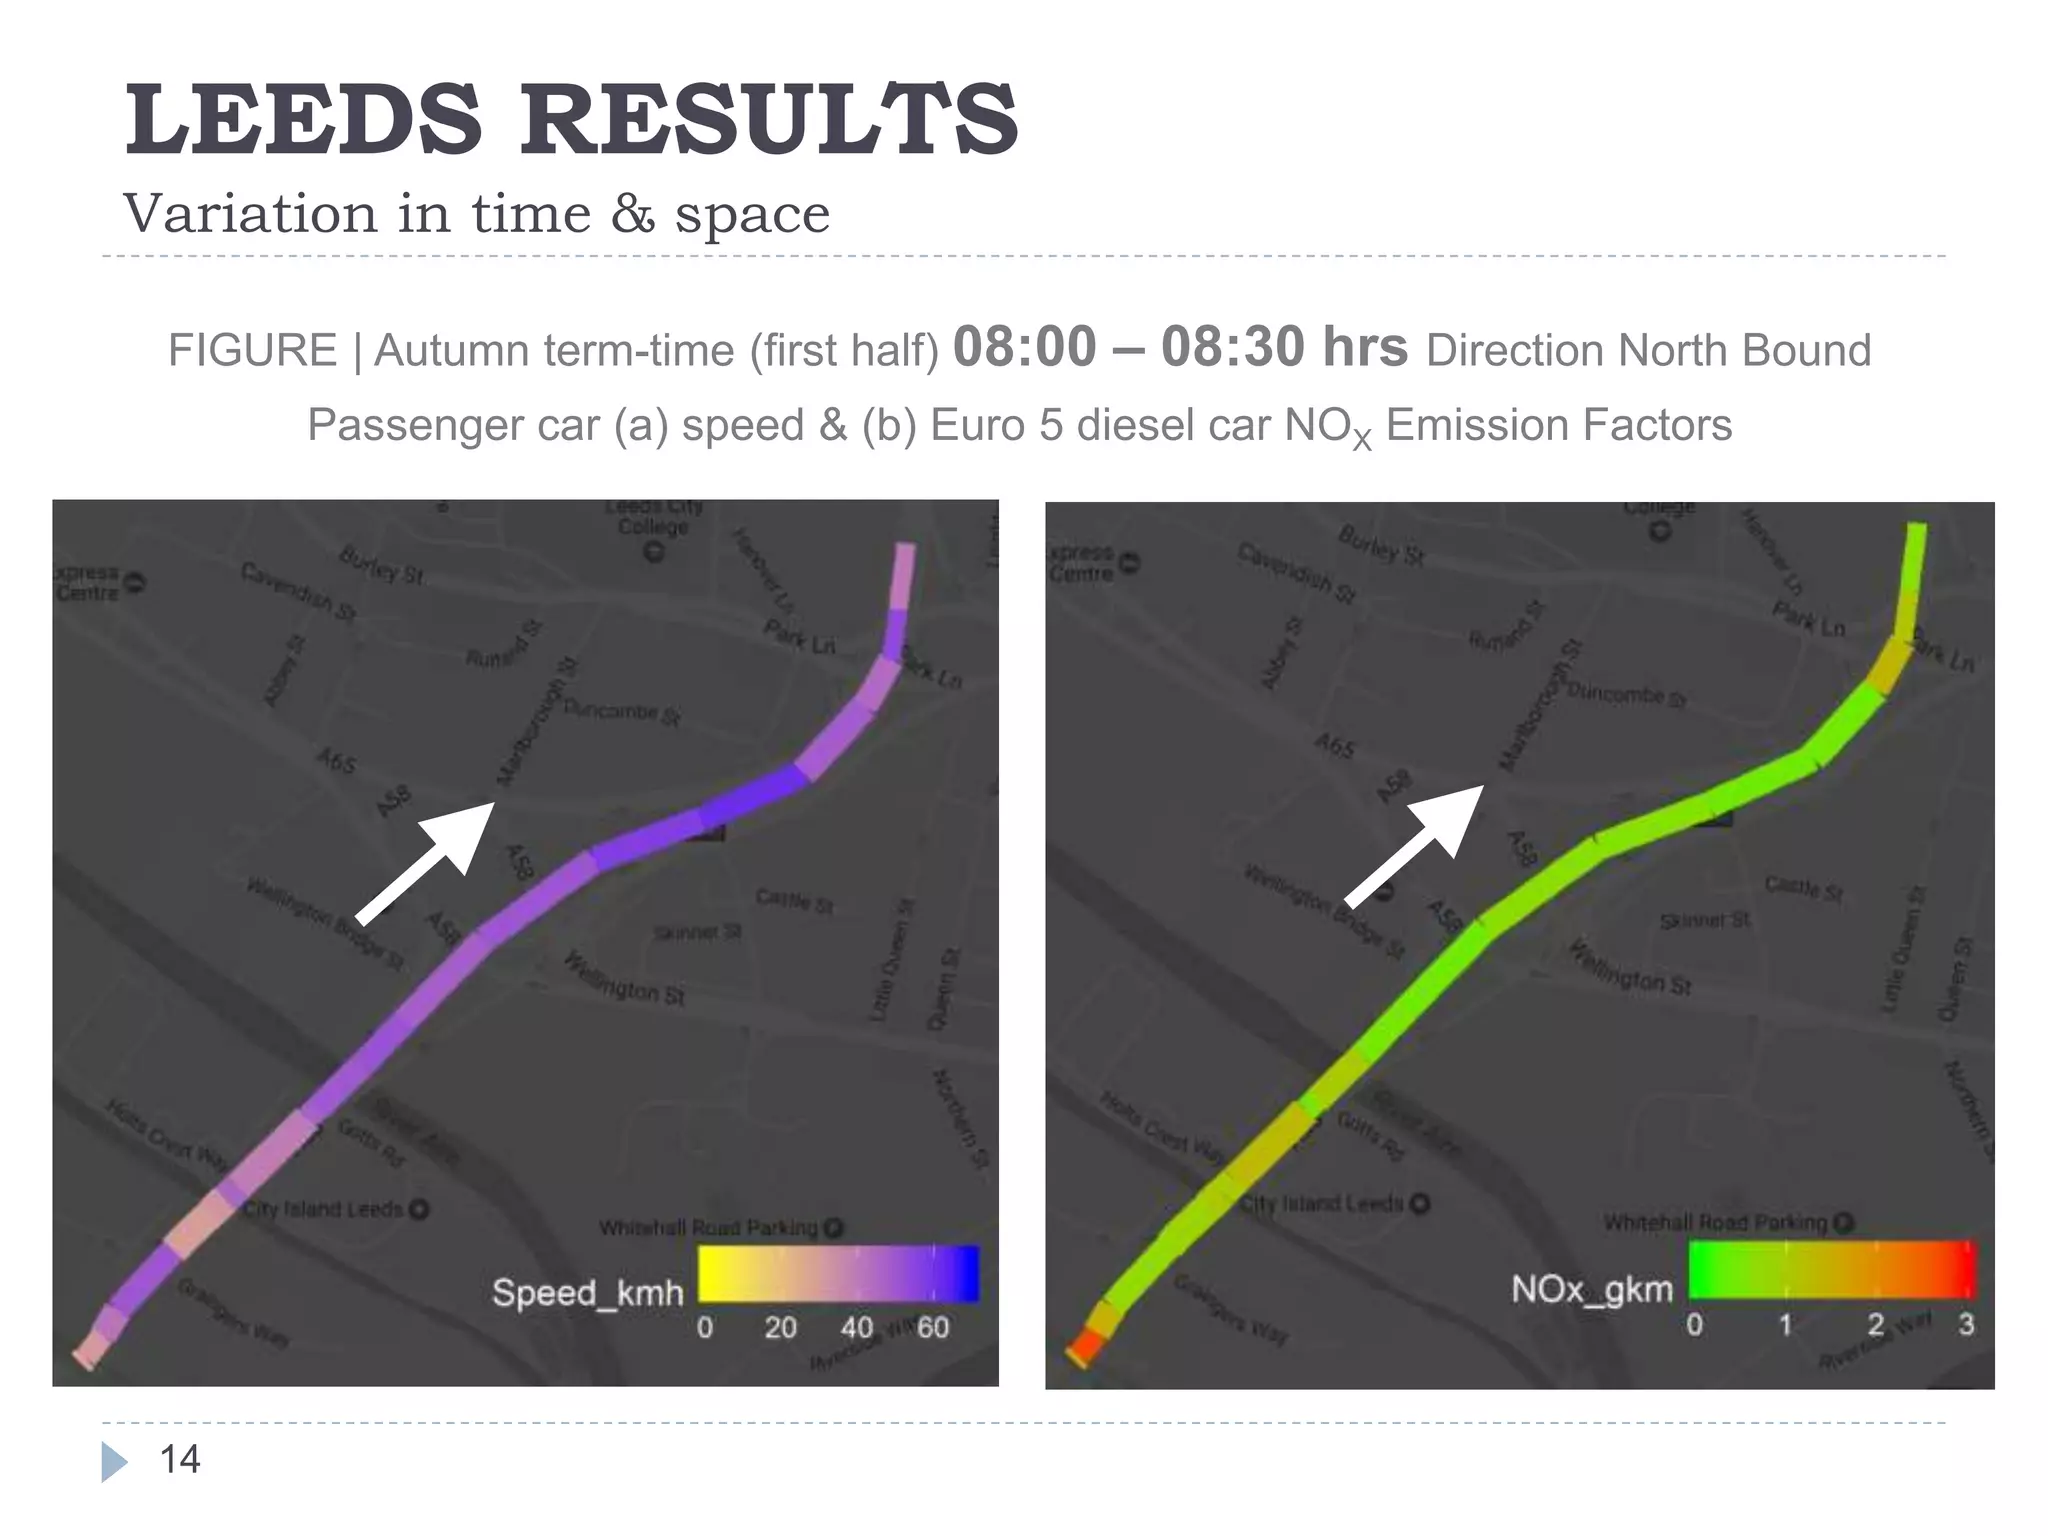
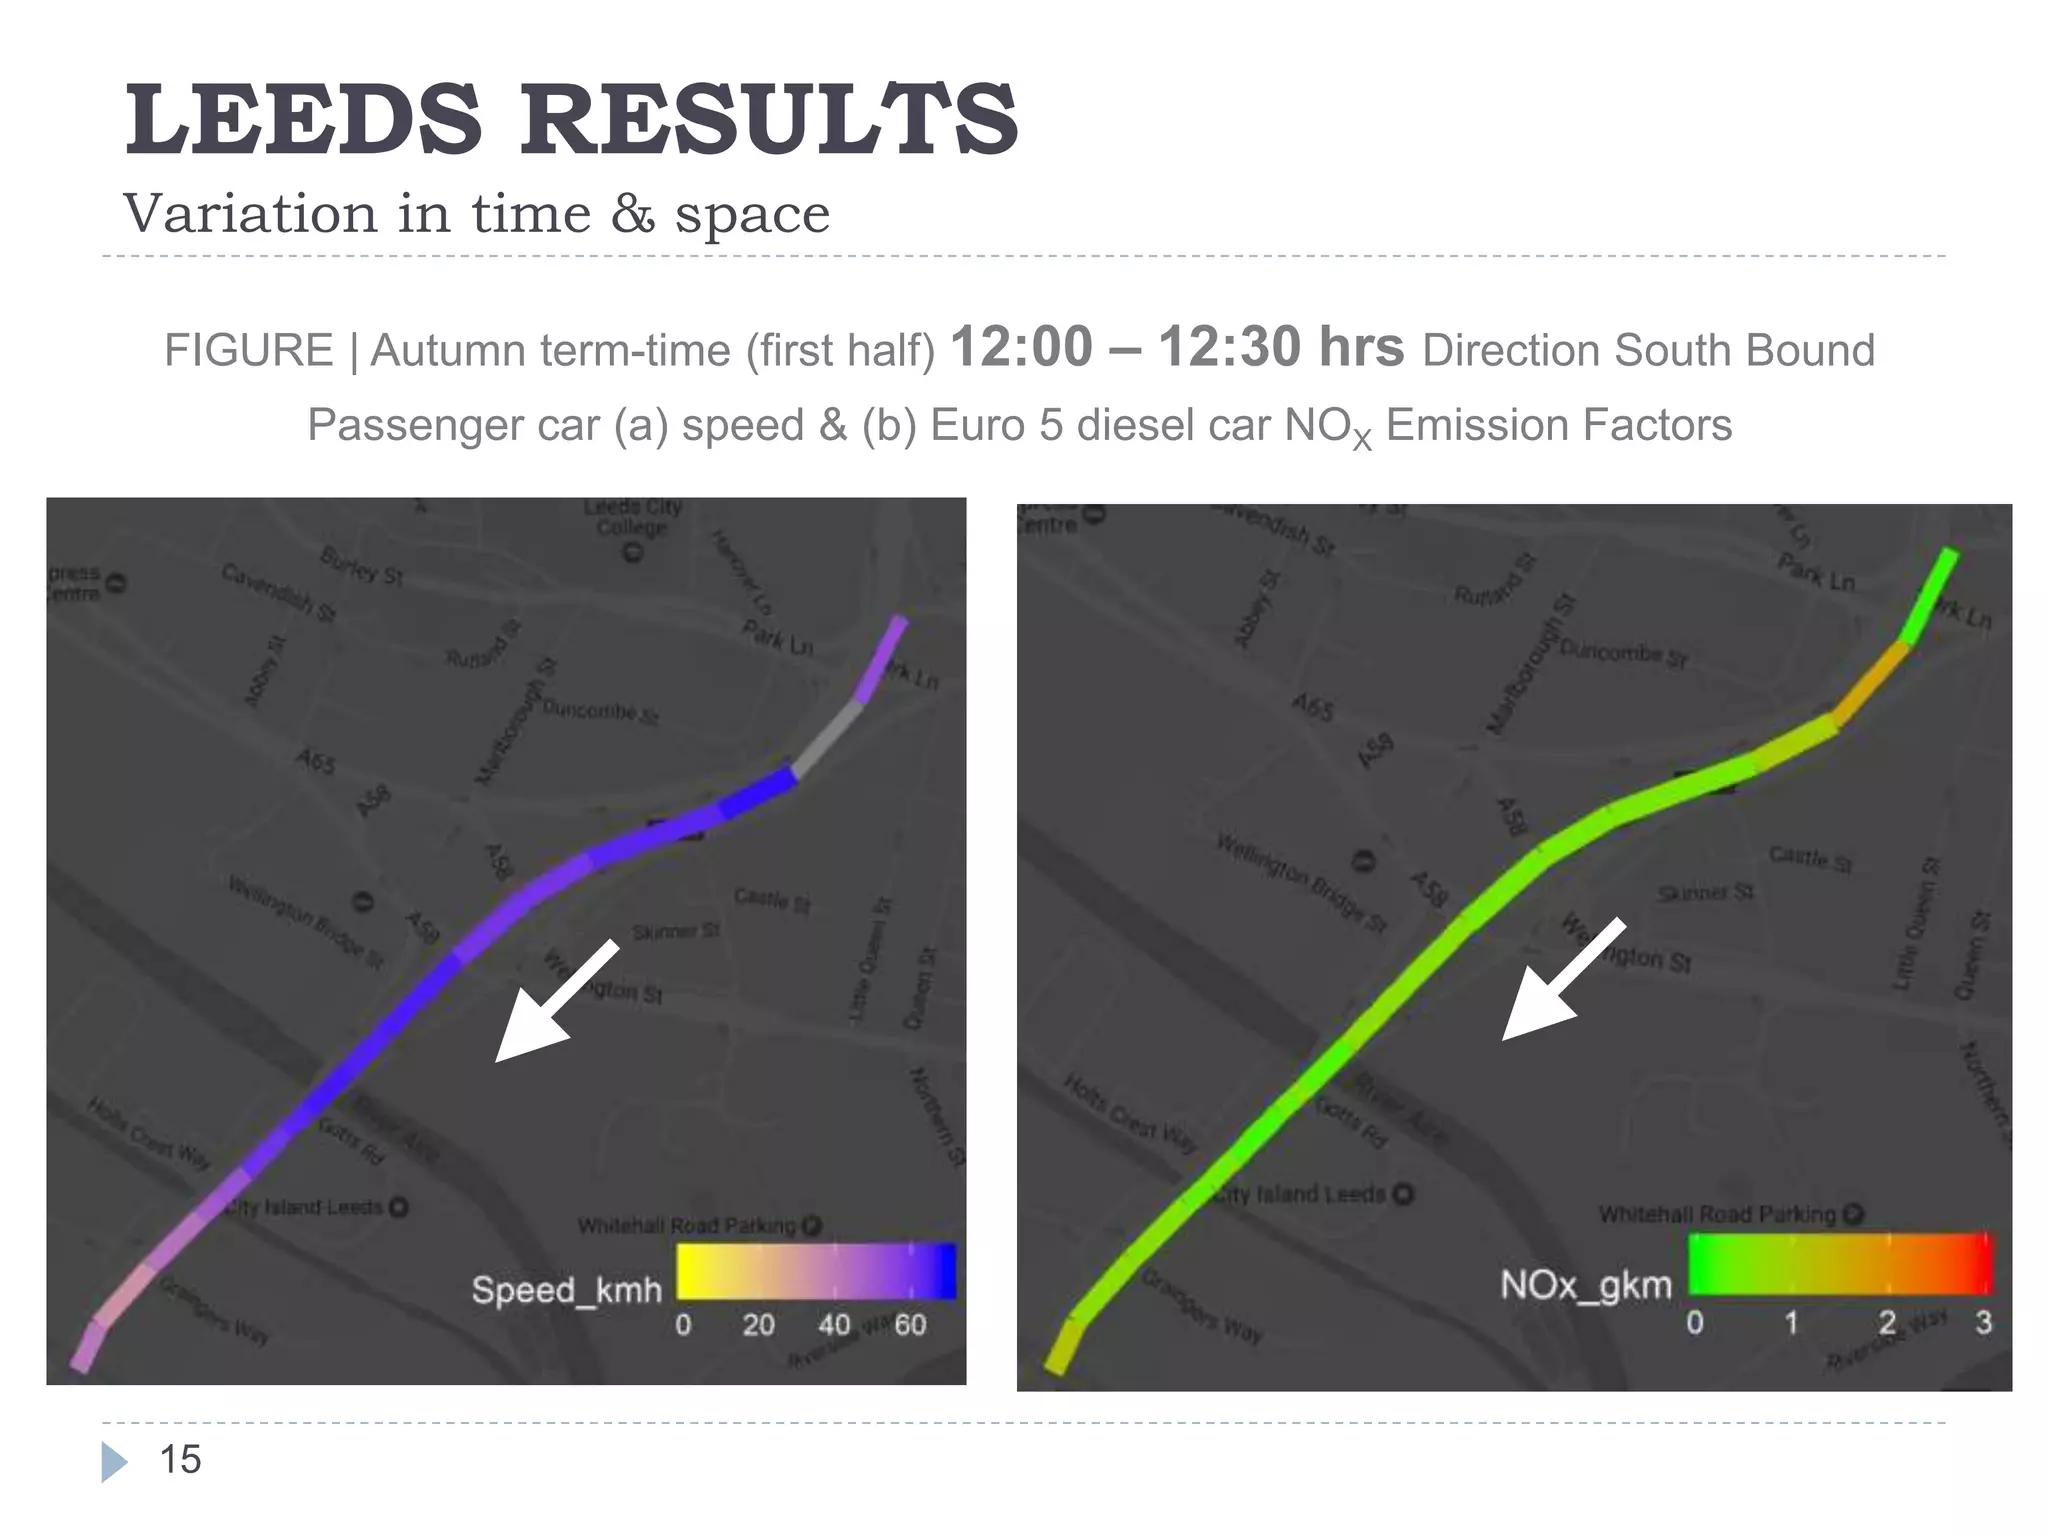
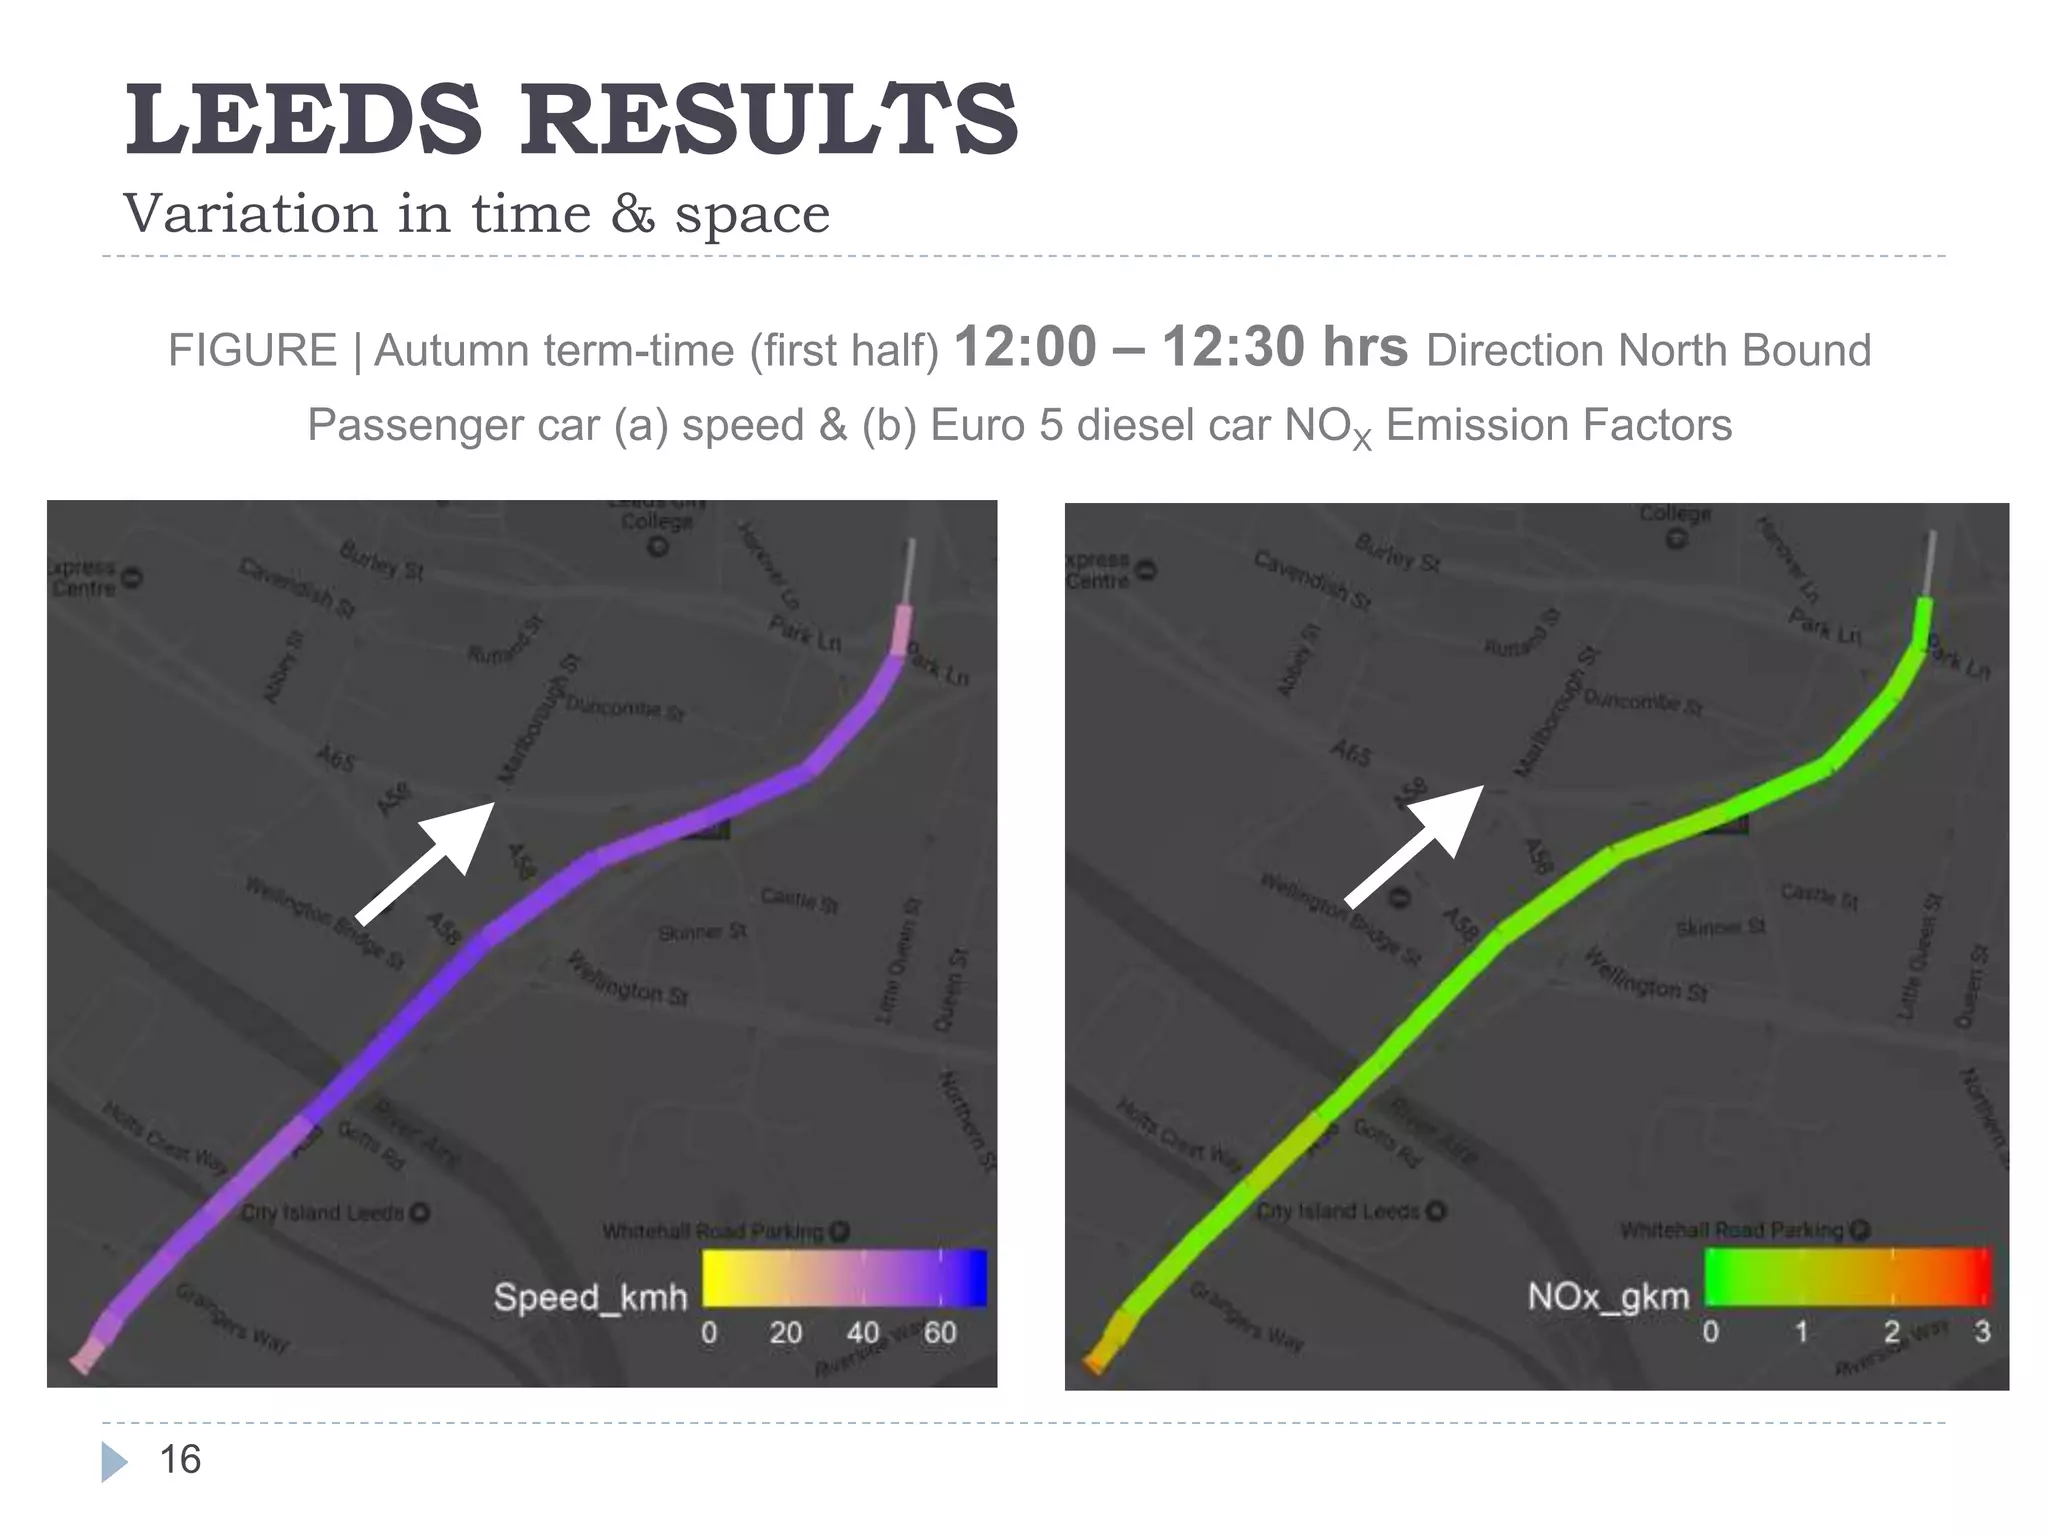
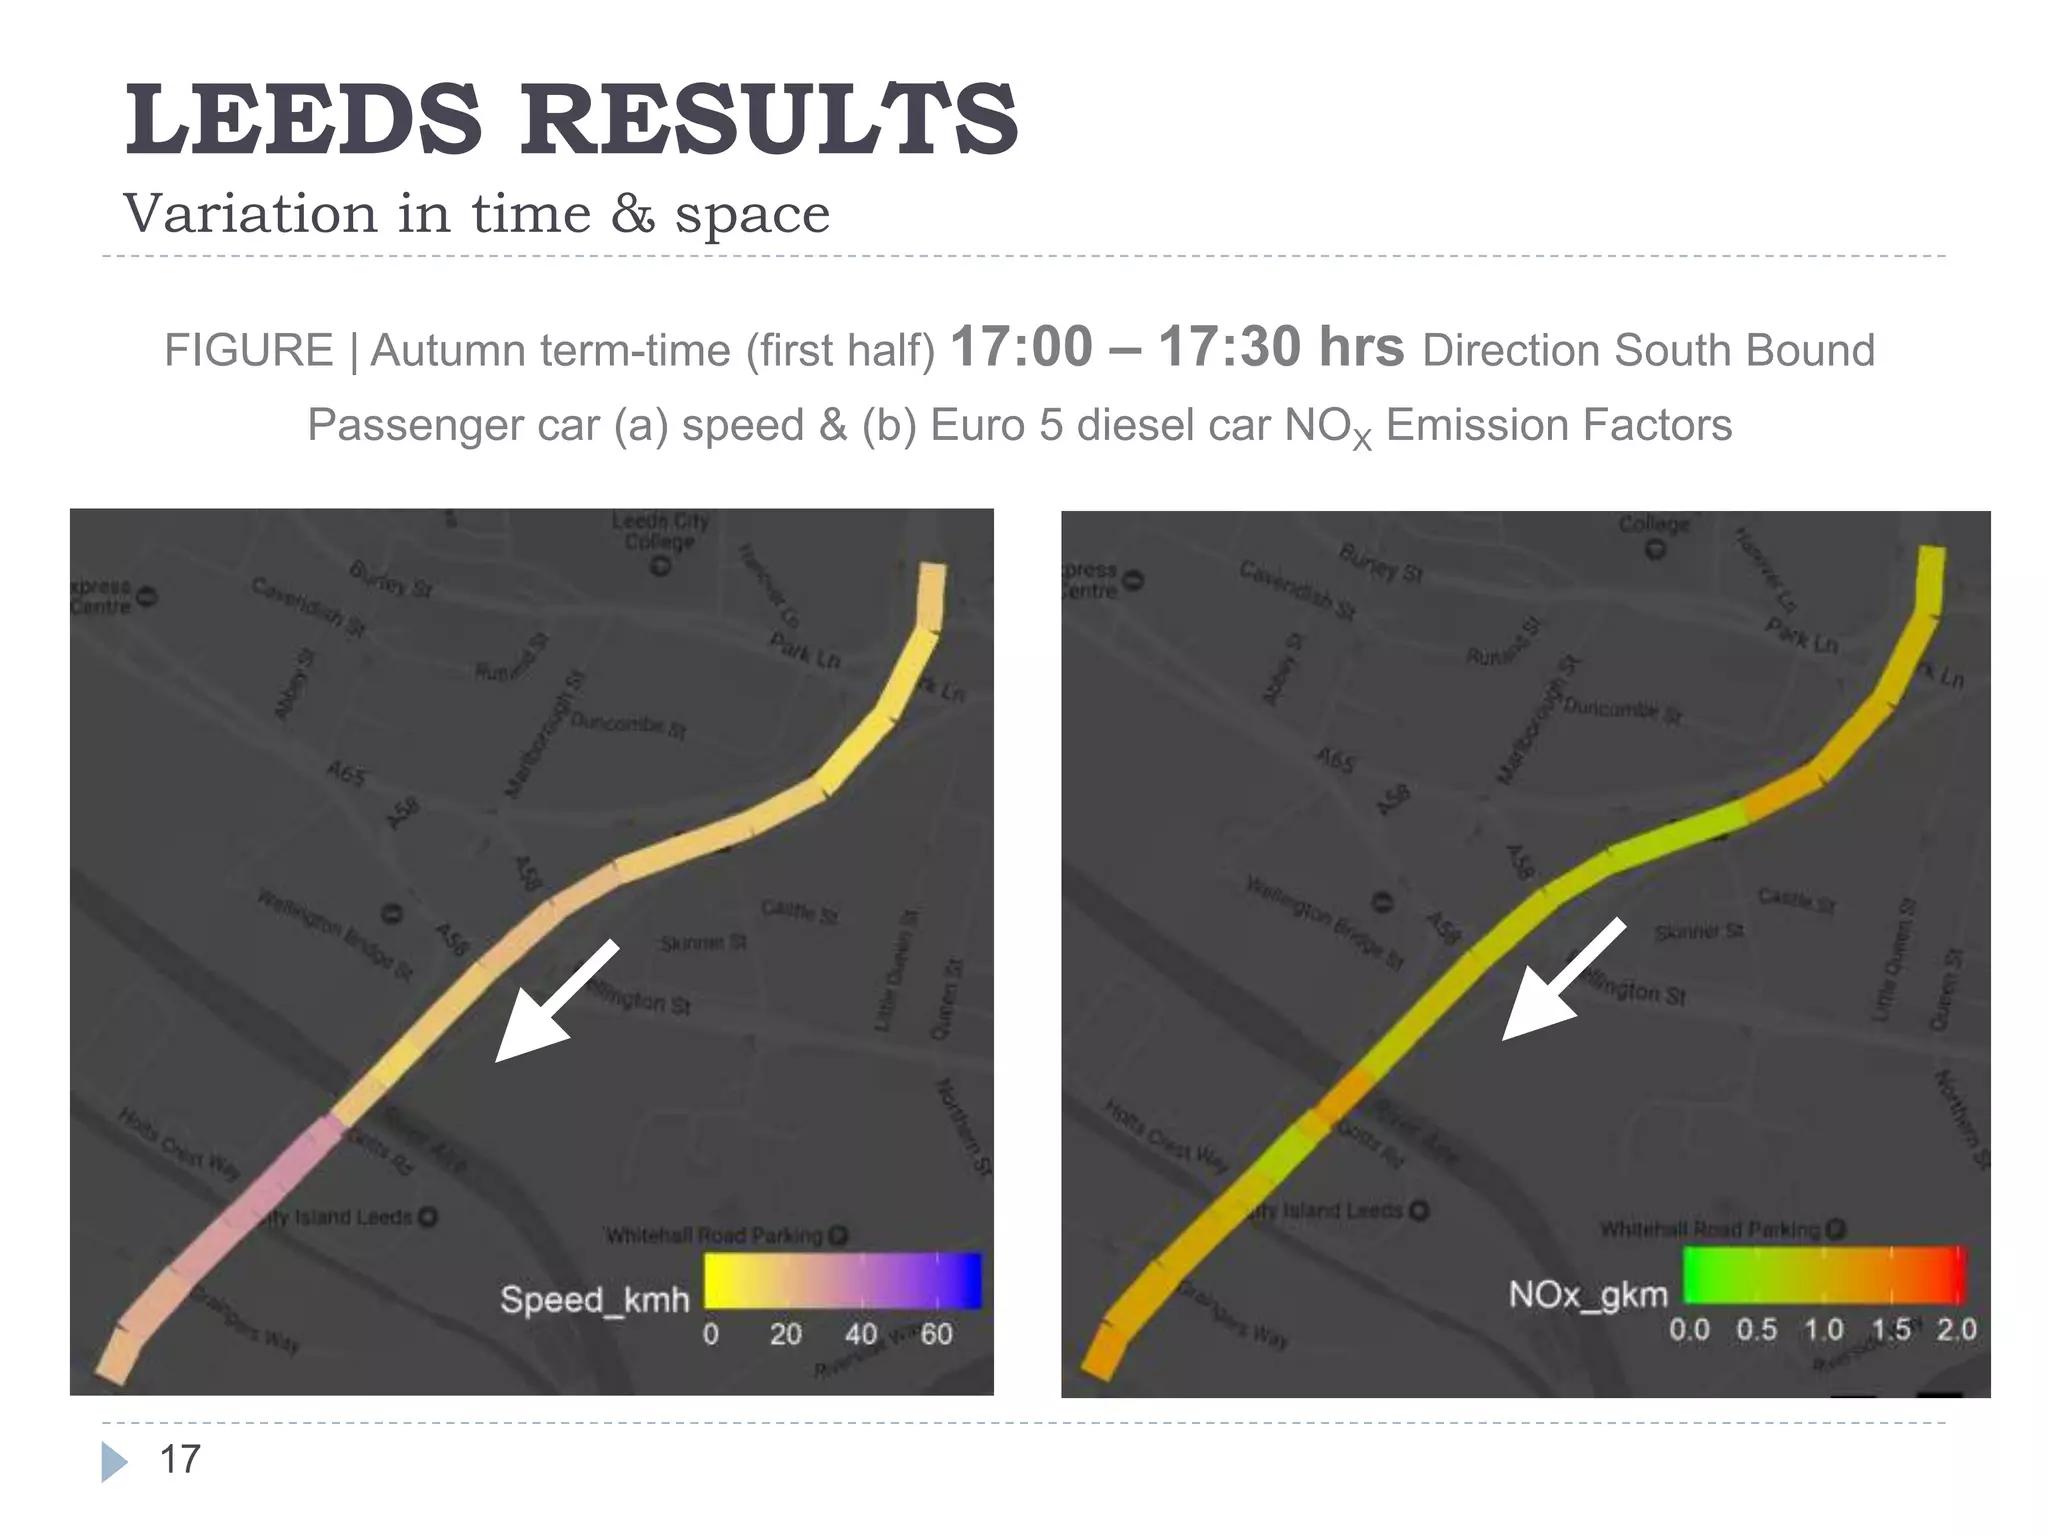
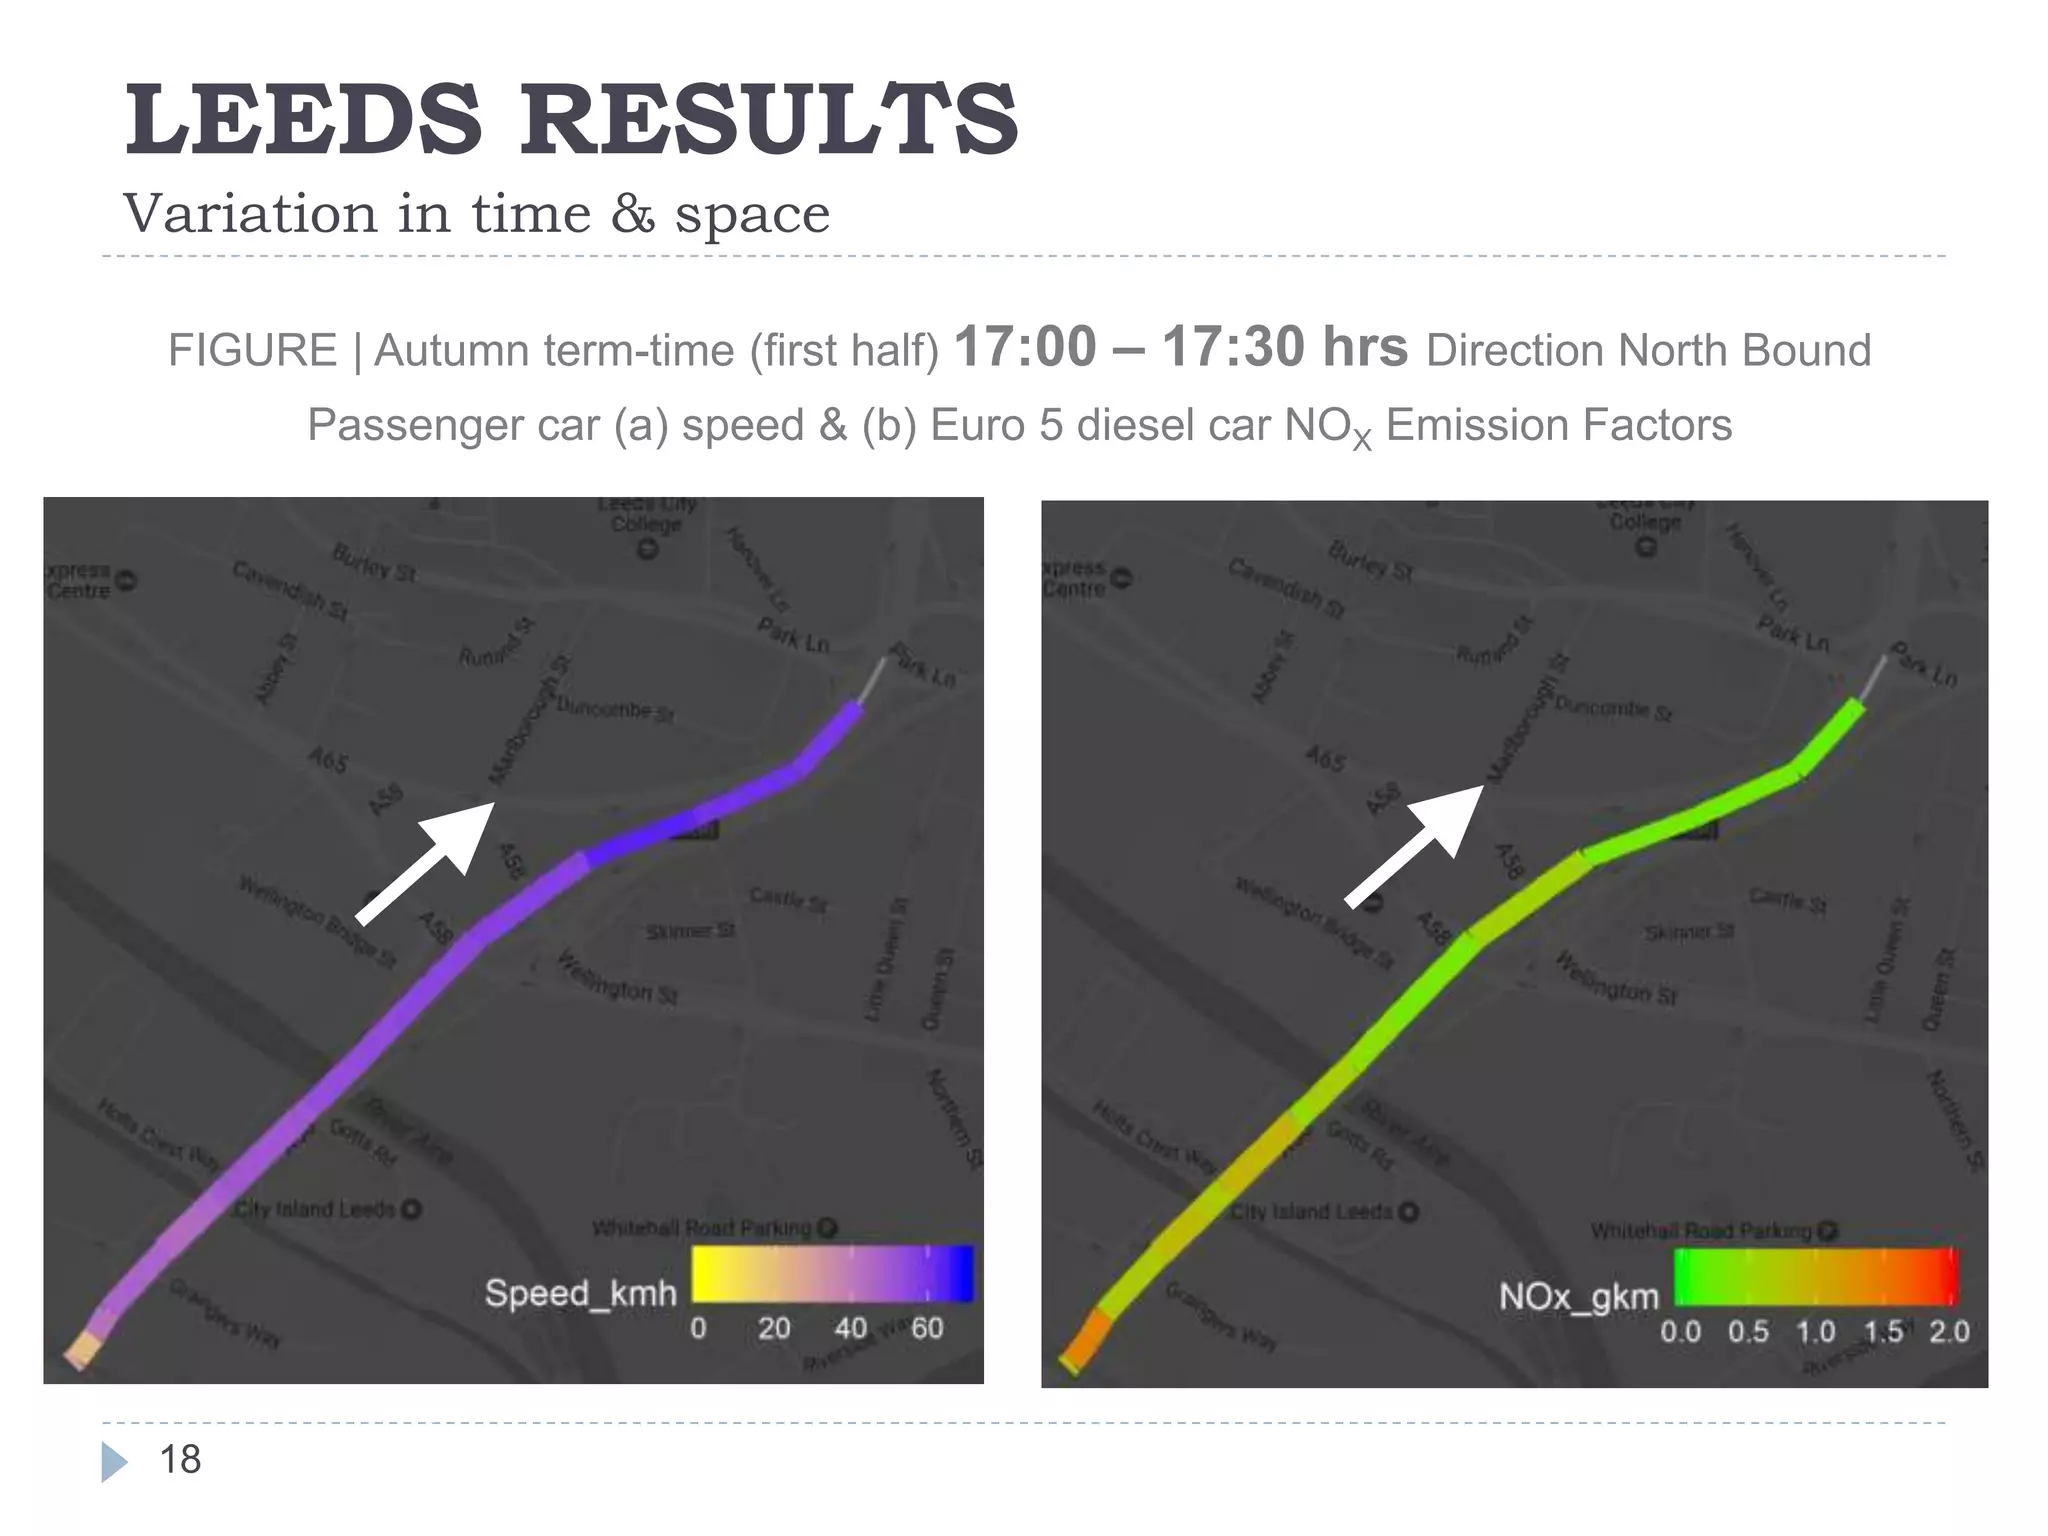
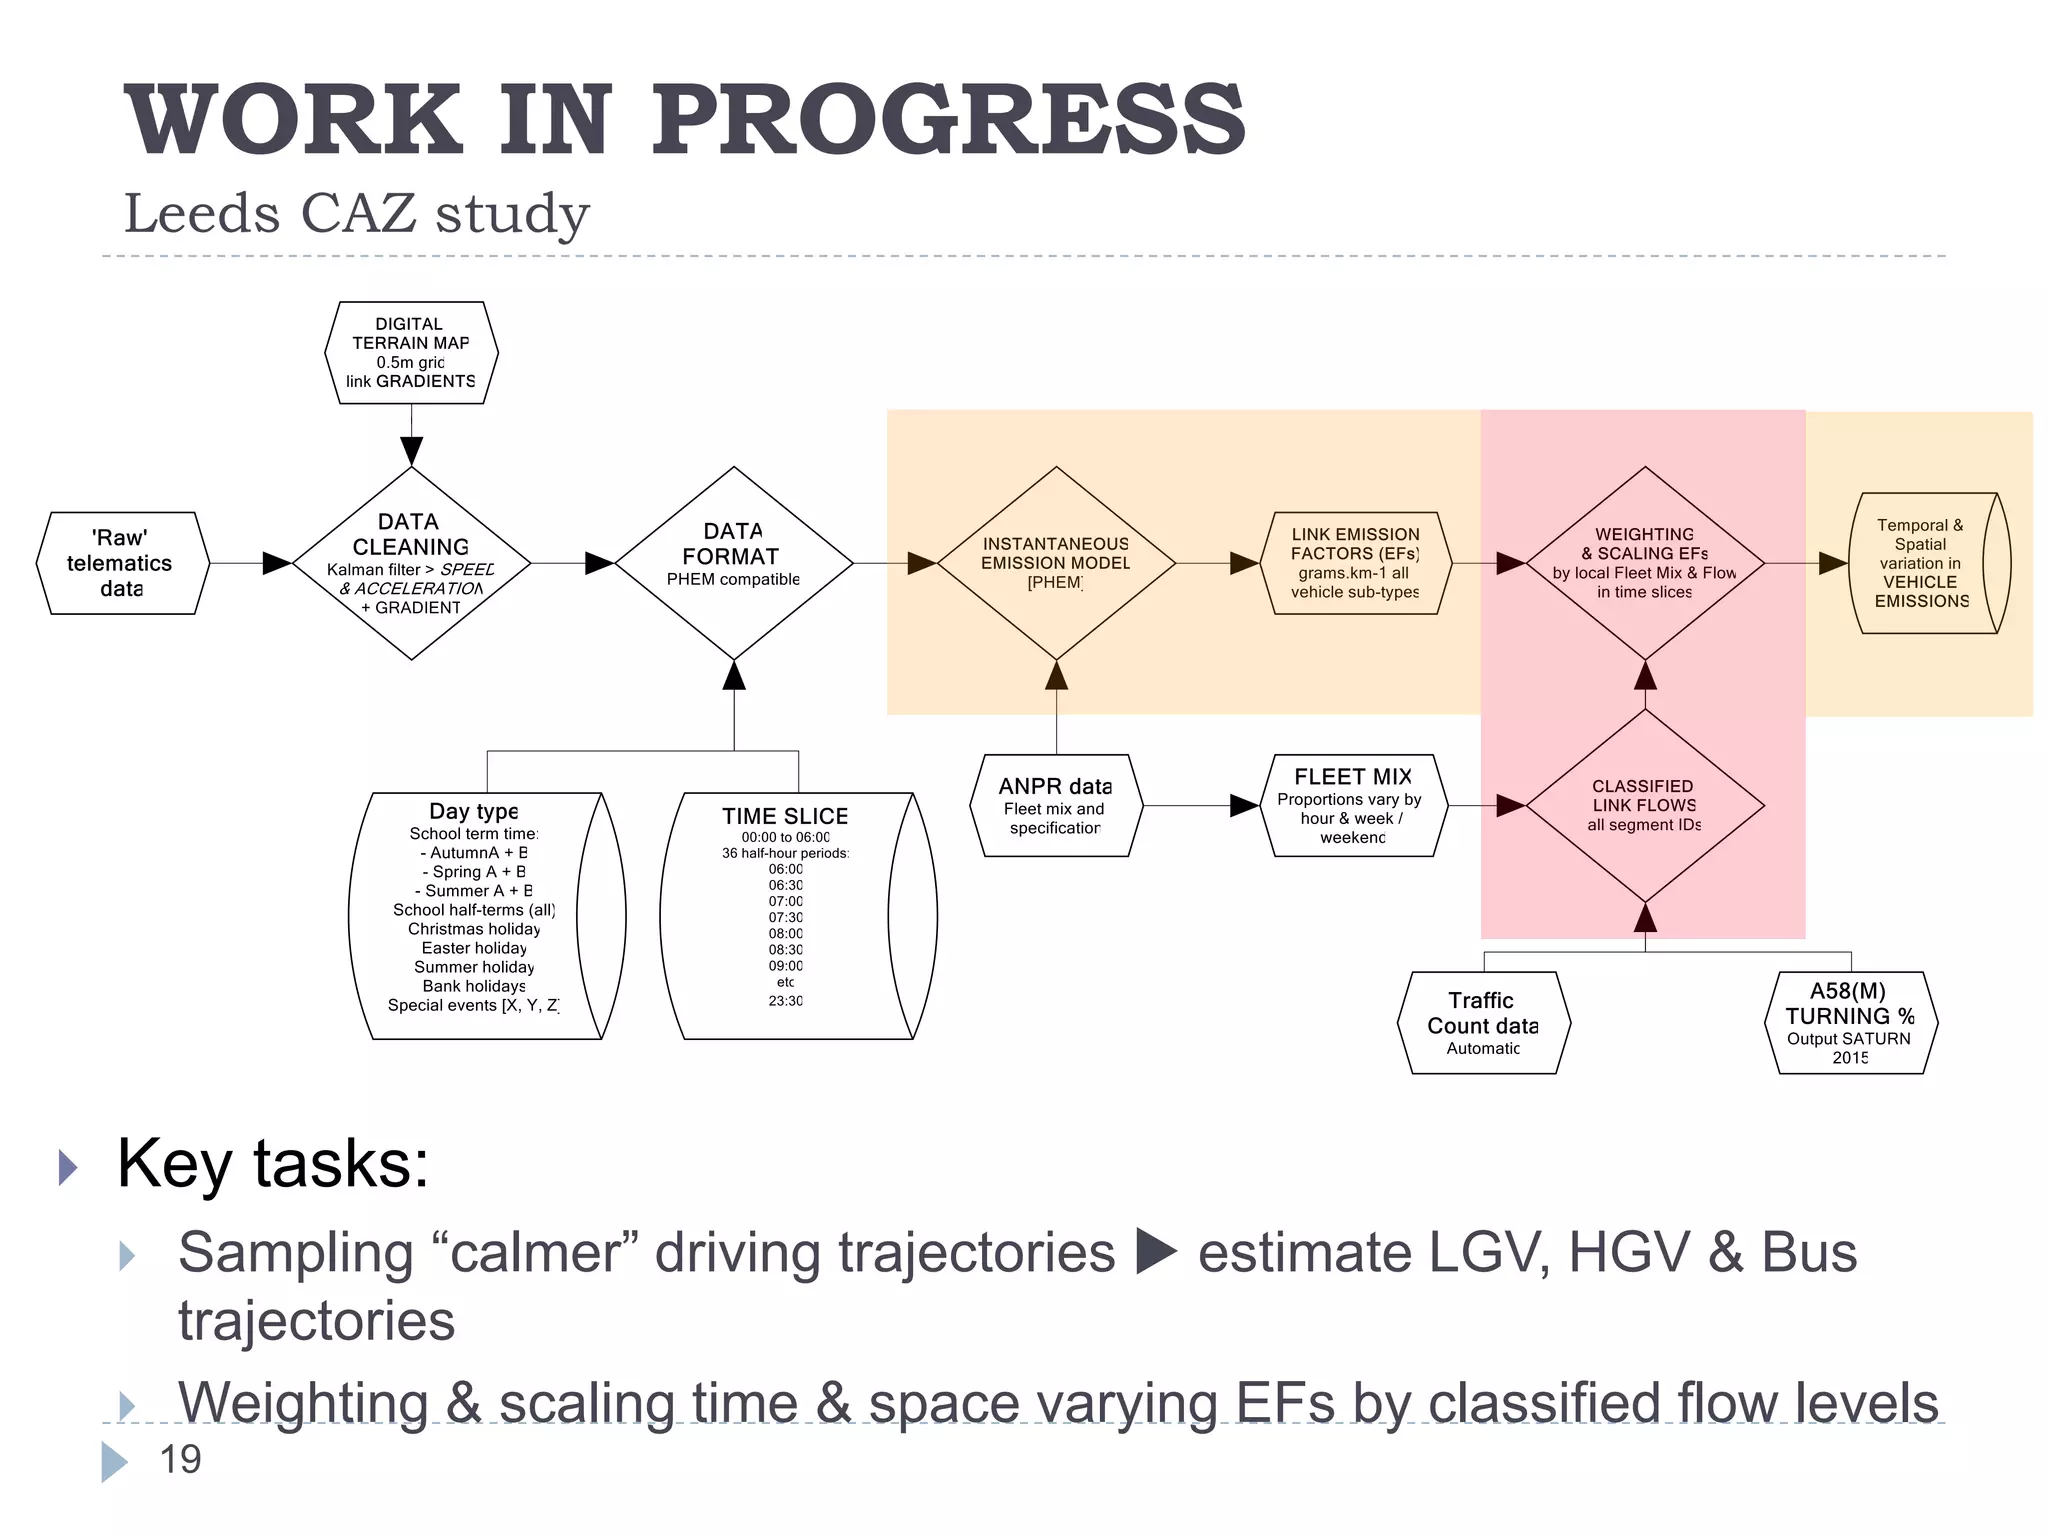
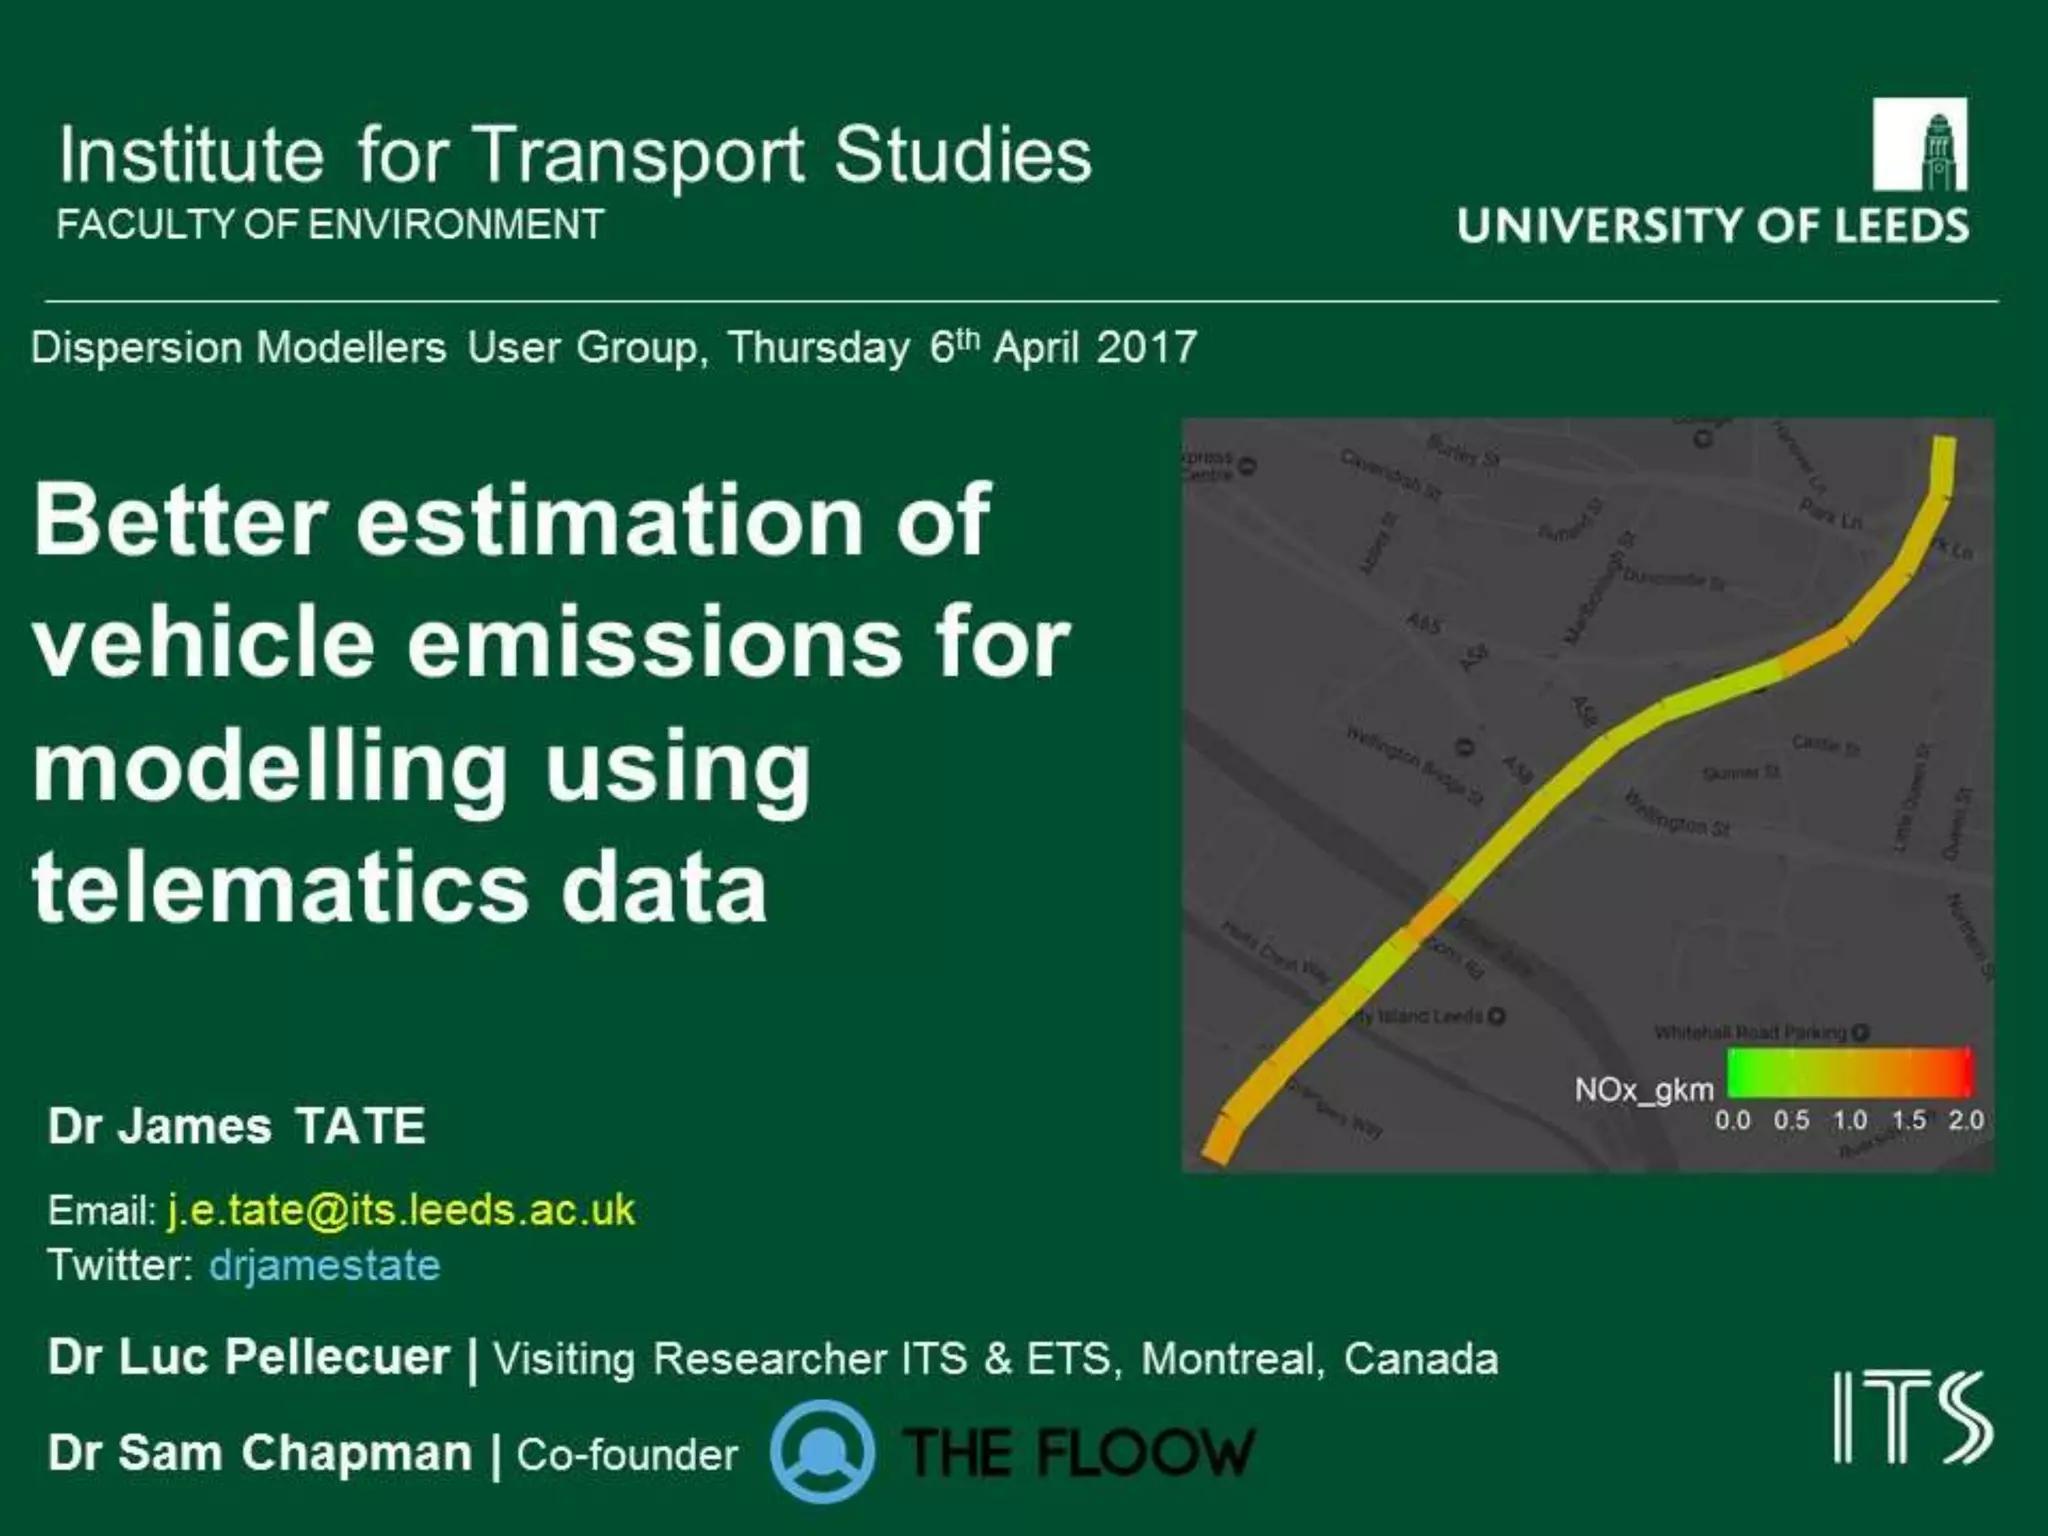
BIG telematics data
Vehicle tracking
2
Sources:
▶ Fleet surveillance
e.g.
• Eddie Stobbart
• Taxis*
• Insurance industry
 GPS and CAN/OBD
link ‘white box’
tracking
 Second-by-second
(1Hz) data
 Young driver bias
 Data anonymised
* Nyhan, M., Sobolevsky, S., Kang, C., Robinson, P., Corti, A., Szell, M., Streets, D., Lu, L., Britter, R., Barrett, S., Ratti, C. 2016. Predicting
vehicular emissions in high spatial resolution using pervasively measured transportation data and microscopic emissions model. Atmospheric
Environment 140 (2016) 352-363. http://dx.doi.org/10.1016/j.atmosenv.2016.06.018
BIG telematics data
www.thefloow.com| insights from telematics and mass mobility analysis
3 Chapman, S. 2016. Vehicular Air Pollution: Insights from telematics and mass mobility and analysis.
The Floow Ltd. Routes to Clean Air Conference, Bristol, October 2016
BENEFITS
BIG telematics data
4
Emission assessments
account for local, real-
driving conditions:
 Network-wide: No
boundaries
 Vehicle acceleration,
deceleration, cruising &
idling
 Variability in traffic flow
• Month of year
• Day of week
• Hour of day
• Holidays
• Special events
• Weather
• etc
FIGURE | Sample weekday GPS data by
hour
BACKGROUND WORK
Modelling vehicle movements & emissions
5
BACKGROUND RESEARCH
Traffic microsimulation & Instantaneous Emission Modelling
6
0 500 1000 1500 2000
0204060
Speed(km.h
1
)
Shipton Rd/
Water End
Salisbury Ter Leeman Rd/
Station Ave
Museum Str/
St Leonard's Pl
Bootham/
Gillygate
Shipton Rd/
Water End
0 500 1000 1500 2000
0246812
Fuel(g.sec
1
)
Shipton Rd/
Water End
Salisbury Ter Leeman Rd/
Station Ave
Museum Str/
St Leonard's Pl
Bootham/
Gillygate
Shipton Rd/
Water End
0 500 1000 1500 2000
050150250
NOX(mg.sec
1
)
NOx
NO2
Shipton Rd/
Water End
Salisbury Ter Leeman Rd/
Station Ave
Museum Str/
St Leonard's Pl
Bootham/
Gillygate
Shipton Rd/
Water End
0 500 1000 1500 2000
0123
Time (seconds)
PM(mg.sec
1
)
Shipton Rd/
Water End
Salisbury Ter Leeman Rd/
Station Ave
Museum Str/
St Leonard's Pl
Bootham/
Gillygate
Shipton Rd/
Water End
Time series plot of PHEM results for a sample simulated Euro 5 Bus operating the Park and Ride
service 2 in the AM peak: (a) Speed, (b) Fuel consumption, (c) NOX and NO2, (d) Particle Mass (PM)
* Zallinger, M., Tate, J., and Hausberger, S. 2008. An
instantaneous emission model for the passenger car
fleet. Transport and Air Pollution conference, Graz
2008
Moody, A., Tate, J. 2017. In Service CO2 and NOX
Emissions of Euro 6/VI Cars, Light- and Heavy- duty
goods Vehicles in Real London driving: Taking the
Road into the Laboratory. Journal of Earth Sciences
0 100 200 300 400 500
020406080
Speed(km.h
1
)
0 100 200 300 400 500
01234567
CO2(g.sec
1
)
0 100 200 300 400 500
0.000.020.040.06
Time (seconds)
NOX(g.sec
1
)
Modelled_CO2
Observed_CO2
0
2
4
6
8
0 2 4 6 8
Counts
1
1
2
3
4
6
8
11
16
22
31
43
61
86
121
171
241
UNDER-PINNING EMISSION MODEL
Instantaneous Emission Model PHEM*
Passenger car and Heavy-duty Emission Model (Euro 0 – 6 / VI)
FIGURES | Sample time series, TfL
London Drive Cycle, Euro 5 small family
diesel
CASE STUDIES
BIG telematics data
8
1. Leeds Clean Air Zone study
 One calendar year (May 2015 – May 2016)
 56,000 kms quality checked telematics data
 Supporting data
 Automatic Traffic Count (ATC) data (Leeds CC on A58M)
 Log special events, incidents etc.
 Turning proportions from 2015 traffic model (SATURN)
 Detailed fleet analysis from ANPR study (April 2016)
 Met. (wind speed, direction, temp, RH, rainfall)
2. Sheffield City Centre
 One calendar year (May 2014 – May 2015)
 15,000 kms quality checked telematics data
 Supporting data
 Met. (wind speed, direction, temp, RH, rainfall)
METHOD
BIG telematics data ▶ vehicle emissions
9
BIG telematics data
How good is the data?
10
 www.thefloow.com proprietary data handling & cleaning
processes
 ITS data quality checking / cleaning / processing routines
 Single journey of 56,000 kms journeys in the Leeds CAZ
study
LEEDS RESULTS
Passenger car NOX Emission Factors (EFs)
11
FIGURE | Average (all trajectories) passenger car NOX Emission Factors
(EFs)
LEEDS RESULTS
Passenger car NOX Emission Factors (EFs)
12
FIGURE | Passenger car NOX Emission Factors (EFs) all journeys
LEEDS RESULTS
Variation in time & space
13
FIGURE | Autumn term-time (first half) 08:00 – 08:30 hrs Direction South Bound
Passenger car (a) speed & (b) Euro 5 diesel car NOX Emission Factors
LEEDS RESULTS
Variation in time & space
14
FIGURE | Autumn term-time (first half) 08:00 – 08:30 hrs Direction North Bound
Passenger car (a) speed & (b) Euro 5 diesel car NOX Emission Factors
LEEDS RESULTS
Variation in time & space
15
FIGURE | Autumn term-time (first half) 12:00 – 12:30 hrs Direction South Bound
Passenger car (a) speed & (b) Euro 5 diesel car NOX Emission Factors
LEEDS RESULTS
Variation in time & space
16
FIGURE | Autumn term-time (first half) 12:00 – 12:30 hrs Direction North Bound
Passenger car (a) speed & (b) Euro 5 diesel car NOX Emission Factors
LEEDS RESULTS
Variation in time & space
17
FIGURE | Autumn term-time (first half) 17:00 – 17:30 hrs Direction South Bound
Passenger car (a) speed & (b) Euro 5 diesel car NOX Emission Factors
LEEDS RESULTS
Variation in time & space
18
FIGURE | Autumn term-time (first half) 17:00 – 17:30 hrs Direction North Bound
Passenger car (a) speed & (b) Euro 5 diesel car NOX Emission Factors
WORK IN PROGRESS
Leeds CAZ study
19
 Key tasks:
 Sampling “calmer” driving trajectories  estimate LGV, HGV & Bus
trajectories
 Weighting & scaling time & space varying EFs by classified flow levels
OUTLOOK
BIG telematics data
20
SHORT-TERM: Target Case Study applications
▶ Traffic management interventions
 Variable Speed Limits (VSL) & ‘Smart’ motorways
 Demand management to alleviate congestion
 Smoothing traffic flow including ecoDriving
 Complex, unstable, congested networks
 Challenging to observe & model traffic flow e.g. Leeds
LONG-TERM:
 Network wide, system approach
 Real-time fusion of telematics, fast IEM & in-situ flow
monitoring
 All vehicle types: Buses (e.g. iBus London) and HGVs
Dr James Tate - Better estimation of vehicle emissions for modelling - DMUG17

Dr James Tate - Better estimation of vehicle emissions for modelling - DMUG17

  • 2.
    BIG telematics data Vehicletracking 2 Sources: ▶ Fleet surveillance e.g. • Eddie Stobbart • Taxis* • Insurance industry  GPS and CAN/OBD link ‘white box’ tracking  Second-by-second (1Hz) data  Young driver bias  Data anonymised * Nyhan, M., Sobolevsky, S., Kang, C., Robinson, P., Corti, A., Szell, M., Streets, D., Lu, L., Britter, R., Barrett, S., Ratti, C. 2016. Predicting vehicular emissions in high spatial resolution using pervasively measured transportation data and microscopic emissions model. Atmospheric Environment 140 (2016) 352-363. http://dx.doi.org/10.1016/j.atmosenv.2016.06.018
  • 3.
    BIG telematics data www.thefloow.com|insights from telematics and mass mobility analysis 3 Chapman, S. 2016. Vehicular Air Pollution: Insights from telematics and mass mobility and analysis. The Floow Ltd. Routes to Clean Air Conference, Bristol, October 2016
  • 4.
    BENEFITS BIG telematics data 4 Emissionassessments account for local, real- driving conditions:  Network-wide: No boundaries  Vehicle acceleration, deceleration, cruising & idling  Variability in traffic flow • Month of year • Day of week • Hour of day • Holidays • Special events • Weather • etc FIGURE | Sample weekday GPS data by hour
  • 5.
    BACKGROUND WORK Modelling vehiclemovements & emissions 5
  • 6.
    BACKGROUND RESEARCH Traffic microsimulation& Instantaneous Emission Modelling 6 0 500 1000 1500 2000 0204060 Speed(km.h 1 ) Shipton Rd/ Water End Salisbury Ter Leeman Rd/ Station Ave Museum Str/ St Leonard's Pl Bootham/ Gillygate Shipton Rd/ Water End 0 500 1000 1500 2000 0246812 Fuel(g.sec 1 ) Shipton Rd/ Water End Salisbury Ter Leeman Rd/ Station Ave Museum Str/ St Leonard's Pl Bootham/ Gillygate Shipton Rd/ Water End 0 500 1000 1500 2000 050150250 NOX(mg.sec 1 ) NOx NO2 Shipton Rd/ Water End Salisbury Ter Leeman Rd/ Station Ave Museum Str/ St Leonard's Pl Bootham/ Gillygate Shipton Rd/ Water End 0 500 1000 1500 2000 0123 Time (seconds) PM(mg.sec 1 ) Shipton Rd/ Water End Salisbury Ter Leeman Rd/ Station Ave Museum Str/ St Leonard's Pl Bootham/ Gillygate Shipton Rd/ Water End Time series plot of PHEM results for a sample simulated Euro 5 Bus operating the Park and Ride service 2 in the AM peak: (a) Speed, (b) Fuel consumption, (c) NOX and NO2, (d) Particle Mass (PM)
  • 7.
    * Zallinger, M.,Tate, J., and Hausberger, S. 2008. An instantaneous emission model for the passenger car fleet. Transport and Air Pollution conference, Graz 2008 Moody, A., Tate, J. 2017. In Service CO2 and NOX Emissions of Euro 6/VI Cars, Light- and Heavy- duty goods Vehicles in Real London driving: Taking the Road into the Laboratory. Journal of Earth Sciences 0 100 200 300 400 500 020406080 Speed(km.h 1 ) 0 100 200 300 400 500 01234567 CO2(g.sec 1 ) 0 100 200 300 400 500 0.000.020.040.06 Time (seconds) NOX(g.sec 1 ) Modelled_CO2 Observed_CO2 0 2 4 6 8 0 2 4 6 8 Counts 1 1 2 3 4 6 8 11 16 22 31 43 61 86 121 171 241 UNDER-PINNING EMISSION MODEL Instantaneous Emission Model PHEM* Passenger car and Heavy-duty Emission Model (Euro 0 – 6 / VI) FIGURES | Sample time series, TfL London Drive Cycle, Euro 5 small family diesel
  • 8.
    CASE STUDIES BIG telematicsdata 8 1. Leeds Clean Air Zone study  One calendar year (May 2015 – May 2016)  56,000 kms quality checked telematics data  Supporting data  Automatic Traffic Count (ATC) data (Leeds CC on A58M)  Log special events, incidents etc.  Turning proportions from 2015 traffic model (SATURN)  Detailed fleet analysis from ANPR study (April 2016)  Met. (wind speed, direction, temp, RH, rainfall) 2. Sheffield City Centre  One calendar year (May 2014 – May 2015)  15,000 kms quality checked telematics data  Supporting data  Met. (wind speed, direction, temp, RH, rainfall)
  • 9.
    METHOD BIG telematics data▶ vehicle emissions 9
  • 10.
    BIG telematics data Howgood is the data? 10  www.thefloow.com proprietary data handling & cleaning processes  ITS data quality checking / cleaning / processing routines  Single journey of 56,000 kms journeys in the Leeds CAZ study
  • 11.
    LEEDS RESULTS Passenger carNOX Emission Factors (EFs) 11 FIGURE | Average (all trajectories) passenger car NOX Emission Factors (EFs)
  • 12.
    LEEDS RESULTS Passenger carNOX Emission Factors (EFs) 12 FIGURE | Passenger car NOX Emission Factors (EFs) all journeys
  • 13.
    LEEDS RESULTS Variation intime & space 13 FIGURE | Autumn term-time (first half) 08:00 – 08:30 hrs Direction South Bound Passenger car (a) speed & (b) Euro 5 diesel car NOX Emission Factors
  • 14.
    LEEDS RESULTS Variation intime & space 14 FIGURE | Autumn term-time (first half) 08:00 – 08:30 hrs Direction North Bound Passenger car (a) speed & (b) Euro 5 diesel car NOX Emission Factors
  • 15.
    LEEDS RESULTS Variation intime & space 15 FIGURE | Autumn term-time (first half) 12:00 – 12:30 hrs Direction South Bound Passenger car (a) speed & (b) Euro 5 diesel car NOX Emission Factors
  • 16.
    LEEDS RESULTS Variation intime & space 16 FIGURE | Autumn term-time (first half) 12:00 – 12:30 hrs Direction North Bound Passenger car (a) speed & (b) Euro 5 diesel car NOX Emission Factors
  • 17.
    LEEDS RESULTS Variation intime & space 17 FIGURE | Autumn term-time (first half) 17:00 – 17:30 hrs Direction South Bound Passenger car (a) speed & (b) Euro 5 diesel car NOX Emission Factors
  • 18.
    LEEDS RESULTS Variation intime & space 18 FIGURE | Autumn term-time (first half) 17:00 – 17:30 hrs Direction North Bound Passenger car (a) speed & (b) Euro 5 diesel car NOX Emission Factors
  • 19.
    WORK IN PROGRESS LeedsCAZ study 19  Key tasks:  Sampling “calmer” driving trajectories  estimate LGV, HGV & Bus trajectories  Weighting & scaling time & space varying EFs by classified flow levels
  • 20.
    OUTLOOK BIG telematics data 20 SHORT-TERM:Target Case Study applications ▶ Traffic management interventions  Variable Speed Limits (VSL) & ‘Smart’ motorways  Demand management to alleviate congestion  Smoothing traffic flow including ecoDriving  Complex, unstable, congested networks  Challenging to observe & model traffic flow e.g. Leeds LONG-TERM:  Network wide, system approach  Real-time fusion of telematics, fast IEM & in-situ flow monitoring  All vehicle types: Buses (e.g. iBus London) and HGVs