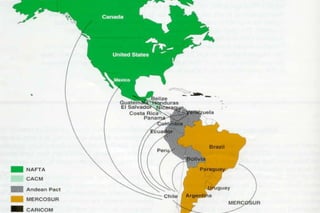
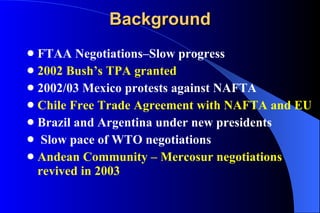
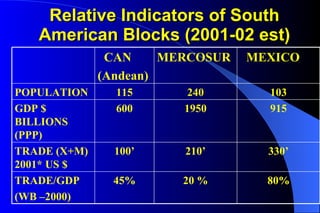
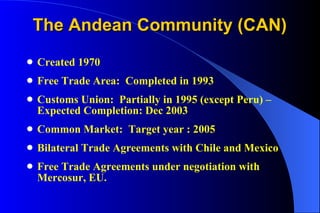
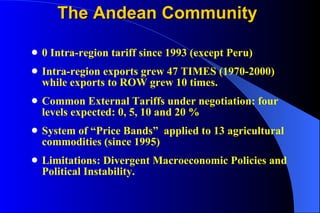
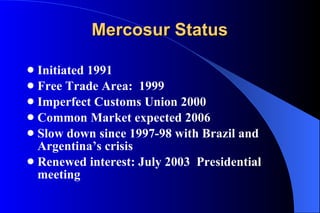
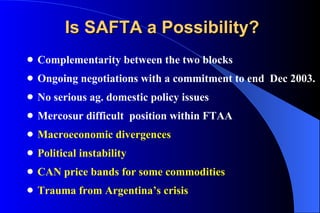
SAFTA: FTAA Southern Exposure  South American Perspective of Agricultural Free Trade Jaime Malaga Department of Agricultural and Applied Economics Texas Tech University
Overview South American Anxieties about Free Trade Status of Andean Community and Mercosur US-Andean Countries-Mercosur Ag. Trade Possible Scenarios for 2005: SAFTA?
 
Background FTAA Negotiations–Slow progress 2002 Bush’s TPA granted 2002/03 Mexico protests against NAFTA Chile Free Trade Agreement with NAFTA and EU Brazil and Argentina under new presidents Slow pace of WTO negotiations Andean Community – Mercosur negotiations revived in 2003
Relative Indicators of South American Blocks (2001-02 est) 80% 20 % 45% TRADE/GDP (WB –2000) 330’ 210’ 100’ TRADE (X+M) 2001* US $ 915 1950 600 GDP $ BILLIONS (PPP) 103 240 115 POPULATION MEXICO MERCOSUR CAN (Andean)
The Andean Community (CAN) Created 1970 Free Trade Area:  Completed in 1993 Customs Union:  Partially in 1995 (except Peru) – Expected Completion: Dec 2003  Common Market:  Target year : 2005 Bilateral Trade Agreements with Chile and Mexico Free Trade Agreements under negotiation with Mercosur, EU.
The Andean Community 0 Intra-region tariff since 1993 (except Peru) Intra-region exports grew 47 TIMES (1970-2000) while exports to ROW grew 10 times. Common External Tariffs under negotiation: four levels expected: 0, 5, 10 and 20 % System of “Price Bands”  applied to 13 agricultural commodities (since 1995) Limitations: Divergent Macroeconomic Policies and Political Instability.
Mercosur Status Initiated 1991 Free Trade Area:  1999 Imperfect Customs Union 2000 Common Market expected 2006 Slow down since 1997-98 with Brazil and Argentina’s crisis Renewed interest: July 2003  Presidential meeting
Mercosur 2003 Presidential Meeting: July 03 Renewed Commitment for a Common Market in 2006. Conditioning FTAA to negotiations on “domestic subsidies ” Commitment to finish negotiations with CAN (Andean Community) by Dec 2003. Continue Trade negotiations with EU
Mercosur-Andean 2003 Serious negotiations 2002 (South America FTA) Separate preferential agreements (Brazil Argentina) Target date for ending negotiations:December 2003. MERCOSUR Presidential (June 03) and CAN Presidential (July 03) confirmed commitments. Brazil’s President attends the CAN Presidential   Both blocks agree to meet before next FTAA ministerial to negotiate as a block
US- AC Ag.Trade Balance 90-00
US Ag. Exports to South America 1990-2001 ANDEAN COUNTRIES  70%
Andean Countries Import High % of US Ag. Exports to South America (2000) SOYBEANS    100% SOYBEAN OIL  100% CORN   90% WHEAT    89% RICE  86% FRUITS  82% SOYBEAN MEAL  62% COTTON  55%
Largest LA markets for the top US exports (Mexico excluded)1990-2001 WHEAT 1 Venezuela 2 Colombia 3 Peru 4 Ecuador 5 Dominican Rep. CORN 1. Colombia 2. Venezuela 3. Dominican Rep. 4. Peru 5. Chile
Mercosur Export Commodities Soybeans Wheat Corn Rice Beef Soybean oil/meal Fruits
Is SAFTA a Possibility? Complementarity between the two blocks Ongoing negotiations with a commitment to end  Dec 2003. No serious ag. domestic policy issues Mercosur difficult  position within FTAA Macroeconomic divergences Political instability CAN price bands for some commodities Trauma from Argentina’s crisis
Possible Trade Scenarios for 2005 and Beyond in South American Trade FTAA Implementation  ?  Mercosur “Agricultural Subsidies” position Brazil’s demand for market access: Sugar, OJ, Steel Andean “Price Bands” policy Andean Community and Mercosur Independently Common Markets  NAFTA – Andean Community FTA SAFTA?  South American Free Trade Area -Macroeconomic divergences -Political instability

Jaimepres2

  • 1.
    SAFTA: FTAA SouthernExposure South American Perspective of Agricultural Free Trade Jaime Malaga Department of Agricultural and Applied Economics Texas Tech University
  • 2.
    Overview South AmericanAnxieties about Free Trade Status of Andean Community and Mercosur US-Andean Countries-Mercosur Ag. Trade Possible Scenarios for 2005: SAFTA?
  • 3.
  • 4.
    Background FTAA Negotiations–Slowprogress 2002 Bush’s TPA granted 2002/03 Mexico protests against NAFTA Chile Free Trade Agreement with NAFTA and EU Brazil and Argentina under new presidents Slow pace of WTO negotiations Andean Community – Mercosur negotiations revived in 2003
  • 5.
    Relative Indicators ofSouth American Blocks (2001-02 est) 80% 20 % 45% TRADE/GDP (WB –2000) 330’ 210’ 100’ TRADE (X+M) 2001* US $ 915 1950 600 GDP $ BILLIONS (PPP) 103 240 115 POPULATION MEXICO MERCOSUR CAN (Andean)
  • 6.
    The Andean Community(CAN) Created 1970 Free Trade Area: Completed in 1993 Customs Union: Partially in 1995 (except Peru) – Expected Completion: Dec 2003 Common Market: Target year : 2005 Bilateral Trade Agreements with Chile and Mexico Free Trade Agreements under negotiation with Mercosur, EU.
  • 7.
    The Andean Community0 Intra-region tariff since 1993 (except Peru) Intra-region exports grew 47 TIMES (1970-2000) while exports to ROW grew 10 times. Common External Tariffs under negotiation: four levels expected: 0, 5, 10 and 20 % System of “Price Bands” applied to 13 agricultural commodities (since 1995) Limitations: Divergent Macroeconomic Policies and Political Instability.
  • 8.
    Mercosur Status Initiated1991 Free Trade Area: 1999 Imperfect Customs Union 2000 Common Market expected 2006 Slow down since 1997-98 with Brazil and Argentina’s crisis Renewed interest: July 2003 Presidential meeting
  • 9.
    Mercosur 2003 PresidentialMeeting: July 03 Renewed Commitment for a Common Market in 2006. Conditioning FTAA to negotiations on “domestic subsidies ” Commitment to finish negotiations with CAN (Andean Community) by Dec 2003. Continue Trade negotiations with EU
  • 10.
    Mercosur-Andean 2003 Seriousnegotiations 2002 (South America FTA) Separate preferential agreements (Brazil Argentina) Target date for ending negotiations:December 2003. MERCOSUR Presidential (June 03) and CAN Presidential (July 03) confirmed commitments. Brazil’s President attends the CAN Presidential Both blocks agree to meet before next FTAA ministerial to negotiate as a block
  • 11.
    US- AC Ag.TradeBalance 90-00
  • 12.
    US Ag. Exportsto South America 1990-2001 ANDEAN COUNTRIES 70%
  • 13.
    Andean Countries ImportHigh % of US Ag. Exports to South America (2000) SOYBEANS 100% SOYBEAN OIL 100% CORN 90% WHEAT 89% RICE 86% FRUITS 82% SOYBEAN MEAL 62% COTTON 55%
  • 14.
    Largest LA marketsfor the top US exports (Mexico excluded)1990-2001 WHEAT 1 Venezuela 2 Colombia 3 Peru 4 Ecuador 5 Dominican Rep. CORN 1. Colombia 2. Venezuela 3. Dominican Rep. 4. Peru 5. Chile
  • 15.
    Mercosur Export CommoditiesSoybeans Wheat Corn Rice Beef Soybean oil/meal Fruits
  • 16.
    Is SAFTA aPossibility? Complementarity between the two blocks Ongoing negotiations with a commitment to end Dec 2003. No serious ag. domestic policy issues Mercosur difficult position within FTAA Macroeconomic divergences Political instability CAN price bands for some commodities Trauma from Argentina’s crisis
  • 17.
    Possible Trade Scenariosfor 2005 and Beyond in South American Trade FTAA Implementation ? Mercosur “Agricultural Subsidies” position Brazil’s demand for market access: Sugar, OJ, Steel Andean “Price Bands” policy Andean Community and Mercosur Independently Common Markets NAFTA – Andean Community FTA SAFTA? South American Free Trade Area -Macroeconomic divergences -Political instability