Iy3416321635
•
0 likes•157 views

International Journal of Engineering Research and Applications (IJERA) is an open access online peer reviewed international journal that publishes research and review articles in the fields of Computer Science, Neural Networks, Electrical Engineering, Software Engineering, Information Technology, Mechanical Engineering, Chemical Engineering, Plastic Engineering, Food Technology, Textile Engineering, Nano Technology & science, Power Electronics, Electronics & Communication Engineering, Computational mathematics, Image processing, Civil Engineering, Structural Engineering, Environmental Engineering, VLSI Testing & Low Power VLSI Design etc.

Recommended
Recommended
More Related Content
What's hot
What's hot (10)
Viewers also liked
Similar to Iy3416321635
Similar to Iy3416321635 (20)
Recently uploaded
Recently uploaded (20)
Iy3416321635
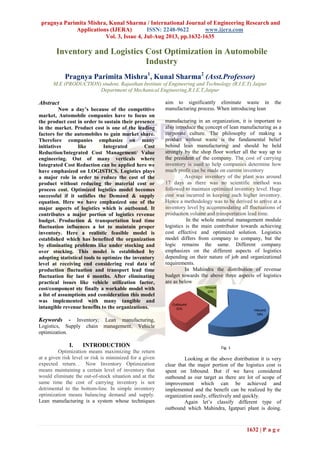
- 1. pragnya Parimita Mishra, Kunal Sharma / International Journal of Engineering Research and Applications (IJERA) ISSN: 2248-9622 www.ijera.com Vol. 3, Issue 4, Jul-Aug 2013, pp.1632-1635 1632 | P a g e Inventory and Logistics Cost Optimization in Automobile Industry Pragnya Parimita Mishra1 , Kunal Sharma2 (Asst.Professor) M.E (PRODUCTION) student, Rajasthan Institute of Engineering and Technology (R.I.E.T) Jaipur Department of Mechanical Engineering,R.I.E.T,Jaipur Abstract Now a day’s because of the competitive market, Automobile companies have to focus on the product cost in order to sustain their presence in the market. Product cost is one of the leading factors for the automobiles to gain market share. Therefore companies emphasize on many initiatives like Integrated Cost Reduction/Integrated Cost Management/ Value engineering. Out of many verticals where Integrated Cost Reduction can be applied here we have emphasized on LOGISTICS. Logistics plays a major role in order to reduce the cost of the product without reducing the material cost or process cost. Optimized logistics model becomes successful if it satisfies the Demand & supply equation. Here we have emphasized one of the major aspects of logistics which is outbound. It contributes a major portion of logistics revenue budget. Production & transportation lead time fluctuation influences a lot to maintain proper inventory. Here a realistic feasible model is established which has benefited the organization by eliminating problems like under stocking and over stocking. This model is established by adopting statistical tools to optimize the inventory level at receiving end considering real data of production fluctuation and transport lead time fluctuation for last 6 months. After eliminating practical issues like vehicle utilization factor, cost/component etc finally a workable model with a list of assumptions and consideration this model was implemented with many tangible and intangible revenue benefits to the organizations. Keywords - Inventory, Lean manufacturing, Logistics, Supply chain management, Vehicle optimization. I. INTRODUCTION Optimization means maximizing the return at a given risk level or risk is minimized for a given expected return. . Now Inventory Optimization means maintaining a certain level of inventory that would eliminate the out-of-stock situation and at the same time the cost of carrying inventory is not detrimental to the bottom-line. In simple inventory optimization means balancing demand and supply. Lean manufacturing is a system whose techniques aim to significantly eliminate waste in the manufacturing process. When introducing lean manufacturing in an organization, it is important to also introduce the concept of lean manufacturing as a corporate culture. The philosophy of making a product without waste is the fundamental belief behind lean manufacturing and should be held strongly by the shop floor worker all the way up to the president of the company. The cost of carrying inventory is used to help companies determine how much profit can be made on current inventory Average inventory of the plant was around 17 days as there was no scientific method was followed to maintain optimized inventory level. Huge cost was incurred in keeping such higher inventory. Hence a methodology was to be derived to arrive at a inventory level by accommodating all fluctuations of production volume and transportation lead time. In the whole material management module logistics is the main contributor towards achieving cost effective and optimized solution. Logistics model differs from company to company, but the logic remains the same. Different company emphasizes on the different aspects of logistics depending on their nature of job and organizational requirements. In Mahindra the distribution of revenue budget towards the above three aspects of logistics are as below Looking at the above distribution it is very clear that the major portion of the logistics cost is spent on Inbound. But if we have considered outbound as our target as there are lot of scope of improvement which can be achieved and implemented and the benefit can be realized by the organization easily, effectively and quickly. Again let’s classify different type of outbound which Mahindra, Igatpuri plant is doing. Fig. 1
- 2. pragnya Parimita Mishra, Kunal Sharma / International Journal of Engineering Research and Applications (IJERA) ISSN: 2248-9622 www.ijera.com Vol. 3, Issue 4, Jul-Aug 2013, pp.1632-1635 1633 | P a g e Basically it is an engine plant. It manufactures different type of engines for their different products which are getting assembled in different locations (Nashik, Zaheerabad & Hardwar). Igatpuri plant dispatches engines to the above locations as per their production plans whose cost is born by Igatpiuri plant. Maximum cost is involved in dispatching engines from Igatpuri to Haridwar. This is because of the distance between the location and production fluctuation is very high. In order to meet the demand of Haridwar plant and to avoid production stoppage high inventory level is maintained at Haridwar plant. We have collected data of Inventory level at Haridwar plant for 1 month at a production level of 150/Day (Peak production) which was as below Fig.2 From Fig-4 average inventory is found to be 17 days, minimum 10 days and maximum 23 days. The transit lead time is only 5-7 days. This inventory level differs from time to time as there was no standardized method or methodology to define the maximum allowable inventory level. Hence standardized method is to be established by applying statistical tools to define optimized inventory level which will optimize the inventory carrying cost by keeping demand supply equation intact. II. INVENTORY OPTIMIZATION MODEL Problem Statement: Inventory carrying cost for keeping an inventory of more than 25 days seems to be very high. It was very subjective whether this inventory is high or low or optimum. This is because there is no scientific and logical method to define how much inventory is to be kept which will make the process reliable and sustainable. 2.1 Calculation: We have collected the data of last 30 transactions of lead time, demand to calculate the optimum inventory. Lead time (L) 5 5 5 5 6 7 8 7 5 4 6 7 5 5 5 5 6 7 7 7 5 7 7 7 6 4 4 6 6 7 Mean (Ml) =5.86 Standard Deviation (σl) = = 1.1 Demand (D) Mean (Md) = 189.83 Standard Deviation (σd)= = 2.55 Cost of Under Stocking = Cu Cost of over stocking = Co = 0.01 times of cost of under stocking = 0.01 Cu CSL = Cu / (Cu + Co) = 1/1.01 = 0.9901 (Ref: Operational research Text Book) Z=2.33 There are 2 types of review process to control the inventory level in order to keep it within the optimized level Constant review process Lead Time variation = σl Variation in Quantity due to Lead Time= σl x Md Variation due to demand variation= σd Variance of demand during lead time=Ml x σd 2 Fig. 3 Fig. 4 Fig. 5
- 3. pragnya Parimita Mishra, Kunal Sharma / International Journal of Engineering Research and Applications (IJERA) ISSN: 2248-9622 www.ijera.com Vol. 3, Issue 4, Jul-Aug 2013, pp.1632-1635 1634 | P a g e Variance of demand due to variation in lead time = (σd x Md)2 Total variance of demand during the lead time = Ml x σd 2 + (σl x Md)2 Std Deviation of demand during lead time = √(Ml x σd 2 + (σl x Md)2 ) Safety Stock = z x √(Ml x σd 2 + (σl x Md)2 ) = 2.33 x √( 5.86 x (2.55)2 + (1.1*189.83)2 ) = 463.044 Conclusion: So total 464 number of safety stock has to be kept at Vehicle Manufacturing area for constant review process Periodic review process For a Periodic Review Process (3 days): T= 3 Lead Time variation = Sl Variation in Quantity due to Lead Time= σl x Md Variation due to demand variation= σd Variance of demand during lead time = (Ml+T) x σd 2 Variance of demand due to variation in lead time = square (σl x Md)2 Total variance of demand during the lead time = (Ml+T) x σd 2 + (σl x Md)2 Std Deviation of demand during lead time = √ ((Ml+T) x σd 2 + (σl x Md)2 ) Safety Stock = z x √ ((Ml+T) x σd 2 + (σl x Md)2 ) = 2.33 * √ ( (5.86 + 3)* 2.552 + (1.1*189.83)2 ) = 463.23 Conclusion: So total 464 number of safety stock has to be kept at Vehicle Manufacturing area for a periodic review in 3 days of interval. Finally after using the statistical tool optimized inventory level is calculated. The above calculated inventory level is theoretical calculation which is still to be redefined after experiment of practical feasibility. In order to maintain the above the inventory level the below assumptions are to be considered for smooth operations: 1. Transit lead time is assumed to be 5~6 days. 2. Production volume is assumed to be ~190/Day 3. Everyday 204 engines should dispatch from Igatpuri Plant. 4. In ideal situation after every 14 dispatches 1 day will have no dispatches 5. Everyday 47 empty pallets are to be dispatched from haridwar to Igatpuri 6. Transit lead time of reverse logistics is also assumed to be 5~6 days There are certain challenges which are expected in order to make the above optimization project a practical, feasible and workable model. i. Transit time ii. Production volume iii. Availability of the vehicles and availability of empty pallets iv. Cost/engine Constraints Out of all the 6 constraints demonstrated in the most important and significant is the 1st two. After analyzing we found that transportation cost from Igatpuri to Haridwar plant to be reduced from Rs. 605/ to Rs. 212/. In order to act on the above problem statement we need to establish a relationship of all factors which contribute towards the cost/engine. If we look at the process mostly 5 broad level factors come into the picture as mentioned below. All above dimensions were discussed with the higher authorities and experiments were conducted by trying few of the above aspects by discussing with different service providers and comparing the price prevailing in the market. Finally it was concluded that the method of loading and pallet design will be revisited in order to increase the capacity of the vehicle which ultimately will result in reducing the cost/engine. A lot of air space was unutilized in the existing method of pallet stacking method. Therefore the pallets were made collapsible as shown in the below picture With the above modification below results were achieved 70% utilization of the vehicle was not able result 65% reduction in the Cost/engine which was the target of the problem statement. Again value engineering was done and further modified pallets were fabricated to increase the vehicle utilization factor. 2.2 Results Fig. 7 Fig. 6
- 4. pragnya Parimita Mishra, Kunal Sharma / International Journal of Engineering Research and Applications (IJERA) ISSN: 2248-9622 www.ijera.com Vol. 3, Issue 4, Jul-Aug 2013, pp.1632-1635 1635 | P a g e With this the utilization of the vehicle was maximum. The cost/engine and other benefits are calculated and shown below This project is a practical and feasible model which was implemented on trial basis and proved to be successful. But in a long run it may create problem as the model is based on certain assumptions and considerations which may get varied in due course of time. In order to sustain the operation of this model and at the same time sustain the cost saving all process parameters are to be monitored closely so that any deviations in any parameter should reflect immediately. Many people sitting at remote locations will be operating on this model, many agencies will be involved. Therefore unless every individual is forced to operate in a common platform this will create much subjectivity in the operation and will lead to ambiguity and confusion. Hence low cost software is required which will display the current status of all the process parameters which ultimately will give the efficiency of the operational model. All abnormalities and deviations should get reflected in the software which will be able to calculate the efficiency and effectiveness of the system. REFERENCES Journal Papers: [1] Halldorsson, A., Kotzab, H., Mikkola, J. H., Skjoett-Larsen, T. (2007). Complementary theories to supply chain management. Supply Chain Management: An International Journal, Volume 12 Issue 4, 284-296. [2] Kouvelis, P.; Chambers, C.; Wang, H. (2006): Supply Chain Management Research and Production and Operations Management: Review, Trends, and Opportunities. In: Production and Operations Management, Vol. 15 [3] Ydstie, B. E., Grossmann, I. E., Perea- López, E., 2003, A Model predictive control strategy for supply chain optimization. In Computers and Chemical Engineering, Vol 27, pp. 1202-1218 [4] Towill, D. R., 1996. Industrial dynamics modeling of supply chains. In International Journal of Physical Distribution & Logistics Management, Vol. 26, No. 2, pp.23–42 [5] Bour Land K, S. Powell, D. Pyke., 1996, Exploiting Timely Demand Information to Reduce Inventories. European Journal of Operations Research, 92. [6] Burges Rachel.,1998, Avoiding Supply Chain Management failure: Lesson from Business Process Re-Engineering. International Journal of Logistic Management, 9(2). [7] Lin Fu-Ren, Slaw M.J., 1998, Re- Engineering The Order Fulfillment Process In Supply Chain Network. International Journal of flexible manufacturing systems, 10, 197-229 Books: [8] Susan Mallik (2010). In Hossein Bidgoil. The Handbook of Technology Management: Supply Chain Management, Marketing and Advertising, and Global Management, vol 2 (1 ed.). Hoboken, New Jersey: John Wiley @ Sons, Inc. p. 104. ISBN 978-0-470- 24948-2. [9] Hossein Bidgoil. ed. The Handbook of Technology Management: Supply Chain Management, Marketing and Advertising, and Global Management, vol 2 (1 ed.). Hoboken, New Jersey: John Wiley @ Sons, Inc. [10] Bodington C.E., 1995, Planning Scheduling and Control Integration in theProcessIndustries. MCGraw thill, Newyork. Chapters in Books: [11] Eric Teicholz: Facility Design and Management Handbook. STRATEGIC PLANNING, Chapter-2 (McGraw- HillProfessional,2001), AccessEngineering Theses: [12] Baziotopoulos (2008). An Investigation of Logistics Outsourcing Practices In the Greek Manufacturing Sector. PhD thesis. Proceedings Papers: [13] Bowersox D.J., 1997, Lessons Learned from World Class Leaders. SupplyChain Management Review, 1(1). [14] Eisenhurdt K., 1989, Building Theories From Case Study Research. Academy of management review, 14(4), 532 - 550. Fig. 8