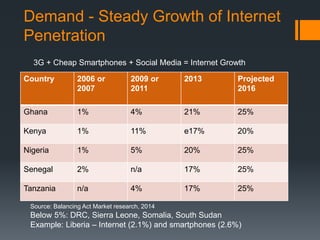
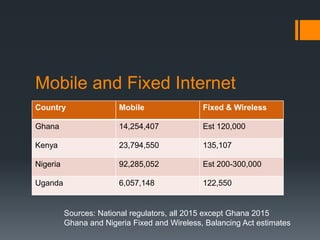
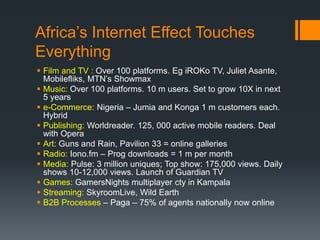
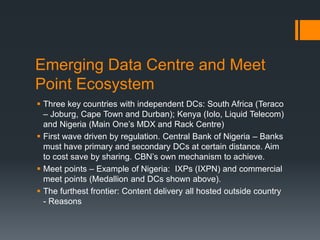
Unlocking Africa’s Digital
Potential – ITW 2016
Russell Southwood, CEO, Balancing Act
www.balancingact-africa.com
@balancingactafr
Africa’s Digital Road Map – Where
we’ve come from
The end of selling shortage – satellite to fibre – more competition – - mobile voice to
data - cheaper wholesale and retail prices - Split between slow lane and fast lane
countries – The transition has its pitfalls but is happening
Africa’s Digital road map – where we’re
going
The move from infrastructure to services and applications – the arrival of “critical
mass” of users – trends begin to reinforce each other – convergent content –
media as online players – Rise of African consumers
Everything turns into data
 What’s App, Viber (Mali example), Skype – Past peak SMS?
 Smile – Data as minutes and then just data?
 More investment, less returns – Layered markets and
infrastructure sharing
 Need to move from narrow straw (2G) to broad pipe (fibre for
4G)
 Networks not ready (eg East African streaming platform on 3G)
 Shift to 4G and eventually 5G
 Data at commodity prices
 The end of mobile operators as we know them now
 Data companies (selling high volume, low price data) and
content and services companies. Hard for mobile operators to
be the latter (examples MTN, Tigo and Orange). You can’t be
everything
Supply - International infrastructure
 International: 9 cables landed.
Nigeria: 15 Tbps
 Countries: All capitals
connected by fibre except in
Eritrea and South Sudan
 Another Cable: Africa One
Cable – 12,000 kms along
East Coast + 5,000 kms
branching. -> Saudi Arabia,
Egypt and Pakistan
 Changing business models:
Seacom’s Fibre Internet
Access – 25 mbps – 1GB
Supply: National and local
infrastructure
 National: Steady roll-out. Largely
competitive in East Africa but
continuing market blockage
elsewhere.
 Carriers carriers: Liquid Telecom
largest carriers’ carriers. Only
national companies elsewhere
 Different Ways: Infrastructure
sharing? Dark fibre (DFA)?
Alternative fibre (FibreCo,
Powerline fibre)?
 Nov 2014 – 44% of population
within reach of fibre
 Local access: Largely gone mobile
3G but now increasingly 4G and
WiFi hot spots… FTTH.
 Quality and reliability issues on
worst routes
Supply – Connecting the
uncovered: A schematic view
Online Coverage, but not Online
Internet Access in Africa
(approximation by population group)
No Coverage
Affordability (supply side)
Digital Literacy (demand side)
Locally relevant content/services (demand side)
Improved quality
Capex
Subsidy
New Tech
~20% ~60% ~20%
Legend:
• Challenges: Price/income, literacy/education, gender gap, power, etc
• New Business Models: Vanu, Argon Telecom, Mawingu, Virural,
And Inveneo
• Options: Mobile operators; mobile franchisees, new independents
Supply – Value Chain Pressures
International National Metronet Local Access
Prices at
commodity level
– Sub $100 at
volume
Prices will move
to commodity
level in
medium-term
Sub US$00s at
volume
Prices will move
to commodity
level in
medium-term
Sub US$00s at
volume
Prices lower to
create greater
volumes
• Still big issues for landlocked countries with transit prices
• Big split between liberalised countries and the unliberalised (like
Ethiopia, Djibouti, Angola, Cameroon)
Demand - Steady Growth of Internet
Penetration
Country 2006 or
2007
2009 or
2011
2013 Projected
2016
Ghana 1% 4% 21% 25%
Kenya 1% 11% e17% 20%
Nigeria 1% 5% 20% 25%
Senegal 2% n/a 17% 25%
Tanzania n/a 4% 17% 25%
Source: Balancing Act Market research, 2014
Below 5%: DRC, Sierra Leone, Somalia, South Sudan
Example: Liberia – Internet (2.1%) and smartphones (2.6%)
3G + Cheap Smartphones + Social Media = Internet Growth
Mobile and Fixed Internet
Country Mobile Fixed & Wireless
Ghana 14,254,407 Est 120,000
Kenya 23,794,550 135,107
Nigeria 92,285,052 Est 200-300,000
Uganda 6,057,148 122,550
Sources: National regulators, all 2015 except Ghana 2015
Ghana and Nigeria Fixed and Wireless, Balancing Act estimates
Africa’s Internet Effect Touches
Everything
 Film and TV : Over 100 platforms. Eg iROKo TV, Juliet Asante,
Mobilefliks, MTN’s Showmax
 Music: Over 100 platforms. 10 m users. Set to grow 10X in next
5 years
 e-Commerce: Nigeria – Jumia and Konga 1 m customers each.
Hybrid
 Publishing: Worldreader. 125, 000 active mobile readers. Deal
with Opera
 Art: Guns and Rain, Pavilion 33 = online galleries
 Radio: Iono.fm – Prog downloads = 1 m per month
 Media: Pulse: 3 million uniques; Top show: 175,000 views. Daily
shows 10-12,000 views. Launch of Guardian TV
 Games: GamersNights multiplayer cty in Kampala
 Streaming: SkyroomLive, Wild Earth
 B2B Processes – Paga – 75% of agents nationally now online
Emerging Data Centre and Meet
Point Ecosystem
 Three key countries with independent DCs: South Africa (Teraco
– Joburg, Cape Town and Durban); Kenya (Iolo, Liquid Telecom)
and Nigeria (Main One’s MDX and Rack Centre)
 First wave driven by regulation. Central Bank of Nigeria – Banks
must have primary and secondary DCs at certain distance. Aim
to cost save by sharing. CBN’s own mechanism to achieve.
 Meet points – Example of Nigeria: IXPs (IXPN) and commercial
meet points (Medallion and DCs shown above).
 The furthest frontier: Content delivery all hosted outside country
- Reasons
The Next Big Step Up – 4G
 The Price Glide with 3G – Accelerating high volume use
earlier?
 10-20-fold inc in 1st wave, more to come. 100-200% with 4G.
Example of Nigeria: Somewhere just north of 500 mbps use..
 4G launched in 45 countries with 63 operator launches. 154
projects in pipeline
 High end users on Smile in 2015 in Uganda: 8-12 GBs per
month.
 With right pricing, data use and data volumes will increase
Can we meet the challenges?
 4 key questions for the session:
 How can the retail price of Internet come down as fast as
possible to increase volumes?
 How can operators help deliver “low-cost, high-volume”
wholesale and retail bandwidth to less liberalised countries?
 How can operators work with others to improve both uptime
and reliability?
 How can mobile operators deal with market blockages at
content and services level (revenue share, payment
methods)?

ITW 2016 presentation

  • 1.
    Unlocking Africa’s Digital Potential– ITW 2016 Russell Southwood, CEO, Balancing Act www.balancingact-africa.com @balancingactafr
  • 2.
    Africa’s Digital RoadMap – Where we’ve come from The end of selling shortage – satellite to fibre – more competition – - mobile voice to data - cheaper wholesale and retail prices - Split between slow lane and fast lane countries – The transition has its pitfalls but is happening
  • 3.
    Africa’s Digital roadmap – where we’re going The move from infrastructure to services and applications – the arrival of “critical mass” of users – trends begin to reinforce each other – convergent content – media as online players – Rise of African consumers
  • 4.
    Everything turns intodata  What’s App, Viber (Mali example), Skype – Past peak SMS?  Smile – Data as minutes and then just data?  More investment, less returns – Layered markets and infrastructure sharing  Need to move from narrow straw (2G) to broad pipe (fibre for 4G)  Networks not ready (eg East African streaming platform on 3G)  Shift to 4G and eventually 5G  Data at commodity prices  The end of mobile operators as we know them now  Data companies (selling high volume, low price data) and content and services companies. Hard for mobile operators to be the latter (examples MTN, Tigo and Orange). You can’t be everything
  • 5.
    Supply - Internationalinfrastructure  International: 9 cables landed. Nigeria: 15 Tbps  Countries: All capitals connected by fibre except in Eritrea and South Sudan  Another Cable: Africa One Cable – 12,000 kms along East Coast + 5,000 kms branching. -> Saudi Arabia, Egypt and Pakistan  Changing business models: Seacom’s Fibre Internet Access – 25 mbps – 1GB
  • 6.
    Supply: National andlocal infrastructure  National: Steady roll-out. Largely competitive in East Africa but continuing market blockage elsewhere.  Carriers carriers: Liquid Telecom largest carriers’ carriers. Only national companies elsewhere  Different Ways: Infrastructure sharing? Dark fibre (DFA)? Alternative fibre (FibreCo, Powerline fibre)?  Nov 2014 – 44% of population within reach of fibre  Local access: Largely gone mobile 3G but now increasingly 4G and WiFi hot spots… FTTH.  Quality and reliability issues on worst routes
  • 7.
    Supply – Connectingthe uncovered: A schematic view Online Coverage, but not Online Internet Access in Africa (approximation by population group) No Coverage Affordability (supply side) Digital Literacy (demand side) Locally relevant content/services (demand side) Improved quality Capex Subsidy New Tech ~20% ~60% ~20% Legend: • Challenges: Price/income, literacy/education, gender gap, power, etc • New Business Models: Vanu, Argon Telecom, Mawingu, Virural, And Inveneo • Options: Mobile operators; mobile franchisees, new independents
  • 8.
    Supply – ValueChain Pressures International National Metronet Local Access Prices at commodity level – Sub $100 at volume Prices will move to commodity level in medium-term Sub US$00s at volume Prices will move to commodity level in medium-term Sub US$00s at volume Prices lower to create greater volumes • Still big issues for landlocked countries with transit prices • Big split between liberalised countries and the unliberalised (like Ethiopia, Djibouti, Angola, Cameroon)
  • 9.
    Demand - SteadyGrowth of Internet Penetration Country 2006 or 2007 2009 or 2011 2013 Projected 2016 Ghana 1% 4% 21% 25% Kenya 1% 11% e17% 20% Nigeria 1% 5% 20% 25% Senegal 2% n/a 17% 25% Tanzania n/a 4% 17% 25% Source: Balancing Act Market research, 2014 Below 5%: DRC, Sierra Leone, Somalia, South Sudan Example: Liberia – Internet (2.1%) and smartphones (2.6%) 3G + Cheap Smartphones + Social Media = Internet Growth
  • 10.
    Mobile and FixedInternet Country Mobile Fixed & Wireless Ghana 14,254,407 Est 120,000 Kenya 23,794,550 135,107 Nigeria 92,285,052 Est 200-300,000 Uganda 6,057,148 122,550 Sources: National regulators, all 2015 except Ghana 2015 Ghana and Nigeria Fixed and Wireless, Balancing Act estimates
  • 11.
    Africa’s Internet EffectTouches Everything  Film and TV : Over 100 platforms. Eg iROKo TV, Juliet Asante, Mobilefliks, MTN’s Showmax  Music: Over 100 platforms. 10 m users. Set to grow 10X in next 5 years  e-Commerce: Nigeria – Jumia and Konga 1 m customers each. Hybrid  Publishing: Worldreader. 125, 000 active mobile readers. Deal with Opera  Art: Guns and Rain, Pavilion 33 = online galleries  Radio: Iono.fm – Prog downloads = 1 m per month  Media: Pulse: 3 million uniques; Top show: 175,000 views. Daily shows 10-12,000 views. Launch of Guardian TV  Games: GamersNights multiplayer cty in Kampala  Streaming: SkyroomLive, Wild Earth  B2B Processes – Paga – 75% of agents nationally now online
  • 12.
    Emerging Data Centreand Meet Point Ecosystem  Three key countries with independent DCs: South Africa (Teraco – Joburg, Cape Town and Durban); Kenya (Iolo, Liquid Telecom) and Nigeria (Main One’s MDX and Rack Centre)  First wave driven by regulation. Central Bank of Nigeria – Banks must have primary and secondary DCs at certain distance. Aim to cost save by sharing. CBN’s own mechanism to achieve.  Meet points – Example of Nigeria: IXPs (IXPN) and commercial meet points (Medallion and DCs shown above).  The furthest frontier: Content delivery all hosted outside country - Reasons
  • 13.
    The Next BigStep Up – 4G  The Price Glide with 3G – Accelerating high volume use earlier?  10-20-fold inc in 1st wave, more to come. 100-200% with 4G. Example of Nigeria: Somewhere just north of 500 mbps use..  4G launched in 45 countries with 63 operator launches. 154 projects in pipeline  High end users on Smile in 2015 in Uganda: 8-12 GBs per month.  With right pricing, data use and data volumes will increase
  • 14.
    Can we meetthe challenges?  4 key questions for the session:  How can the retail price of Internet come down as fast as possible to increase volumes?  How can operators help deliver “low-cost, high-volume” wholesale and retail bandwidth to less liberalised countries?  How can operators work with others to improve both uptime and reliability?  How can mobile operators deal with market blockages at content and services level (revenue share, payment methods)?