Download to read offline


![149Appendix
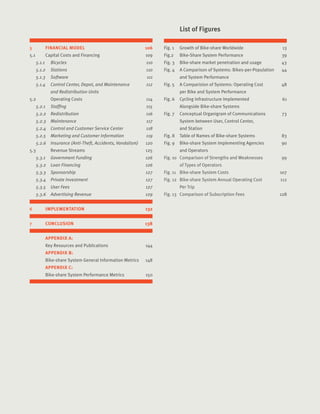
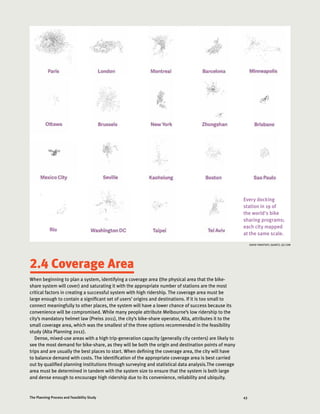
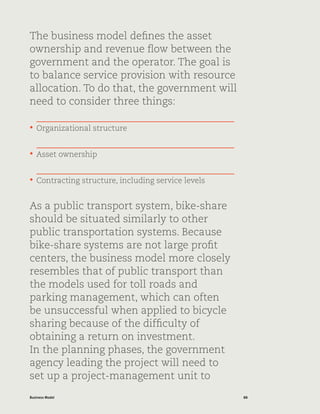
Coverage Area
(km2
) [May 2013]
Overall City
Population Density
(People/km2
)
Population in
Coverage Area
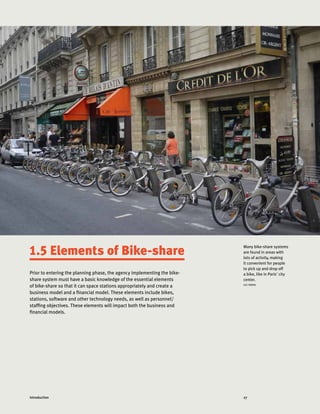
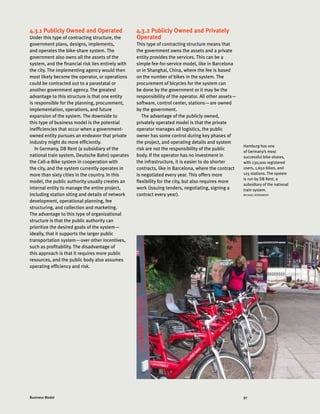
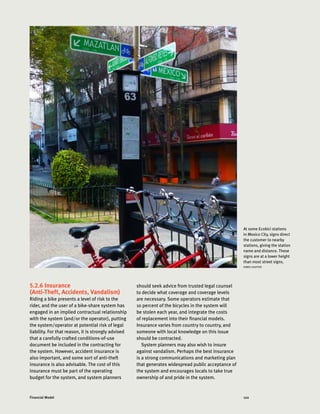
Who is operator? Operator, private,
public, non-profit?
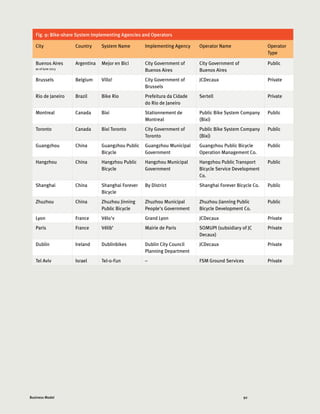
66 5,206 343,596 Serco Group Private
135 21,196 2,861,460 SOMUPI (subsidiary of JC Decaux) Private
41 15,991 652,433 Clear Channel (sub-contracted to Delfin
Group) City of Barcelona
Private
45 10,101 453,535 JCDecaux Private
50 4,518 225,448 Public Bike System Company (Bixi) Public
57 3,977 225,894 Alta Bicycle Share Private
263 1,708 449,204 Guangzhou Public Bicycle Operation
Management Co.
Public
125 4,889 611,125 Hangzhou Public Transport Bicycle
Service Development Co.
Public
256 3,600 921,600 Shanghai Forever Bicycle Co. Public
n/a n/a n/a Zhuzhou Jianning Public Bicycle
Development Co.
Public
n/a n/a n/a n/a n/a
19 6,000 112,200 Clear Channel Private
20 4,781 94,186 Sertell Private
28 14,000 385,000 City Government of Buenos Aires Public
5 4,588 22,940 JCDecaux Private
30 26,939 813,558 Alta Bicycle Share Private
21 1,561 32,157 Denver Bike Sharing Non-profit
70 2,710 190,242 City of Minneapolis Non-profit
2 473 945 Alta Bicycle Share Private
9 1,173 10,553 Trek Bicycle Corporation Private
24 9,600 226,560 Giant Bicycles Public
73 7,025 509,313 JCDecaux Private
36 7,956 289,580 FSM Ground Services Private
2 3,006 7,215 Boulder Bike Share dba Boulder
B-cycle
Non-profit
36 4,984 179,904 Alta Bicycle Share Private
11 2,972 33,281 San Antonio Bike Share Non-profit
11 4,149 46,054 Public Bike System Company (Bixi) Public](https://image.slidesharecdn.com/itdpbikeshareplanningguide-180708082138/85/Itdp-bike-share_planning_guide-149-320.jpg)


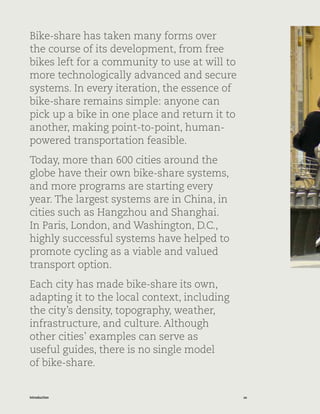
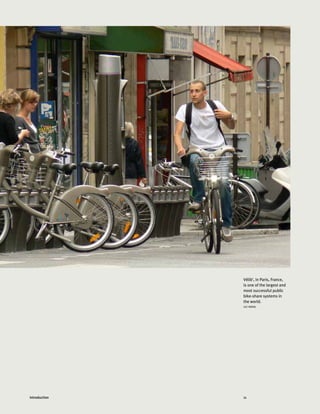
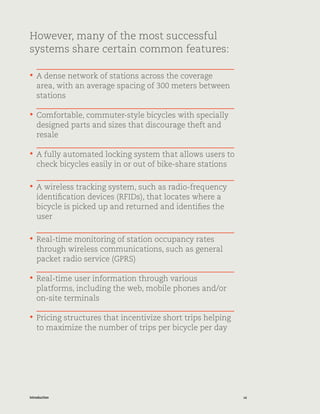
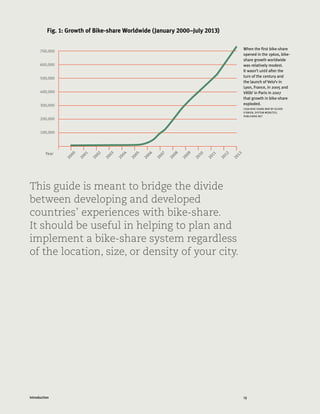
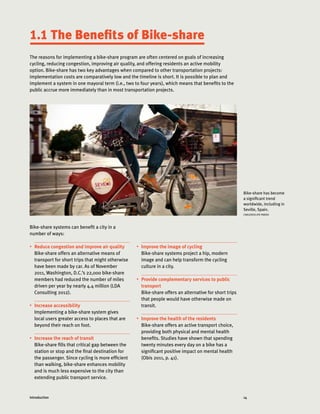
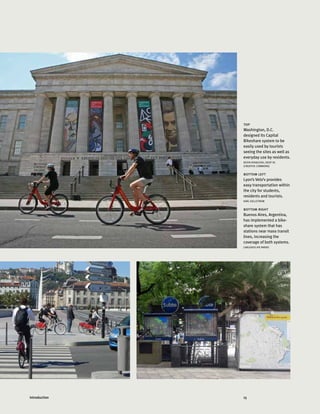
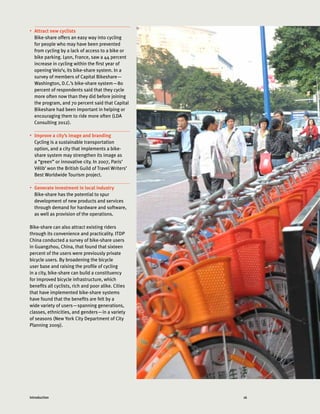
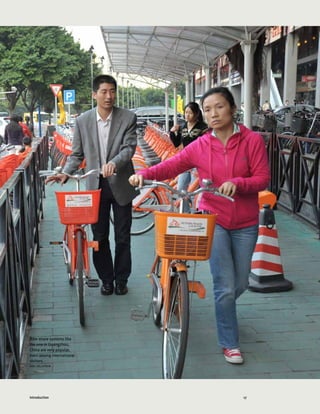
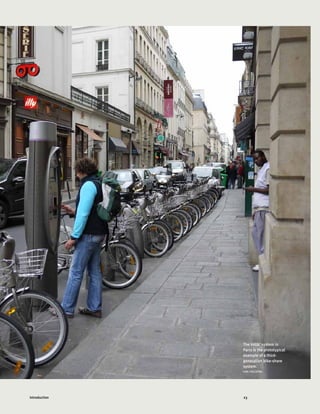
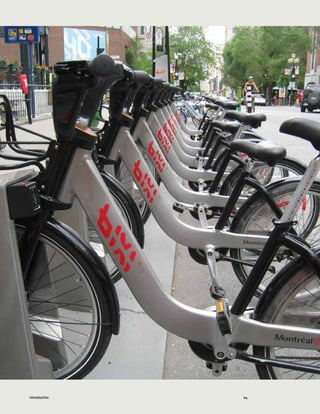
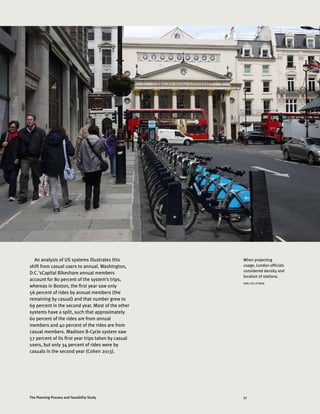
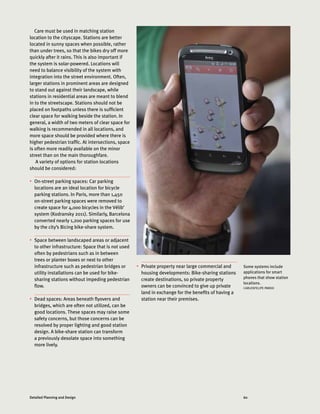
This document provides an introduction and overview of bike-share systems. It discusses the history and evolution of bike-share, from the first proposed free system in Amsterdam in 1965 to modern automated systems. The key benefits of bike-share systems are outlined, such as reducing congestion, improving accessibility and public health, and increasing cycling. Successful systems typically have dense station networks, automated docking, wireless tracking, and pricing that incentivizes short trips. The introduction explains that the guide aims to help cities around the world in planning and implementing bike-share.


