Download as PDF, PPTX


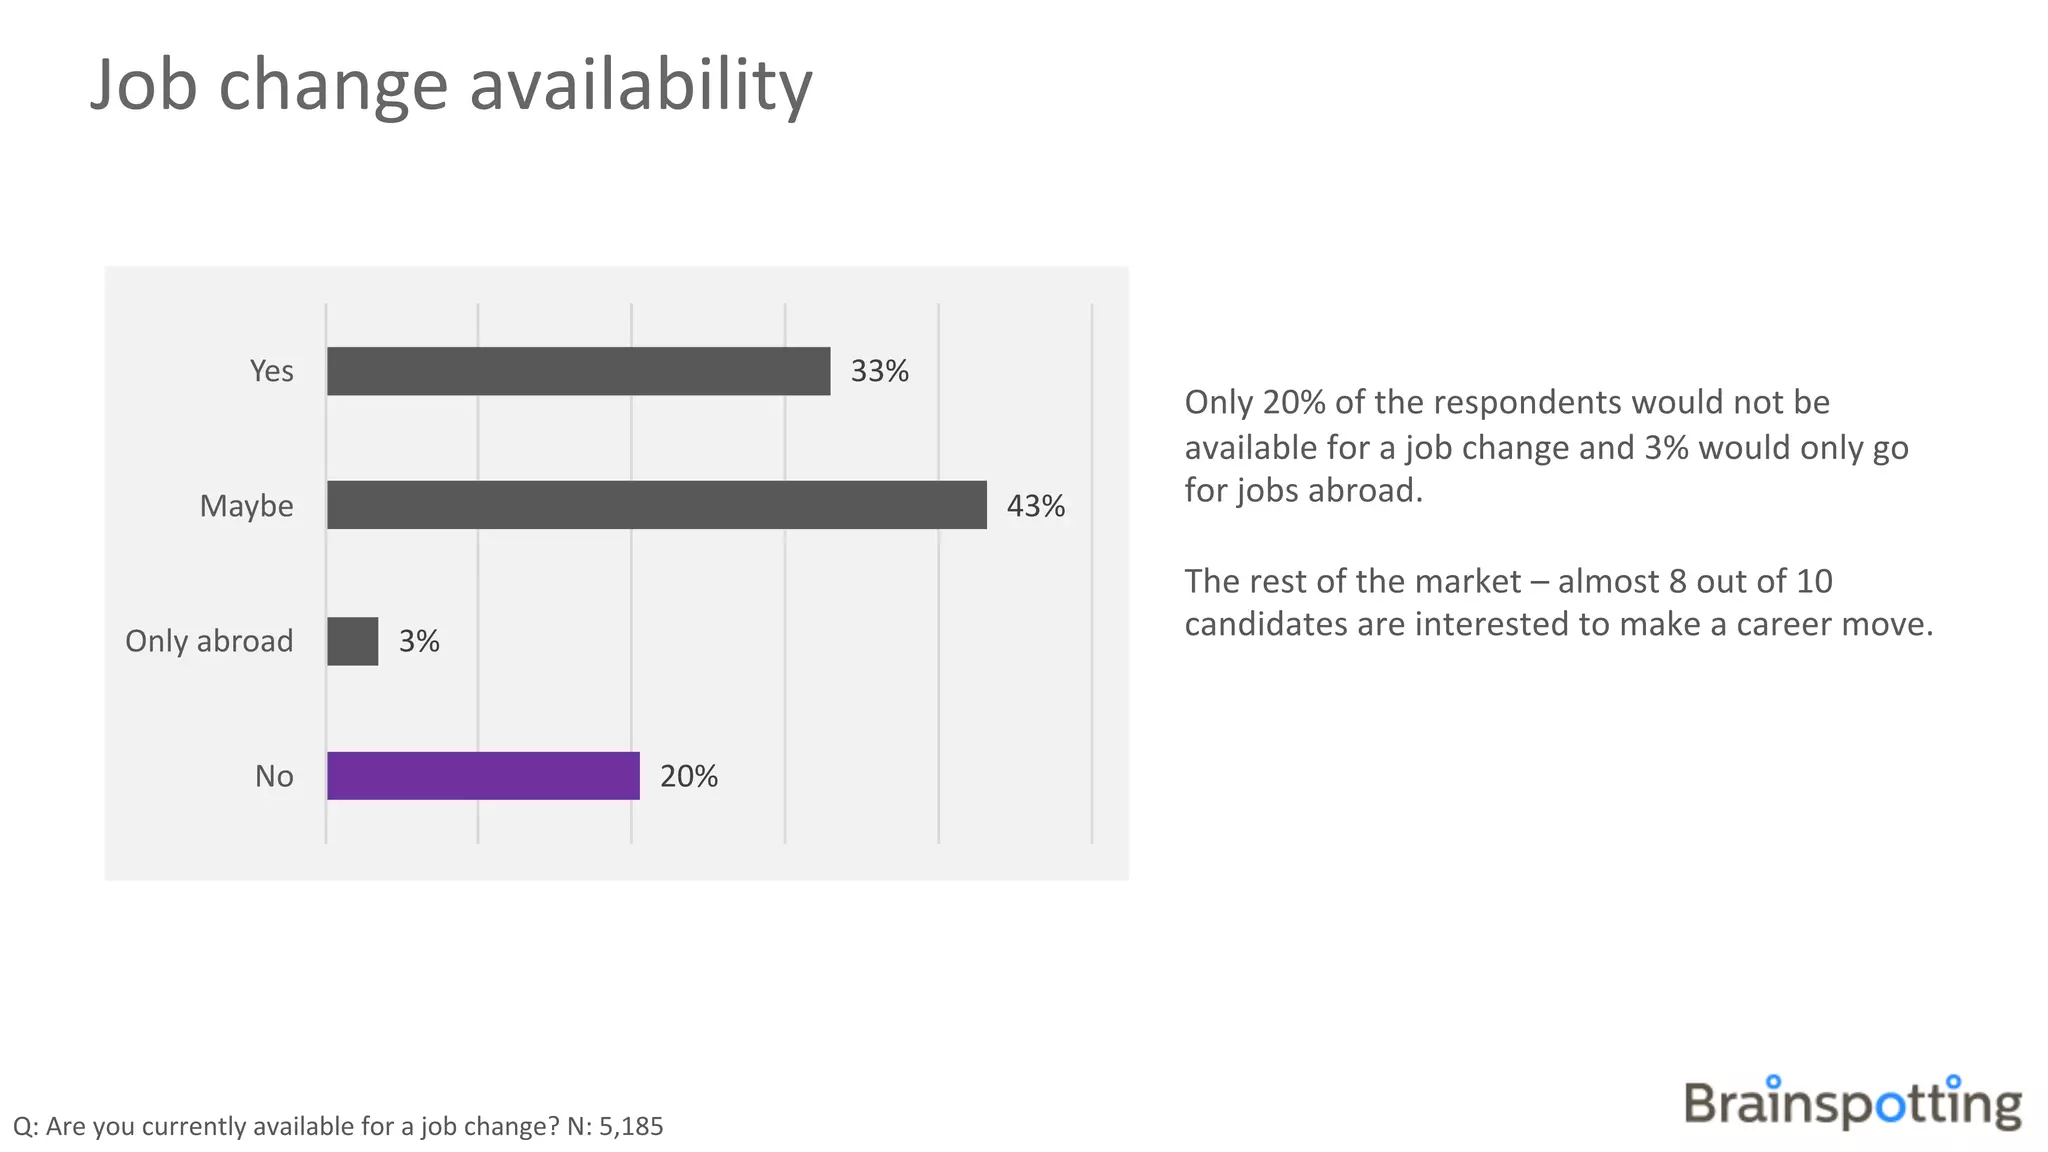


IT salaries in Romania have increased at a compound annual growth rate of 11.53% since 2013. The most highly paid technologies are Ruby on Rails and newer technologies like Python, Node.js, and AWS/Azure. For senior roles with over 4 years of experience, salary differences between technologies and cities tend to be narrow. While financial benefits like 13th month salaries and bonuses are still valued most, companies have started offering more flexible benefits like remote work and flex-time. Overall, IT professionals in Romania are satisfied with their salary packages, though many remain open to new job opportunities.


![Enterpreneurship opportunity in it[Nigeria]](https://cdn.slidesharecdn.com/ss_thumbnails/enterpreneurshipopportunityinit-150711231607-lva1-app6891-thumbnail.jpg?width=640&height=640&fit=bounds)


