SlideShare a Scribd company logo
Is your business IPO ready ? Start here!
1. Make sure you have the right people on the bus in the right seats before you start…how do you know ? Read Jim Collins “Good to
Great” Level 5 leaders
2. Engage ALL the stakeholders, ask questions and listen…
3. Understand your numbers in detail (Use a Value Driver Model to help with this), benchmark your performance & measure the
theoretical gap. Then get the businesses to take ownership by doing “deep dives” into material gaps, understanding & verifying them,
then develop plan to close gap.
4. Set the bar high…make sure your staff are not afraid to fail… your leadership style is critical for this.
5. Understand the risks and develop mitigation strategies
6. Synthesize your story/Strategy and communicate it to ALL. Make sure ALL the stakeholders understand the “size of the prize” or
“how close the precipice is”…ensure they all share in the success
7. Instill Key Traits in your team for implementation;
1. Focus on what’s important – KPIs
2. Ensure there is Clear Accountability – Performance linked to incentive schemes and regular performance review
3. Discipline – You must have a Project Management Office (PMO) with leader with access to your ELT
4. Sense of Urgency (not impatience) – Daily, Weekly, Month Reporting
5. Persistence - never loose faith that you will prevail
8. You must have a closed loop “Planning & Performance” management process. This will help systematize the above traits.
9. Use the Pareto 80 / 20 approach to get low hanging fruit first
10. Use “Gilberts 6 windows on Human Performance” as a list of things you need to do to get your people performing
Stage 1
Listen &
ask questions
Identify potential
improvement
Sell Need for change
Stage 2
Deep Dive Reviews
Benchmark &
Re-engineer
Processes
Develop
Actions
Stage 3
Synthesize
& Implement
It starts and ends with having a credible story that hangs together?
Forget the final presentations which are easy, get these “Building Blocks”
right which will give your story credibility.
2
Business
Performance
Review
SYNTHESIZE, SIGN OFF. SYNDICATE, IMPLEMENT & MONITOR ACHIEVEMENT OF PLAN
Stewardship Review &
Control Processes
Employee
Survey
Top 20 Leadership
Interviews & Capability
Review
Behavioral
change plan
developed
External
Customer
Survey
KEY GAP “Deep Dives” TO SUPPORT TARGETS WITH ACTIONS
OHS & E Process
Manufacturing
Excellence
Capability
Work
Cap.
Mgt
Spend
Control
S&OP Management
IT Systems
Capability
Internal. Customer
Surveys by Dept
Governance
Framework, Policy
& Process
Standards
Risk
Review
Recruitment,
Training,
Development &
Retention
effectiveness
Customer Service
Excellence
Understand Strategy & Review Structure Alignment
Cash &
Debt
Mgt
Synthesize the critical reasons for change into a Story & Syndicate across/down the organisation to all stakeholders
Product &
Market
Development
Process
Sales
Capability
Supplier Transactional
Process Efficiency
Procure to Pay
Customer Transactional
Process Efficiency
Order to Fulfillment
Employee Transactional
Process Efficiency
Payroll & Expense
Reimbursement
Planning & Performance
Management Process
Margin / Pricing
Management Process
Develop Value Driver Model & Theoretical Improvement Potential
3
Stage 1 – Building Blocks & Objectives
 Understand Strategy & Review Structure Alignment - Understand existing strategy (Shareholder
perceptions / expectations) & review alignment of organisation structure
 Top Leadership Review - Understand ideas (SWOT) & leadership capability for each of the senior
managers and high potential employee’s – “Are the right people on the bus in the right seats”
 Internal Customer Surveys - Understand how each department is perceived by its internal
customers for both KRAs and Key Behaviors
 Business Performance Review - Understand current & forecast business performance. Develop
80/20 broad range of critical KPIs to quickly instill focus, accountability & sense of urgency
 Risk Review - Understand the key business risks, their potential impact, the mitigation strategies
& probability before & after mitigation
 External Customer Survey - Understand the customer perceptions of our value proposition &
business performance (& our SWOT)
 Employee Survey - Understand the Employee perceptions of the business performance (& SWOT)
& their own performance
 Value driver model - Develop a “Theoretical Potential Improvement “ in the business by Developing
a Value Driver model and benchmark all its components against best practice and measure gap,
 Synthesize Story & Syndicate - Ensure everyone in the business can see the prize or precipice so
they understand why we have to change
4
Stage 2 – Building Blocks & Objectives
 Governance Framework, Policy & Process Standards - Ensure a governance framework is in place that
meets best practice & exceeds all listing requirements
 Behavioral Change Plan - From feedback, develop detailed behavioral change plan needed to meet all
stakeholder objectives (mission, values, targets, etc)
 Customer Service – Develop detailed plan to ensure the customer service is consistently competitive,
value enhancing & meeting our promise to the customer ?
 Stewardship Review & Control Processes - Verify Balance sheet values , identify any major write-
offs and/or control weakness with actionable plan
 Cash Management & Funding Process – Review adequacy of capital structure & funding facilities.
Implement a process ensuring CFO has day to day control of funding and all material cash outflows
 CAPEX & Discretionary Spend Process – Put process in place to ensure all CAPEX & Discretionary
Spend (Marcom, R&M, etc) is properly justified, approved, prioritised, controlled in timely manner
with post implementation review.
 Working Capital Management – Put process in place to control & optimize WC % to “Best Practise”
 Margin Management Review – Ensure Margin Management Performance & Processes are “Best
Practise”. Identify margin improvement potential & process changes.
 Planning & Performance Management System - Ensure there is a process in place that drives ongoing
systematic improvement, provides clear accountability, focuses the business on things that are
important and creates a sense of urgency
5
Stage 2 – Building Blocks & Objectives
 Supplier – Procure to Pay – Reengineer Process to be “Best Practice”
 Customer – Order to Fulfillment - Reengineer Process to be “Best Practice”
 Employee – Payroll & Exp Reimbursement - Reengineer Process to be “Best Practice”
 Sales Capability - Review Capability, Performance & Processes. Identify improvement opportunities
 Product & Market Development Process - Do we have an effective process & have we identified &
invested in a sufficient pipeline of growth opportunities to meet our growth targets ?
 IT / IS Systems Capability - Are these systems appropriate for our strategic & operational needs
and are they efficient and cost effective ?
 OHS&E - Reengineer Process to be “Best Practice”
 Manufacturing Capability - Reengineer Process to be “Best Practice”
 Supply Chain Management - Reengineer Process to be “Best Practice”
 People - Recruitment, Training, Development & Retention - Understand if performance shortfalls are
due to any systemic factor that can be corrected. Reengineer Process to be “Best Practice”
 Deep Dives - Turn “Theoretical Gap” into confirmed opportunities with management commitment and
detailed hard action plans
Strategy & Structure
5 Forces Review including
trends and scenario’s
SWOT Review
Competitor Review
Vision, Targets
Options & Rational
Key Actions
Key Enablers, Resources &
Risks
 Sponsor: CEO
 1 week timeframe
 Facilitated by CEO
 2 day workshop with Board & Leadership Team
Objective:
Understand existing strategy (and shareholder perceptions,
expectations) and alignment of structure
6
Top 20 Leadership
Review
Get all to read “Good to Great”
& prepare comments
Do 360 degree
Performance Reviews
List track record and key
achievements in last 10 years
One on One
Interview with CEO
Competency Gaps &
progression potential Finalised
Development Plans completed
and implemented started
 Sponsor: CEO
 6 week timeframe
 Facilitated by External HR Consultant
 CEO to identify review participants
 CEO to prepare plan on what changes will be made
Objective:
Understand ideas (SWOT) & leadership capability for each of
the senior managers and high potential employee’s – “Are the
right people on the bus in the right seats”
7
Level 5 Related Skills and Attributes
•Self Management
•Goal Achievement
•Results Orientation
•Interpersonal Skills
•Diplomacy and Tact
•Personal Accountability
•Influencing Others
•Developing Others
•Flexibility
•Versatility
•Teamwork
•Decision Making
•Resiliency
•Self Starting
•Accountability for Others
•Continuous Learning
•Conceptual Thinking
•Empathetic Outlook
•Leading Others
•Customer Focus
•Objective Listening
Level 5 Related Values and Motivators
Learning Leading Results
The value of pursuit of
knowledge, continuous
improvement of self and
the organization.
The value of personal
recognition and control
over their own destiny and
others.
The value of practical
achievements, ROI, on time
achievement, energy and
resources.
Level 5 Related Behavioral Styles
Consistency Influence Controlling
Predictable, steady,
composed. Steadiness
supports the hedgehog
concept.
Level 5s are not inherently
charismatic. They tend to
be compassionate, amiable,
objective and logical.
Levels 5s are not
domineering or highly
driven. They are inclined to
be purposeful, moderate
and conservative.
Employee Survey
20% of employees interviewed
by external facilitator
All employees do
questionnaire compiled by
external consultant
Present findings
Redo every year to measure
trend
 Sponsor: CEO
 4 week timeframe
 Facilitated by External HR Consultant
 Employee questionnaires… example questions;
 Summarise your CV
 What are your Goals
 Rate your Job Satisfaction
 KRAs – describe your performance
 What are your strengths
 What do you need from company to perform better
 What do you like about culture that must be retained
 What do we need to improve about the culture
 How can we improve the performance of the
department
 How can we improve the business performance
 Redo in 12 months times to measure change
Objective:
Understand the Employee perceptions of the business performance
(& SWOT) & their own performance
8
13
Behaviours & Soft Skills - Our Customers (Presidents) Perceptions – Big Improvement
Internal Customer
Surveys
KRA’s
Behavior / Soft Skills
 Sponsor: CEO
 4 week timeframe
 Facilitated by VP HR
 For all Functional areas; Finance, IT, HR, Procurement, CS,
Logistics, SCM, Manufacturing, OHS & E, S& M
 Redo in 12 months to measure change
Objective:
Understand how each department is perceived by its internal customers
for both KRAs and Key Behaviors
14
KRA’s - Our Customers Perceptions - Still some upside, but improving
9
EXAMPLEEXAMPLE
EXAMPLEEXAMPLE
Business Performance
Review
OHS&E
Financials
Market
Operations
 Sponsor: CFO
 2 week timeframe
 Facilitated by CFO
 One week preparation inputting 5 year history and
forecasts
 1 day workshop presenting to Management Team to
review performance. Agree on initial 80/20 KPIs
 Design & implement daily, weekly reporting
(see example in Appendix 1)
Objective:
Understand current & forecast business performance. Develop
initial 80/20 broad range of critical KPIs to quickly instill focus,
accountability & sense of urgency
10
Risk Review
Brainstorm Key Risks
Select Top 10 Risks
Agree on Potential impact
(develop models)
Potential Mitigation Strategies
Probability before & after
If risk & impact still too high
develop more mitigation
11
 Sponsor: CFO
 1 week timeframe
 Facilitated by External
consultant
 2 day workshop with Board
& Leadership Team
 Ensure they are
incorporated into ongoing
monthly reporting so that
mitigation efforts are
progressed
Objective:
Understand the key business risks, their potential impact, the
mitigation strategies & probability before & after mitigation
 Sponsor: VP S&M
 8 week timeframe
 Facilitated by Market Research Consultant
 Customer questionnaires. … example questions;
 Rate our performance levels relative to competitors
 Rate our behaviors relative to competitors
 What are our biggest threats
 What are our biggest opportunities
 How can we help your business
 Redo in 12 months times to measure change
Objective:
Understand the customer perceptions of our value proposition &
business performance (& our SWOT)
12
External Customer
Survey
20% of customers interviewed
by external facilitator
All customers asked do
questionnaire compiled by
external consultant
Present findings
Redo every year to measure
trend
Value Driver Model
Develop Draft Conceptual
Models
Populate models with data
Benchmark model components
to best practice
Identify High Level gaps with
targeted performance
 Sponsor: CFO
 8 week timeframe
 Facilitated by Consultant
 Prepare draft conceptual model
(see example in Appendix 2)
 1 day initial workshop with commercial team &
management reviewing/ explaining model concept and
data requirements
 Four week preparation inputting & verifying 5 year
history and forecasts
 Three weeks for benchmarking components
 1 day workshop presenting to Management Team to
review performance and see major targeted performance
gaps (see example in Appendix 3)
Objective:
Develop a “Theoretical Potential Improvement “ in the business by
Developing a Value Driver model and benchmark all its components
against best practice and measure gap,
13
Objective:
Ensure a governance framework is in place that meets best
practice & exceeds all listing requirements
 Sponsor: Chairman
 One week timeframe
 Facilitated by CFO & Auditor
 Listing & Regulatory governance requirements
 Examples of “Best Practice” governance
policies at other companies
 CFO to provide example of DOA for review
 CFO to provide example of Planning & Control
Framework (See Appendix 4)
 Two Day workshop attended by
 ALL Board members
 All ELT members
 Facilitator
 Conduct workshops to communicate all policies
across all employees run by VP HR
14
Governance Framework
Mission & Values
Delegation of Authorities
Compliance & Audit
Code of Conduct
Planning & Control
Syndicate
Behavioral
Change Plan
Review Stage 1 feedback from
stakeholders
Identify behavioral barriers to
achieve objectives
Identify solutions to remove
barriers
Develop action plan to
implement
Communicate to stakeholders
 Sponsor: CEO
 8 week timeframe
 Appoint external Consultant to Facilitate
15
13
Behaviours & Soft Skills - Our Customers (Presidents) Perceptions – Big Improvement
EXAMPLEEXAMPLE
Objective:
From feedback, develop detailed behavioral change plan needed to
meet all stakeholder objectives (mission, values, targets, etc)
Recruitment, Training,
Develop. & Retention
Effectiveness
Is there clear Directional Info.
(PD,KRAs,Targets) ?
Does the person have
sufficient Resources or Tools
to do the job ?
Are rewards competitive,
performance reviews effective &
sufficient recognition given ?
Are there training and
development plans ?
Do the employees have the
capacity to do their role ?
Are they motivated… a good fit
or enjoyable workplace
environment ?
 Sponsor: VP HR
 8 week timeframe
 Appoint External HR Consultant to Facilitate
 Use Gilberts 6 window model to determine process issues
Objective:
Understand if performance shortfalls are due to any systemic
factor that can be corrected
16
Stewardship Review
& Control Processes
Prepare templates
Undertake
Stewardship Review
Management signoff of findings
& action plan
Management process in place
to ensure gaps are closed
Implement Actions
 Sponsor: CFO
 3 week timeframe
 Facilitated by CFO & Auditor – Template provided by
CFO & signed off by Auditor
 Three weeks to fill in template by accounting team
with all supporting schedules
 2 day review with finance team facilitated by CFO &
Auditor with output being actionable issue list
17
Objective:
Verify Balance sheet values , identify any major write-offs and/or
control weakness with actionable plan
Cash Management &
Funding Process
Appoint Regional Cash
Management Bank
Design & Implement online
payment process
Review Capital structure,
facilities
Develop & implement
centralized funding
arrangements, align DOA
 Sponsor: CFO
 8 week timeframe including implementation
 Facilitated by Treasurer
 2 day workshop designing online payment process led
by Treasurer & Bank
 Review Capital structure, facilities and WAC
 Gain approval for changes from CEO & Board
Objective:
Review adequacy of capital structure & funding facilities.
Implement a process ensuring CFO has day to day control of
funding and all material cash outflows
18
CAPEX & Discretionary
Spend Control Process
Justification Templates &
Models
Approval Review
Ranking Process
Implementation Control
Post Implementation
Review
Communicate across
organisation
Review DOA
spend limits
 Sponsor: CFO
 8 Week Timeframe
 Appoint facilitator
 2 day workshop to review and test process
 Process signed off by ELT
 Communication Workshops across all relevant people
run by CFO
Objective:
Put process in place to ensure all CAPEX & Discretionary Spend
(Marcom, R&M, etc) is properly justified, approved, prioritised,
controlled in timely manner with post implementation review.
19
Working Capital
Management
Set targets after understanding Value
Proposition WC terms & benchmark its
competitiveness
Minimize payment runs
to one per month
Make Sales Dept responsible for
collection & set weekly collection
targets
Clear Credit Limit, stop credit and legal
proceeding rules enforced by Finance
Implement Weekly Cash & WC
Forecast / Control process
Cost VP WC Terms into CPP margin
numbers
Monthly Sales & Operation Planning
meeting to optimize DOI
Objective:
Put process in place to control & optimize WC % to “Best Practise”
 Sponsor: CFO
 8 week timeframe
 Appoint facilitator
20
Margin Management
Review
Margin Calculation Definition
& Costing Methodology
Pricing Process
& DOA Compliance
Cost Plus v Market Based
Discount & Rebate Structure
CPP Matrix Analysis
(Variation)
Reporting
 Sponsor: CFO
 8 week timeframe
 Appoint Consultant to Facilitate (PCM ?)
 Understand margins
 Pricing policies and processes
 Costing policies and processes
 Explain variations
 Identify total improvement potential for margins
 Identify gaps to “Best Practice” & agree on process changes
Objective:
Ensure Margin Management Performance & Processes are “Best
Practise”. Identify margin improvement potential & process changes.
21
Supplier
Procure to Pay
Identify Best Practice
Map “AS IS” process
Document Gaps to “Best Practice”
Understand Risk/cost/resources
to close gap
Develop longer term plan for
delivering last 20%
Develop 80 / 20 strategy for quick
implementation
Objective:
Reengineer Process to be “Best Practice”
 Sponsor: CFO
 8 week timeframe
 Facilitated by Consultant, FC & VP IS/IT
22
Customer
Order to Fullfillment
Identify Best Practice
Map “AS IS” process
Document Gaps to “Best Practice”
Understand Risk/cost/resources
to close gap
Develop longer term plan for
delivering last 20%
Develop 80 / 20 strategy for quick
implementation
Objective:
Reengineer Process to be “Best Practice”
 Sponsor: CFO
 8 week timeframe
 Facilitated by Consultant, FC & VP S&M
23
Employee Payroll &
Exp. Reimbursement
Identify Best Practice
Map “AS IS” process
Document Gaps to “Best Practice”
Understand Risk/cost/resources
to close gap
Develop longer term plan for
delivering last 20%
Develop 80 / 20 strategy for quick
implementation
Objective:
Reengineer Process to be “Best Practice”
 Sponsor: CFO
 8 week timeframe
 Facilitated by Consultant, FC & VP IS/IT
24
Sales Capability
Value Proposition
Competitiveness
Project Pipeline & Market
Intelligence Data Systems
4P Effectiveness (Marcom) &
Sales Incentives
Customer & Channel
Relationship & Selling Skills
CPP Matrix Analysis
(Variation) & Reporting
Bid Quality
& Turnaround Times
 Sponsor: VP Sales & Marketing
 8 week Timeframe
 Appoint Consultant to Facilitate
 KPIs compared;
 Segment analysis – Quantity. margin p/t, MS%
 Value Proposition – lead time, quality, Terms
 Spend on Marcom, # of people, people cost
Objective:
Review Capability, Performance & Processes. Identify
improvement opportunities
25
Product & Market
Development Process
New
Channels
New
Products / Services
Expand Up / Down
Value Chain
New
Segments
M & A opportunities
Geographic Footprint
Expansion / Coverage
 Sponsor: VP Sales & Marketing
 8 week Timeframe
 Facilitated by External Consultant
 With conservative development success, is there sufficient
projects in the long term pipeline to meet growth targets ?
 KPIs compared;
 Time to Market
 New Channel
 New Segment
 New Product
 New Geographic Location
 % Projects on / ahead of target
 3,5 Year Forecast Gap to Target
Objective: Do we have an effective process & Have we
identified & invested in a sufficient pipeline of growth opportunities
to meet our growth targets ?
26
IS / IT Systems
Capability
Measurement KPIs
Competitiveness
of IS system
Age of Infrastructure
Outsourcing Options
Skills & Experience
Technology as enabler of
growth
 Sponsor: CFO
 8 week timeframe
 Appoint external IS/IT Consultant to Facilitate
 Do we have sufficient measurement systems ie KPIs =
downtime, Support costs, Development Costs, Coms Costs ,
manual and legacy systems
 Along with pareto analysis , reason codes for all problems
 Do we know “Best Practice” performance and process ?
Objective:
Are these systems appropriate for our needs and are they
efficient and cost effective ?
27
Customer Service
Excellence
Measurement of KPIs
(Lead Time, Stock Outs, $DOI,
DIFOT%, distribution costs)
Benchmark & Pareto
Performance Gap
Competitiveness of Value
Proposition
Quality Process
On Time Process
 Sponsor: VP Operations
 8 week timeframe
 Appoint external Consultant to Facilitate
 Do we have sufficient measurement systems ie KPIs =
Customer complaints & Returns, DIFOT%, Customer
Loyalty - % of their spend, premium over Next Best
Alternative
 Along with pareto analysis , reason codes for all problems
 Do we know “Best Practice” performance and process ?
28
Objective:
Develop detailed plan to ensure the customer service is consistently
competitive, value enhancing & meeting our promise to the customer ?
OHS & E
Process
Does the leadership put
OHS & E as #1 priority ?
Have we implemented
mitigating strategies for all High
Impact risks / activities ?
Do we measure incident
pyramid ?
Do 100% of employees conduct
and questioned in regular audits
?
Are all issues raised in Audits
closed out in a timely matter
Is there regular and sufficient
training given ?
 Sponsor: VP Operations
 8 week timeframe
 Appoint External OHS & E Consultant to Facilitate
 If we don’t know what is “Best Practice” then we need to
find out… eg BHPSTEEL in 1995 sort advice from leader
DUPONT
Objective:
Are the OHS & E processes and performance at “Best Practice”
levels
29
X
Manufacturing
Excellence Capability
Measurement
Fit for purpose Raw Materials &
efficient utilization & batch size
Appropriate Equipment
(quality and efficiency)
Repairs & Maintenance
Skills & Experience
Production Planning Process &
Product Complexity
 Sponsor: VP Operations
 8 week timeframe
 Appoint external manufacturing Consultant to Facilitate
 Do we have sufficient measurement systems ie KPIs =
downtime, Yield Loss, Throughput, Material Usage
Variance, Variable costs, Fixed costs
 Along with pareto analysis , reason codes for all problems
 Do we know “Best Practice” performance and process ?
Objective:
Are the Manufacturing processes and performance at “Best
Practice” levels
30
Supply Chain
Management
Procurement
Warehousing & Stock
Management
Distribution
Forecast Accuracy
Outsourcing
Production Planning Process &
Product Complexity
 Sponsor: VP Operations
 8 week timeframe
 Appoint external manufacturing Consultant to Facilitate
 Do we have sufficient measurement systems ie KPIs =
Procurement cost, Stock Outs, $DOI, Distribution Costs
 Along with pareto analysis , reason codes for all problems
 Do we know “Best Practice” performance and process ?
 Monthly Sales and Operations Planning Meeting
Objective:
Are these processes and performance at “Best Practice” levels
31
Planning & Performance Process
Strategy,
Value Driver Model,
benchmark &
5Year targets
Actions to Close Gap
& 1 year budget
Integrate with
individual STI targetsKPI Reporting Daily,
Weekly, Monthly
Corrective Actions
One on One
Performance
Reviews
Objective:
Ensure there is a process in place that drives ongoing systematic
improvement, provides clear accountability, focuses the business on
things that are important and creates a sense of urgency
Planning & Performance
Management Process
Strategy , benchmark & 5 year plans
Action Plans
to close gap along with 1 year budget
Integrate with Individual STI targets
Monitor Performance
Daily, Weekly, Monthly
KPI Reporting
Take Corrective Actions
to close gaps
Undertake
Individual Performance
Reviews
 Sponsor: CFO
 8 week timeframe
 Facilitated by External Consultant
 See example in Appendix 5
32
Performance Gap
“Deep Dives”
Identify items that make up at
least 90% of Gap
Undertake “Deep Dives” for
these items with “Best”
Understand why, & develop
plan for closure of gap
Reviewed & Signed off by CFO
 Sponsor: CFO
 8 week timeframe
 Facilitated by
 See example “Deep Dive” in Appendix 6
Objective:
Turn “Theoretical Gap” into confirmed opportunities with management
commitment and detailed hard action plans
33
Synthesize Story &
Syndicate
Objective:
Ensure everyone in the business can see the prize or precipice so they
understand why we have to change
34
 Sponsor: CEO
 1 week timeframe
 Facilitated by CEO &
ELT
APPENDIX
35
7
Example – Stage B
Simple Value Driver
Model
Revenue p/t.
Raw Material costs per Input Tonne.
% Yield.
Raw Material costs p/t
Distribution Out costs p/t.
Material Spread p/t
Electricity cost per kwh.
# Kwh p/t.
Electricity cost p/t
Gas cost per MBTU.
MBTU p/t.
Gas cost p/t
Commissions/Royalties.
Packaging.
Consumables.
Environmental.
Other.
Other Variable Costs p/t
Variable Margin p/t
Line Speed - Lineal MPM.
Mix - M2 per tonne.
Scheduled & Unscheduled Maint..
Production Capacity
Forecast 5 year CAGR%.% Capacity Utilisation
Capacity Constrained
YOY % Growth.Market Size
% Marketshare .
Demand Constrained
Prime Tonnes Despatched
Variable Contribution
# Employees.
Payroll & Oncosts per employee.
Payroll & Oncosts
Motor Vehicles.
Coms & Computers.
Travel & Entertainment.
Marketing & Growth costs.
Repairs & Maint.
Premises cost.
Consultants.
Other.
Fixed Overhead
Life.Depreciation
Abnormals.
EBIT
* The value driver modeling was a technique I
learnt from Neil Sylvester (now Partner in PIP)
when he was engaged by Boral in the 1990s.
36
APPENDIX 1
EXA
M
PLE
EXA
M
PLE
DAILY (Email Template)
Good News - Wins
MTI, LTI, Enviro Incident, Fraud Incid
Resignations - Key Management
Bad News
Despatches
Unit Volume - Yesterday
Unit Volume - MTD % of Mth Fcst
Margin % - Act & Mth Fcst
Orders Received
Unit Volume - % of Mth Fcst
Margin % - Act & Mth Fcst
Cashflow - Act & Mth Fcst
Cash Position
WEEKLY KPIs. (Email Template)
Act Cashflow v 1 week Fcst
Fcst Cashflow Next Week
Act Sales Rev v 1 week Fcst
Fcst Sales Rev Next Week
Interco Payables Overdue
% Receivables Overdue
% Inventory Over 30 days
Inventory - % of Mth Fcst
DIFOT % - Act & Mth Fcst
MONTHLY ELT REVIEW AGENDA
Minutes of Last Meeting
Traffic Light Summary
OHS&E
C.S. - DIFOT % & Lead Time Days
PEOPLE - Behavioural Change Agenda
EBIT - Variance Analysis
Volume - Pipeline & Market
Margin Spread
Selling Price
Variable Costs
Costs & Efficiencies
Manufacturing
Logistics
S & M
Admin & Other
REVENUE - Variance Analysis
CASHFLOW - Variance Analysis
WC
Inventories
Receivables & Payables
Capex & Disposals
Project Progress Update
Risks & Opportunities
Agreed Actions & Checkout
ONE HOUR ALERT (Phone Call)
LTI
Environment Issue
Fraud
Reporting / KPI pipeline – Daily, Weekly, Monthly
37
APPENDIX 2
EXA
M
PLE
EXA
M
PLE
Value Driver Model
EXAMPLES OF EBIT IMPROVEMENT PROCESS
8
Example – Stage D - Benchmark Gap analysis
Column indented Item Names NZ & PI NSW QLD VIC & TAS BEST NZ & PI NSW QLD VIC & TAS NZ & PI NSW QLD VIC & TAS NZ & PI NSW QLD VIC & TAS
ROC% 4% -3% 7% 7% 17% 16% 14% 24%
Assets Employeed 195 125 123 152 4.0 150 101 101 100
Fixed Assets 150 100 100 100 150 100 100 100
Working Capital 38 20 19 47 0.0 (43) (23) (22) (51) (4) (3) (3) (4)
Working Capital Days 90 60 60 110 (10) (10) (10) (10) (10)
Inventory 25.6 9.9 12.8 25.6 0.0 13 0 3 13 12.8 10.7 9.6 12.8
Inventory Days 60 30 40 60 30 30 0 10 30 30 30 30 30
Receivables 21.4 16.4 12.8 29.9 0.0 13 10 6 21 8.5 7.1 6.4 8.5
Receivable Days 50 50 40 70 20 30 30 20 50 20 20 20 20
Payables 8.5 6.6 6.4 8.5 0.0 (17) (13) (13) (17) 25.6 21.4 19.2 25.6
Payable Days 20 20 20 20 60 (40) (40) (40) (40) 60 60 60 60
Other 7.0 5.0 4.0 5.0 4.0 (3) (1) 0 (1) 4 4 4 4
EBIT 8.3 (3.5) 9.0 10.9 (1.0) (17.5) (20.2) (6.5) (12.9) 25.4 16.2 14.6 23.8
Variable Contribution 33.9 22.6 29.6 39.9 0.0 43.4 36.2 32.6 43.4
Variable Margin p/t 282 226 328 333 362 (79.6) (136.0) (33.4) (29.1) (9.9) (14.1) (3.9) (3.5) 362 362 362 362
Material Spread p/t 340 292 375 382 395 (55.1) (103.7) (20.1) (13.8) (7.0) (10.9) (2.7) (1.7) 395 395 395 395
Revenue p/t 1,300 1,200 1,300 1,300 1,300 0.0 (100.0) 0.0 0.0 0.0 (10.0) 0.0 0.0 1,300 1,300 1,300 1,300
Raw Material costs p/t 960 908 925 918 905 55.1 3.7 20.1 13.8 6.6 0.4 1.8 1.7 905 905 905 905
Raw Material costs per Input Tonne 950 900 920 900 900 50 0 20 0 6.0 0.0 1.8 0.0 900 900 900 900
% Yield 99.0% 99.1% 99.5% 98.0% 99.5% -0.5% -0.4% 0.0% -1.5% 0.6 0.4 0.0 1.7 99.5% 99.5% 99.5% 99.5%
Distribution Out costs p/t 18.0 20.0 25.0 15.0 15.0 3 5 10 0 0.4 0.5 0.9 0.0 15.0 15.0 15.0 15.0
Other Variable Costs p/t 58.3 66.0 47.0 49.0 33.7 24.6 32.3 13.3 15.3 2.9 3.2 1.2 1.8 33.7 33.7 33.7 33.7
Electricity cost p/t 8.3 4.0 4.0 4.5 3.2 5.1 0.8 0.8 1.3 0.6 0.1 0.1 0.2 3.2 3.2 3.2 3.2
Electricity cost per kwh 0.15 0.10 0.08 0.10 0.08 0.07 0.02 0.00 0.02 0.08 0.08 0.08 0.08
# Kwh p/t 55.0 40.0 50.0 45.0 40.0 15 0 10 5 40.0 40.0 40.0 40.0
Gas cost p/t 20.0 21.0 9.0 12.5 7.5 12.5 13.5 1.5 5.0 1.5 1.4 0.1 0.6 7.5 7.5 7.5 7.5
Gas cost per MBTU 4.0 3.0 3.0 2.5 2.5 1.5 0.5 0.5 0.0 2.5 2.5 2.5 2.5
MBTU p/t 5.0 7.0 3.0 5.0 3.0 2.0 4.0 0.0 2.0 3.0 3.0 3.0 3.0
Commissions/Royalties 4.0 6.0 7.0 5.0 4.0 0.0 2.0 3.0 1.0 0.0 0.2 0.3 0.1 4.0 4.0 4.0 4.0
Packaging 8.0 15.0 12.0 10.0 8.0 0.0 7.0 4.0 2.0 0.0 0.7 0.4 0.2 8.0 8.0 8.0 8.0
Consumables 12.0 10.0 5.0 7.0 5.0 7.0 5.0 0.0 2.0 0.8 0.5 0.0 0.2 5.0 5.0 5.0 5.0
Environmental 3.0 5.0 5.0 5.0 3.0 0.0 2.0 2.0 2.0 0.0 0.2 0.2 0.2 3.0 3.0 3.0 3.0
Other 3.0 5.0 5.0 5.0 3.0 0.0 2.0 2.0 2.0 0.0 0.2 0.2 0.2 3.0 3.0 3.0 3.0
Prime Tonnes Despatched 120,000 100,000 90,000 120,000 120,000 100,000 90,000 120,000
Production Capacity 200,000 125,000 125,000 125,000 230,000 145,833 152,778 138,889
Line Speed - Lineal MPM 100 90 90 90 100 0 (10) (10) (10) 100 100 100 100
Mix - M2 per tonne 300 400 500 500 300 0 100 200 200 300 300 300 300
Scheduled & Unscheduled Maint. 20% 10% 15% 5% 5% 15% 5% 10% 0% 5% 5% 5% 5%
% Capacity Utilisation 60% 80% 72% 96% 52% 69% 59% 86%
Forecast 5 year CAGR% 3% 3% 5% 10% 3% 3% 5% 10%
Fixed Overhead 17.6 20.1 15.6 24.0 6.6 5.1 2.6 9.4 11.0 15.0 13.0 14.6
Payroll & Oncosts 7.5 10.0 10.0 14.4 1.5 0.0 2.0 4.8 6.0 10.0 8.0 9.6
# Employees 500 400 500 600 400 100 0 100 200 400 400 400 400
Payroll & Oncosts per employee 15,000 25,000 20,000 24,000 15,000 25,000 20,000 24,000 15,000 25,000 20,000 24,000
Motor Vehicles 1.0 1.2 0.8 0.7 0.7 0.3 0.5 0.1 0.0 0.7 0.7 0.7 0.7
Coms & Computers 0.6 0.5 0.8 1.0 0.5 0.1 0.0 0.3 0.5 0.5 0.5 0.5 0.5
Travel & Entertainment 1.0 0.5 0.7 1.0 0.5 0.5 0.0 0.2 0.5 0.5 0.5 0.5 0.5
Marketing & Growth costs 4.0 3.0 2.0 3.0 2.0 2.0 1.0 0.0 1.0 2.0 2.0 2.0 2.0
Repairs & Maint 1.5 1.3 0.5 2.0 0.5 1.0 0.8 0.0 1.5 0.5 0.5 0.5 0.5
Premises cost 0.5 0.6 0.3 0.4 0.3 0.2 0.3 0.0 0.1 0.3 0.3 0.3 0.3
Consultants 1.0 2.0 0.3 1.0 0.3 0.7 1.7 0.0 0.7 0.3 0.3 0.3 0.3
Other 0.5 1.0 0.2 0.5 0.2 0.3 0.8 0.0 0.3 0.2 0.2 0.2 0.2
Depreciation 6.0 5.0 4.0 4.0 0.0 1.0 0.0 0.0 6.0 4.0 4.0 4.0
Life 25.0 20.0 25.0 25.0 25.0 0.0 (5.0) 0.0 0.0 25 25 25 25
Abnormals 2.0 1.0 1.0 1.0 1.0 1.0 0.0 0.0 0.0 1.0 1.0 1.0 1.0
2009 PotentialGAP TO BEST - KPI2009 Financials GAP TO BEST - $m
38
APPENDIX 3
EXA
M
PLE
EXA
M
PLE
MISSION VALUES COC & DOAVISION TARGETS
REPORTING
• Hourly Alert
• Daily – KPIs
• Weekly – Cash
• Monthly – BPR
• Qtrly – Forecasts
• Annual – Budget
• A
• B
• C
• D
• A
• B
• C
• D
SITE VISITS
• CEO Business Reviews
• CEO / CFO Major Capital Project Reviews
• CFO Stewardship & Commercial Reviews
• ELT Monthly Reviews
• Board Meetings
• External & Internal Audits
ELT GOVERNANCE FRAMEWORK
OTHER
• “Whistle Blower” System
• OHS & E Alert System
• Weekly Telecons – Cash
• COC & DOA Training Programs
• Values / Leadership Training Program
OCT
• Forecast
Review
JUL
• LY Review
FEB
• Capex & WC
AUG
• Behavioral
Change
MAR
• Deep Dive
Signoff
SEP
• OHS&E
APR
• Budget &
Risk Review
JAN
• Strategy &
Growth
MAY
• Stewardship &
Internal Audit
NOV
• Benchmark
JUN
• People &
KRAs
DEC
• CPP
ELT MONTHLY ONE DAY REVIEWS SPECIAL AGENDA (DEEP DIVES)
APPENDIX 4
39
EXA
M
PLE
EXA
M
PLE
40
APPENDIX 5
KPI: Owner: Target % Change:
Key Objective: EBIT Sensitivity 1% :
Performance: Target EBIT Impact:
Forecast % Change:
Forecast EBIT Impact:
10
Increase Uptime from average of 70% in 2006 to 83% in 2007
YTD Uptime is 2% below BUD (10% higher than LY). Expect to finish the year 1%
below BUD (12% higher than LY). YTD improvement is due to Uptime Project.
Month – worse than forecast: Due to Bottom Dross removal.
UPTIME % - MCL VP Manufacturing
YTD Downtime % - Pareto AnalysisYTD Downtime % - Pareto Analysis
STATUS COMMENTSSTATUSIMPACTWHOTOP 3 ACTIONS / PROJECTS TO DELIVER THIS QTR FORECASTREF.
UML3
UML2
UML1
On-trackMCL MgrBottom Dross Issue: Manage bottom dross growth until main pot replacement, by consistency
of schedule cleaning and implement of dross grab to removed mushy dross.
On-trackMCL MgrProcedure: Implement Reliability Workshop action plans
DoneMCL MgrEquipment: Replace MCL Welder control to give consistency of welding quality
On-trackMaint MgrJul’07Review potential local vendor for pot replacement.UML7
UML8
STATUS COMMENTSSTATUSIMPACTWHOWHENTOP 5 ACTIONS / PROJECTS TO IMPACT BEYOND THIS QTRREF.
On-trackMaint MgrOct’07Equipment : Placing PO and commitment for main pot replacement project.UML6
InitiatedMCL
Manager
Dec ’07Standardization process map resin areaUML5
UML4 InitiatedVP MfgOct ‘07Bottom dross issue: Ensure new pot design is capable of minimizing dross build-up
Trend – MonthTrend – MonthPerformancePerformance
13%
US$0.3m *
US$3.9m
12%
US$3.6m
EXA
M
PLE
EXA
M
PLE
MONTHLY KPI REPORT – Situation, Reason, Action
EXAMPLES OF EBIT IMPROVEMENT PROCESS
9
Example - E - Deep Dive Summary on Material Benchmark Gap for Packaging cost per tonne
SBU - NSW
• Implementation Leader – Joe Brown (NSW Packaging Mgr)
• ARITHMETIC BENCHMARK GAP TO BE ANALYSED = A$700k
 Cost per Tonne = A$15 , Best A$8 ( SBU NZ )
 Annual Tonnes despatched by Company NSW = 100,000 , therefore A$7 p/t gap = A$700,000 p.a.
 Key reasons
 Different material type of packaging – impact A$200k p.a.
 Outsourcing used by NSW but in-house by NZ – impact A$400k p.a.
 Different labor rates between countries that two businesses operate – impact A$100k. The labor rate difference
cannot be closed as it reflects different market rates between the two countries..but will attempt to recover it in the
selling price to the customer (see spread analysis)
 Risks – Ensure NSW customers will accept NZ packaging
 Therefore Agreed Gap for targeted closure – A$600k
 Target implementation completion – Week 45
41
APPENDIX 6
EXA
M
PLE
EXA
M
PLE

More Related Content

What's hot

Case study: Why you need ISO/IEC 20000 to ensure success?
Case study: Why you need ISO/IEC 20000 to ensure success?Case study: Why you need ISO/IEC 20000 to ensure success?
Case study: Why you need ISO/IEC 20000 to ensure success?
PECB
 
ISO 13485
ISO 13485ISO 13485
ISO 13485
I3CGLOBAL
 
Ims (integrated Management system )
Ims (integrated Management system )Ims (integrated Management system )
Ims (integrated Management system )
Ascent World
 
Compliance Rockstar Infographic
Compliance Rockstar InfographicCompliance Rockstar Infographic
Compliance Rockstar Infographic
NetDimensions
 
CISA Training - Chapter 2 - 2016
CISA Training - Chapter 2 - 2016CISA Training - Chapter 2 - 2016
CISA Training - Chapter 2 - 2016
Hafiz Sheikh Adnan Ahmed
 
Grc coso cobit_mapped_shared
Grc coso cobit_mapped_sharedGrc coso cobit_mapped_shared
Grc coso cobit_mapped_shared
Seek Hai, Frank Chin
 
10 Benefits of Implementing ISO/IEC 20000 in an Organization
10 Benefits of Implementing ISO/IEC 20000 in an Organization10 Benefits of Implementing ISO/IEC 20000 in an Organization
10 Benefits of Implementing ISO/IEC 20000 in an Organization
PECB
 
Iso 22301 course in hyderabad
Iso 22301 course in hyderabadIso 22301 course in hyderabad
Iso 22301 course in hyderabad
eascertification
 
Sap Risk Advisory Service V1.0
Sap Risk Advisory Service V1.0Sap Risk Advisory Service V1.0
Sap Risk Advisory Service V1.0agc infotech
 
Health, Safety and Security through Compliance
Health, Safety and Security through ComplianceHealth, Safety and Security through Compliance
Health, Safety and Security through Compliance
kanew396
 
NQA ISO 13485 Implementation Guide
NQA ISO 13485 Implementation GuideNQA ISO 13485 Implementation Guide
NQA ISO 13485 Implementation Guide
NQA
 
Vendor Management - PCI DSS, ISO 27001, E13PA,HIPPA & FFIEC
Vendor Management - PCI DSS, ISO 27001, E13PA,HIPPA & FFIECVendor Management - PCI DSS, ISO 27001, E13PA,HIPPA & FFIEC
Vendor Management - PCI DSS, ISO 27001, E13PA,HIPPA & FFIEC
ControlCase
 
Enterprise Spice Scope
Enterprise Spice ScopeEnterprise Spice Scope
Enterprise Spice Scopeespice
 
CE Marking
CE MarkingCE Marking
CE Marking
I3CGLOBAL
 
ISO 27001 ISMS MEASUREMENT
ISO 27001 ISMS MEASUREMENTISO 27001 ISMS MEASUREMENT
ISO 27001 ISMS MEASUREMENT
Gaffri Johnson
 
Global Compliance Across the ADP Portfolio
Global Compliance Across the ADP PortfolioGlobal Compliance Across the ADP Portfolio
Global Compliance Across the ADP Portfolio
ADP, LLC
 
Future ISO 22301 - BCM Requirements
Future ISO 22301 - BCM RequirementsFuture ISO 22301 - BCM Requirements
Future ISO 22301 - BCM Requirements
SANMADHUR TRAININGS AND CONSULTING
 

What's hot (20)

Case study: Why you need ISO/IEC 20000 to ensure success?
Case study: Why you need ISO/IEC 20000 to ensure success?Case study: Why you need ISO/IEC 20000 to ensure success?
Case study: Why you need ISO/IEC 20000 to ensure success?
 
ISO 13485
ISO 13485ISO 13485
ISO 13485
 
Ims (integrated Management system )
Ims (integrated Management system )Ims (integrated Management system )
Ims (integrated Management system )
 
Compliance Rockstar Infographic
Compliance Rockstar InfographicCompliance Rockstar Infographic
Compliance Rockstar Infographic
 
CISA Training - Chapter 2 - 2016
CISA Training - Chapter 2 - 2016CISA Training - Chapter 2 - 2016
CISA Training - Chapter 2 - 2016
 
Grc coso cobit_mapped_shared
Grc coso cobit_mapped_sharedGrc coso cobit_mapped_shared
Grc coso cobit_mapped_shared
 
10 Benefits of Implementing ISO/IEC 20000 in an Organization
10 Benefits of Implementing ISO/IEC 20000 in an Organization10 Benefits of Implementing ISO/IEC 20000 in an Organization
10 Benefits of Implementing ISO/IEC 20000 in an Organization
 
Iso 22301 course in hyderabad
Iso 22301 course in hyderabadIso 22301 course in hyderabad
Iso 22301 course in hyderabad
 
Sap Risk Advisory Service V1.0
Sap Risk Advisory Service V1.0Sap Risk Advisory Service V1.0
Sap Risk Advisory Service V1.0
 
ISO 22301, The first ever ISO for BCM - Presented at BCI Qatar Forum
ISO 22301, The first ever ISO for BCM - Presented at BCI Qatar ForumISO 22301, The first ever ISO for BCM - Presented at BCI Qatar Forum
ISO 22301, The first ever ISO for BCM - Presented at BCI Qatar Forum
 
Health, Safety and Security through Compliance
Health, Safety and Security through ComplianceHealth, Safety and Security through Compliance
Health, Safety and Security through Compliance
 
NQA ISO 13485 Implementation Guide
NQA ISO 13485 Implementation GuideNQA ISO 13485 Implementation Guide
NQA ISO 13485 Implementation Guide
 
Vendor Management - PCI DSS, ISO 27001, E13PA,HIPPA & FFIEC
Vendor Management - PCI DSS, ISO 27001, E13PA,HIPPA & FFIECVendor Management - PCI DSS, ISO 27001, E13PA,HIPPA & FFIEC
Vendor Management - PCI DSS, ISO 27001, E13PA,HIPPA & FFIEC
 
Control Your Enterprise
Control Your EnterpriseControl Your Enterprise
Control Your Enterprise
 
Cobit5 and-grc
Cobit5 and-grcCobit5 and-grc
Cobit5 and-grc
 
Enterprise Spice Scope
Enterprise Spice ScopeEnterprise Spice Scope
Enterprise Spice Scope
 
CE Marking
CE MarkingCE Marking
CE Marking
 
ISO 27001 ISMS MEASUREMENT
ISO 27001 ISMS MEASUREMENTISO 27001 ISMS MEASUREMENT
ISO 27001 ISMS MEASUREMENT
 
Global Compliance Across the ADP Portfolio
Global Compliance Across the ADP PortfolioGlobal Compliance Across the ADP Portfolio
Global Compliance Across the ADP Portfolio
 
Future ISO 22301 - BCM Requirements
Future ISO 22301 - BCM RequirementsFuture ISO 22301 - BCM Requirements
Future ISO 22301 - BCM Requirements
 

Viewers also liked

Seattle - Trường Anh ngữ Seattle - Davao
Seattle - Trường Anh ngữ Seattle - DavaoSeattle - Trường Anh ngữ Seattle - Davao
Seattle - Trường Anh ngữ Seattle - Davao
MYD Vietnam
 
Ontogenia T
Ontogenia TOntogenia T
Ontogenia T
BernardoOro
 
Mkt social
Mkt socialMkt social
Psychosocial Risk Factor in Call Centres: Analysing Work Design and Well-Bein...
Psychosocial Risk Factor in Call Centres: Analysing Work Design and Well-Bein...Psychosocial Risk Factor in Call Centres: Analysing Work Design and Well-Bein...
Psychosocial Risk Factor in Call Centres: Analysing Work Design and Well-Bein...
Himanshu Shrivastava
 
Cap 1,el transporte maritimo
Cap 1,el transporte maritimoCap 1,el transporte maritimo
Cap 1,el transporte maritimo
universidad de panama
 
Búsqueda eficaz de evidencias en cuidados
Búsqueda eficaz de evidencias en cuidadosBúsqueda eficaz de evidencias en cuidados
Búsqueda eficaz de evidencias en cuidados
SocialBiblio
 

Viewers also liked (8)

Seattle - Trường Anh ngữ Seattle - Davao
Seattle - Trường Anh ngữ Seattle - DavaoSeattle - Trường Anh ngữ Seattle - Davao
Seattle - Trường Anh ngữ Seattle - Davao
 
250402
250402250402
250402
 
jpchaves&co
jpchaves&cojpchaves&co
jpchaves&co
 
Ontogenia T
Ontogenia TOntogenia T
Ontogenia T
 
Mkt social
Mkt socialMkt social
Mkt social
 
Psychosocial Risk Factor in Call Centres: Analysing Work Design and Well-Bein...
Psychosocial Risk Factor in Call Centres: Analysing Work Design and Well-Bein...Psychosocial Risk Factor in Call Centres: Analysing Work Design and Well-Bein...
Psychosocial Risk Factor in Call Centres: Analysing Work Design and Well-Bein...
 
Cap 1,el transporte maritimo
Cap 1,el transporte maritimoCap 1,el transporte maritimo
Cap 1,el transporte maritimo
 
Búsqueda eficaz de evidencias en cuidados
Búsqueda eficaz de evidencias en cuidadosBúsqueda eficaz de evidencias en cuidados
Búsqueda eficaz de evidencias en cuidados
 

Similar to Is your Business IPO ready

Performance Improvement Roadmap V4
Performance Improvement Roadmap V4Performance Improvement Roadmap V4
Performance Improvement Roadmap V4
mulcahymike
 
Holistic Approach
Holistic ApproachHolistic Approach
Holistic Approachreachab7
 
Competency_mapping.ppt
Competency_mapping.pptCompetency_mapping.ppt
Competency_mapping.ppt
shwetalalwani
 
Strategic Mgmt - Internal and external 3.pptx
Strategic Mgmt - Internal and external 3.pptxStrategic Mgmt - Internal and external 3.pptx
Strategic Mgmt - Internal and external 3.pptx
alex133249
 
ProAction Case Studies - Diligence through Exit Q3 2015
ProAction Case Studies - Diligence through Exit Q3 2015ProAction Case Studies - Diligence through Exit Q3 2015
ProAction Case Studies - Diligence through Exit Q3 2015Tim Van Mieghem
 
2014 Process Management Strategic Overview
2014 Process Management Strategic Overview2014 Process Management Strategic Overview
2014 Process Management Strategic Overview
Riz Hasan
 
Intro To Alignment By Design
Intro To Alignment By DesignIntro To Alignment By Design
Intro To Alignment By DesignThomas Bradley
 
ISO 9001 Implementation Series - Session 1.pptx
ISO 9001 Implementation Series - Session 1.pptxISO 9001 Implementation Series - Session 1.pptx
ISO 9001 Implementation Series - Session 1.pptx
SaravananBabu13
 
Quality Resume
Quality ResumeQuality Resume
Quality Resumevipin rana
 
Quality Resume
Quality ResumeQuality Resume
Quality Resumevipin rana
 
Girish yadav business_pcl-ii_hr_talent_management_assignment_b
Girish yadav business_pcl-ii_hr_talent_management_assignment_bGirish yadav business_pcl-ii_hr_talent_management_assignment_b
Girish yadav business_pcl-ii_hr_talent_management_assignment_bSapna Nagaraj
 
Information Management Capabilities, Competencies & Staff Maturity Assessment
Information Management Capabilities, Competencies & Staff Maturity AssessmentInformation Management Capabilities, Competencies & Staff Maturity Assessment
Information Management Capabilities, Competencies & Staff Maturity Assessment
Christopher Bradley
 
Prosci Change Maturity Community of Practice webinar
Prosci Change Maturity Community of Practice webinar Prosci Change Maturity Community of Practice webinar
Prosci Change Maturity Community of Practice webinar
Catherine Smithson
 
What ISO Management Systems can learn from Balanced Scorecard?
What ISO Management Systems can learn from Balanced Scorecard?What ISO Management Systems can learn from Balanced Scorecard?
What ISO Management Systems can learn from Balanced Scorecard?
PECB
 
Bridge Knowle "YEAR END PERFORMANCE APPRAISAL" Workshop
Bridge Knowle "YEAR END PERFORMANCE APPRAISAL" WorkshopBridge Knowle "YEAR END PERFORMANCE APPRAISAL" Workshop
Bridge Knowle "YEAR END PERFORMANCE APPRAISAL" Workshop
Kenny Ong
 
Hr impacting business
Hr impacting businessHr impacting business
Hr impacting business
Poushali Dey
 
Strat Review Apr 16
Strat Review Apr 16Strat Review Apr 16
Strat Review Apr 16rayfagan1
 
Performance Reviews & Appraisal - Information and Training by Pathway Group
Performance Reviews & Appraisal - Information and Training by Pathway GroupPerformance Reviews & Appraisal - Information and Training by Pathway Group
Performance Reviews & Appraisal - Information and Training by Pathway Group
The Pathway Group
 

Similar to Is your Business IPO ready (20)

Performance Improvement Roadmap V4
Performance Improvement Roadmap V4Performance Improvement Roadmap V4
Performance Improvement Roadmap V4
 
Holistic Approach
Holistic ApproachHolistic Approach
Holistic Approach
 
Competency_mapping.ppt
Competency_mapping.pptCompetency_mapping.ppt
Competency_mapping.ppt
 
Strategic Mgmt - Internal and external 3.pptx
Strategic Mgmt - Internal and external 3.pptxStrategic Mgmt - Internal and external 3.pptx
Strategic Mgmt - Internal and external 3.pptx
 
ProAction Case Studies - Diligence through Exit Q3 2015
ProAction Case Studies - Diligence through Exit Q3 2015ProAction Case Studies - Diligence through Exit Q3 2015
ProAction Case Studies - Diligence through Exit Q3 2015
 
2014 Process Management Strategic Overview
2014 Process Management Strategic Overview2014 Process Management Strategic Overview
2014 Process Management Strategic Overview
 
Intro To Alignment By Design
Intro To Alignment By DesignIntro To Alignment By Design
Intro To Alignment By Design
 
ISO 9001 Implementation Series - Session 1.pptx
ISO 9001 Implementation Series - Session 1.pptxISO 9001 Implementation Series - Session 1.pptx
ISO 9001 Implementation Series - Session 1.pptx
 
Quality Resume
Quality ResumeQuality Resume
Quality Resume
 
Quality Resume
Quality ResumeQuality Resume
Quality Resume
 
Girish yadav business_pcl-ii_hr_talent_management_assignment_b
Girish yadav business_pcl-ii_hr_talent_management_assignment_bGirish yadav business_pcl-ii_hr_talent_management_assignment_b
Girish yadav business_pcl-ii_hr_talent_management_assignment_b
 
Information Management Capabilities, Competencies & Staff Maturity Assessment
Information Management Capabilities, Competencies & Staff Maturity AssessmentInformation Management Capabilities, Competencies & Staff Maturity Assessment
Information Management Capabilities, Competencies & Staff Maturity Assessment
 
Prosci Change Maturity Community of Practice webinar
Prosci Change Maturity Community of Practice webinar Prosci Change Maturity Community of Practice webinar
Prosci Change Maturity Community of Practice webinar
 
What ISO Management Systems can learn from Balanced Scorecard?
What ISO Management Systems can learn from Balanced Scorecard?What ISO Management Systems can learn from Balanced Scorecard?
What ISO Management Systems can learn from Balanced Scorecard?
 
Bridge Knowle "YEAR END PERFORMANCE APPRAISAL" Workshop
Bridge Knowle "YEAR END PERFORMANCE APPRAISAL" WorkshopBridge Knowle "YEAR END PERFORMANCE APPRAISAL" Workshop
Bridge Knowle "YEAR END PERFORMANCE APPRAISAL" Workshop
 
Hr impacting business
Hr impacting businessHr impacting business
Hr impacting business
 
Lean_Sigma_Awareness
Lean_Sigma_AwarenessLean_Sigma_Awareness
Lean_Sigma_Awareness
 
Imran khan
Imran khanImran khan
Imran khan
 
Strat Review Apr 16
Strat Review Apr 16Strat Review Apr 16
Strat Review Apr 16
 
Performance Reviews & Appraisal - Information and Training by Pathway Group
Performance Reviews & Appraisal - Information and Training by Pathway GroupPerformance Reviews & Appraisal - Information and Training by Pathway Group
Performance Reviews & Appraisal - Information and Training by Pathway Group
 

Is your Business IPO ready

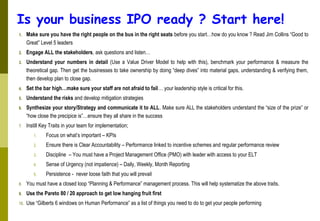
  • 1. Is your business IPO ready ? Start here! 1. Make sure you have the right people on the bus in the right seats before you start…how do you know ? Read Jim Collins “Good to Great” Level 5 leaders 2. Engage ALL the stakeholders, ask questions and listen… 3. Understand your numbers in detail (Use a Value Driver Model to help with this), benchmark your performance & measure the theoretical gap. Then get the businesses to take ownership by doing “deep dives” into material gaps, understanding & verifying them, then develop plan to close gap. 4. Set the bar high…make sure your staff are not afraid to fail… your leadership style is critical for this. 5. Understand the risks and develop mitigation strategies 6. Synthesize your story/Strategy and communicate it to ALL. Make sure ALL the stakeholders understand the “size of the prize” or “how close the precipice is”…ensure they all share in the success 7. Instill Key Traits in your team for implementation; 1. Focus on what’s important – KPIs 2. Ensure there is Clear Accountability – Performance linked to incentive schemes and regular performance review 3. Discipline – You must have a Project Management Office (PMO) with leader with access to your ELT 4. Sense of Urgency (not impatience) – Daily, Weekly, Month Reporting 5. Persistence - never loose faith that you will prevail 8. You must have a closed loop “Planning & Performance” management process. This will help systematize the above traits. 9. Use the Pareto 80 / 20 approach to get low hanging fruit first 10. Use “Gilberts 6 windows on Human Performance” as a list of things you need to do to get your people performing
  • 2. Stage 1 Listen & ask questions Identify potential improvement Sell Need for change Stage 2 Deep Dive Reviews Benchmark & Re-engineer Processes Develop Actions Stage 3 Synthesize & Implement It starts and ends with having a credible story that hangs together? Forget the final presentations which are easy, get these “Building Blocks” right which will give your story credibility. 2 Business Performance Review SYNTHESIZE, SIGN OFF. SYNDICATE, IMPLEMENT & MONITOR ACHIEVEMENT OF PLAN Stewardship Review & Control Processes Employee Survey Top 20 Leadership Interviews & Capability Review Behavioral change plan developed External Customer Survey KEY GAP “Deep Dives” TO SUPPORT TARGETS WITH ACTIONS OHS & E Process Manufacturing Excellence Capability Work Cap. Mgt Spend Control S&OP Management IT Systems Capability Internal. Customer Surveys by Dept Governance Framework, Policy & Process Standards Risk Review Recruitment, Training, Development & Retention effectiveness Customer Service Excellence Understand Strategy & Review Structure Alignment Cash & Debt Mgt Synthesize the critical reasons for change into a Story & Syndicate across/down the organisation to all stakeholders Product & Market Development Process Sales Capability Supplier Transactional Process Efficiency Procure to Pay Customer Transactional Process Efficiency Order to Fulfillment Employee Transactional Process Efficiency Payroll & Expense Reimbursement Planning & Performance Management Process Margin / Pricing Management Process Develop Value Driver Model & Theoretical Improvement Potential
  • 3. 3 Stage 1 – Building Blocks & Objectives  Understand Strategy & Review Structure Alignment - Understand existing strategy (Shareholder perceptions / expectations) & review alignment of organisation structure  Top Leadership Review - Understand ideas (SWOT) & leadership capability for each of the senior managers and high potential employee’s – “Are the right people on the bus in the right seats”  Internal Customer Surveys - Understand how each department is perceived by its internal customers for both KRAs and Key Behaviors  Business Performance Review - Understand current & forecast business performance. Develop 80/20 broad range of critical KPIs to quickly instill focus, accountability & sense of urgency  Risk Review - Understand the key business risks, their potential impact, the mitigation strategies & probability before & after mitigation  External Customer Survey - Understand the customer perceptions of our value proposition & business performance (& our SWOT)  Employee Survey - Understand the Employee perceptions of the business performance (& SWOT) & their own performance  Value driver model - Develop a “Theoretical Potential Improvement “ in the business by Developing a Value Driver model and benchmark all its components against best practice and measure gap,  Synthesize Story & Syndicate - Ensure everyone in the business can see the prize or precipice so they understand why we have to change
  • 4. 4 Stage 2 – Building Blocks & Objectives  Governance Framework, Policy & Process Standards - Ensure a governance framework is in place that meets best practice & exceeds all listing requirements  Behavioral Change Plan - From feedback, develop detailed behavioral change plan needed to meet all stakeholder objectives (mission, values, targets, etc)  Customer Service – Develop detailed plan to ensure the customer service is consistently competitive, value enhancing & meeting our promise to the customer ?  Stewardship Review & Control Processes - Verify Balance sheet values , identify any major write- offs and/or control weakness with actionable plan  Cash Management & Funding Process – Review adequacy of capital structure & funding facilities. Implement a process ensuring CFO has day to day control of funding and all material cash outflows  CAPEX & Discretionary Spend Process – Put process in place to ensure all CAPEX & Discretionary Spend (Marcom, R&M, etc) is properly justified, approved, prioritised, controlled in timely manner with post implementation review.  Working Capital Management – Put process in place to control & optimize WC % to “Best Practise”  Margin Management Review – Ensure Margin Management Performance & Processes are “Best Practise”. Identify margin improvement potential & process changes.  Planning & Performance Management System - Ensure there is a process in place that drives ongoing systematic improvement, provides clear accountability, focuses the business on things that are important and creates a sense of urgency
  • 5. 5 Stage 2 – Building Blocks & Objectives  Supplier – Procure to Pay – Reengineer Process to be “Best Practice”  Customer – Order to Fulfillment - Reengineer Process to be “Best Practice”  Employee – Payroll & Exp Reimbursement - Reengineer Process to be “Best Practice”  Sales Capability - Review Capability, Performance & Processes. Identify improvement opportunities  Product & Market Development Process - Do we have an effective process & have we identified & invested in a sufficient pipeline of growth opportunities to meet our growth targets ?  IT / IS Systems Capability - Are these systems appropriate for our strategic & operational needs and are they efficient and cost effective ?  OHS&E - Reengineer Process to be “Best Practice”  Manufacturing Capability - Reengineer Process to be “Best Practice”  Supply Chain Management - Reengineer Process to be “Best Practice”  People - Recruitment, Training, Development & Retention - Understand if performance shortfalls are due to any systemic factor that can be corrected. Reengineer Process to be “Best Practice”  Deep Dives - Turn “Theoretical Gap” into confirmed opportunities with management commitment and detailed hard action plans
  • 6. Strategy & Structure 5 Forces Review including trends and scenario’s SWOT Review Competitor Review Vision, Targets Options & Rational Key Actions Key Enablers, Resources & Risks  Sponsor: CEO  1 week timeframe  Facilitated by CEO  2 day workshop with Board & Leadership Team Objective: Understand existing strategy (and shareholder perceptions, expectations) and alignment of structure 6
  • 7. Top 20 Leadership Review Get all to read “Good to Great” & prepare comments Do 360 degree Performance Reviews List track record and key achievements in last 10 years One on One Interview with CEO Competency Gaps & progression potential Finalised Development Plans completed and implemented started  Sponsor: CEO  6 week timeframe  Facilitated by External HR Consultant  CEO to identify review participants  CEO to prepare plan on what changes will be made Objective: Understand ideas (SWOT) & leadership capability for each of the senior managers and high potential employee’s – “Are the right people on the bus in the right seats” 7 Level 5 Related Skills and Attributes •Self Management •Goal Achievement •Results Orientation •Interpersonal Skills •Diplomacy and Tact •Personal Accountability •Influencing Others •Developing Others •Flexibility •Versatility •Teamwork •Decision Making •Resiliency •Self Starting •Accountability for Others •Continuous Learning •Conceptual Thinking •Empathetic Outlook •Leading Others •Customer Focus •Objective Listening Level 5 Related Values and Motivators Learning Leading Results The value of pursuit of knowledge, continuous improvement of self and the organization. The value of personal recognition and control over their own destiny and others. The value of practical achievements, ROI, on time achievement, energy and resources. Level 5 Related Behavioral Styles Consistency Influence Controlling Predictable, steady, composed. Steadiness supports the hedgehog concept. Level 5s are not inherently charismatic. They tend to be compassionate, amiable, objective and logical. Levels 5s are not domineering or highly driven. They are inclined to be purposeful, moderate and conservative.
  • 8. Employee Survey 20% of employees interviewed by external facilitator All employees do questionnaire compiled by external consultant Present findings Redo every year to measure trend  Sponsor: CEO  4 week timeframe  Facilitated by External HR Consultant  Employee questionnaires… example questions;  Summarise your CV  What are your Goals  Rate your Job Satisfaction  KRAs – describe your performance  What are your strengths  What do you need from company to perform better  What do you like about culture that must be retained  What do we need to improve about the culture  How can we improve the performance of the department  How can we improve the business performance  Redo in 12 months times to measure change Objective: Understand the Employee perceptions of the business performance (& SWOT) & their own performance 8
  • 9. 13 Behaviours & Soft Skills - Our Customers (Presidents) Perceptions – Big Improvement Internal Customer Surveys KRA’s Behavior / Soft Skills  Sponsor: CEO  4 week timeframe  Facilitated by VP HR  For all Functional areas; Finance, IT, HR, Procurement, CS, Logistics, SCM, Manufacturing, OHS & E, S& M  Redo in 12 months to measure change Objective: Understand how each department is perceived by its internal customers for both KRAs and Key Behaviors 14 KRA’s - Our Customers Perceptions - Still some upside, but improving 9 EXAMPLEEXAMPLE EXAMPLEEXAMPLE
  • 10. Business Performance Review OHS&E Financials Market Operations  Sponsor: CFO  2 week timeframe  Facilitated by CFO  One week preparation inputting 5 year history and forecasts  1 day workshop presenting to Management Team to review performance. Agree on initial 80/20 KPIs  Design & implement daily, weekly reporting (see example in Appendix 1) Objective: Understand current & forecast business performance. Develop initial 80/20 broad range of critical KPIs to quickly instill focus, accountability & sense of urgency 10
  • 11. Risk Review Brainstorm Key Risks Select Top 10 Risks Agree on Potential impact (develop models) Potential Mitigation Strategies Probability before & after If risk & impact still too high develop more mitigation 11  Sponsor: CFO  1 week timeframe  Facilitated by External consultant  2 day workshop with Board & Leadership Team  Ensure they are incorporated into ongoing monthly reporting so that mitigation efforts are progressed Objective: Understand the key business risks, their potential impact, the mitigation strategies & probability before & after mitigation
  • 12.  Sponsor: VP S&M  8 week timeframe  Facilitated by Market Research Consultant  Customer questionnaires. … example questions;  Rate our performance levels relative to competitors  Rate our behaviors relative to competitors  What are our biggest threats  What are our biggest opportunities  How can we help your business  Redo in 12 months times to measure change Objective: Understand the customer perceptions of our value proposition & business performance (& our SWOT) 12 External Customer Survey 20% of customers interviewed by external facilitator All customers asked do questionnaire compiled by external consultant Present findings Redo every year to measure trend
  • 13. Value Driver Model Develop Draft Conceptual Models Populate models with data Benchmark model components to best practice Identify High Level gaps with targeted performance  Sponsor: CFO  8 week timeframe  Facilitated by Consultant  Prepare draft conceptual model (see example in Appendix 2)  1 day initial workshop with commercial team & management reviewing/ explaining model concept and data requirements  Four week preparation inputting & verifying 5 year history and forecasts  Three weeks for benchmarking components  1 day workshop presenting to Management Team to review performance and see major targeted performance gaps (see example in Appendix 3) Objective: Develop a “Theoretical Potential Improvement “ in the business by Developing a Value Driver model and benchmark all its components against best practice and measure gap, 13
  • 14. Objective: Ensure a governance framework is in place that meets best practice & exceeds all listing requirements  Sponsor: Chairman  One week timeframe  Facilitated by CFO & Auditor  Listing & Regulatory governance requirements  Examples of “Best Practice” governance policies at other companies  CFO to provide example of DOA for review  CFO to provide example of Planning & Control Framework (See Appendix 4)  Two Day workshop attended by  ALL Board members  All ELT members  Facilitator  Conduct workshops to communicate all policies across all employees run by VP HR 14 Governance Framework Mission & Values Delegation of Authorities Compliance & Audit Code of Conduct Planning & Control Syndicate
  • 15. Behavioral Change Plan Review Stage 1 feedback from stakeholders Identify behavioral barriers to achieve objectives Identify solutions to remove barriers Develop action plan to implement Communicate to stakeholders  Sponsor: CEO  8 week timeframe  Appoint external Consultant to Facilitate 15 13 Behaviours & Soft Skills - Our Customers (Presidents) Perceptions – Big Improvement EXAMPLEEXAMPLE Objective: From feedback, develop detailed behavioral change plan needed to meet all stakeholder objectives (mission, values, targets, etc)
  • 16. Recruitment, Training, Develop. & Retention Effectiveness Is there clear Directional Info. (PD,KRAs,Targets) ? Does the person have sufficient Resources or Tools to do the job ? Are rewards competitive, performance reviews effective & sufficient recognition given ? Are there training and development plans ? Do the employees have the capacity to do their role ? Are they motivated… a good fit or enjoyable workplace environment ?  Sponsor: VP HR  8 week timeframe  Appoint External HR Consultant to Facilitate  Use Gilberts 6 window model to determine process issues Objective: Understand if performance shortfalls are due to any systemic factor that can be corrected 16
  • 17. Stewardship Review & Control Processes Prepare templates Undertake Stewardship Review Management signoff of findings & action plan Management process in place to ensure gaps are closed Implement Actions  Sponsor: CFO  3 week timeframe  Facilitated by CFO & Auditor – Template provided by CFO & signed off by Auditor  Three weeks to fill in template by accounting team with all supporting schedules  2 day review with finance team facilitated by CFO & Auditor with output being actionable issue list 17 Objective: Verify Balance sheet values , identify any major write-offs and/or control weakness with actionable plan
  • 18. Cash Management & Funding Process Appoint Regional Cash Management Bank Design & Implement online payment process Review Capital structure, facilities Develop & implement centralized funding arrangements, align DOA  Sponsor: CFO  8 week timeframe including implementation  Facilitated by Treasurer  2 day workshop designing online payment process led by Treasurer & Bank  Review Capital structure, facilities and WAC  Gain approval for changes from CEO & Board Objective: Review adequacy of capital structure & funding facilities. Implement a process ensuring CFO has day to day control of funding and all material cash outflows 18
  • 19. CAPEX & Discretionary Spend Control Process Justification Templates & Models Approval Review Ranking Process Implementation Control Post Implementation Review Communicate across organisation Review DOA spend limits  Sponsor: CFO  8 Week Timeframe  Appoint facilitator  2 day workshop to review and test process  Process signed off by ELT  Communication Workshops across all relevant people run by CFO Objective: Put process in place to ensure all CAPEX & Discretionary Spend (Marcom, R&M, etc) is properly justified, approved, prioritised, controlled in timely manner with post implementation review. 19
  • 20. Working Capital Management Set targets after understanding Value Proposition WC terms & benchmark its competitiveness Minimize payment runs to one per month Make Sales Dept responsible for collection & set weekly collection targets Clear Credit Limit, stop credit and legal proceeding rules enforced by Finance Implement Weekly Cash & WC Forecast / Control process Cost VP WC Terms into CPP margin numbers Monthly Sales & Operation Planning meeting to optimize DOI Objective: Put process in place to control & optimize WC % to “Best Practise”  Sponsor: CFO  8 week timeframe  Appoint facilitator 20
  • 21. Margin Management Review Margin Calculation Definition & Costing Methodology Pricing Process & DOA Compliance Cost Plus v Market Based Discount & Rebate Structure CPP Matrix Analysis (Variation) Reporting  Sponsor: CFO  8 week timeframe  Appoint Consultant to Facilitate (PCM ?)  Understand margins  Pricing policies and processes  Costing policies and processes  Explain variations  Identify total improvement potential for margins  Identify gaps to “Best Practice” & agree on process changes Objective: Ensure Margin Management Performance & Processes are “Best Practise”. Identify margin improvement potential & process changes. 21
  • 22. Supplier Procure to Pay Identify Best Practice Map “AS IS” process Document Gaps to “Best Practice” Understand Risk/cost/resources to close gap Develop longer term plan for delivering last 20% Develop 80 / 20 strategy for quick implementation Objective: Reengineer Process to be “Best Practice”  Sponsor: CFO  8 week timeframe  Facilitated by Consultant, FC & VP IS/IT 22
  • 23. Customer Order to Fullfillment Identify Best Practice Map “AS IS” process Document Gaps to “Best Practice” Understand Risk/cost/resources to close gap Develop longer term plan for delivering last 20% Develop 80 / 20 strategy for quick implementation Objective: Reengineer Process to be “Best Practice”  Sponsor: CFO  8 week timeframe  Facilitated by Consultant, FC & VP S&M 23
  • 24. Employee Payroll & Exp. Reimbursement Identify Best Practice Map “AS IS” process Document Gaps to “Best Practice” Understand Risk/cost/resources to close gap Develop longer term plan for delivering last 20% Develop 80 / 20 strategy for quick implementation Objective: Reengineer Process to be “Best Practice”  Sponsor: CFO  8 week timeframe  Facilitated by Consultant, FC & VP IS/IT 24
  • 25. Sales Capability Value Proposition Competitiveness Project Pipeline & Market Intelligence Data Systems 4P Effectiveness (Marcom) & Sales Incentives Customer & Channel Relationship & Selling Skills CPP Matrix Analysis (Variation) & Reporting Bid Quality & Turnaround Times  Sponsor: VP Sales & Marketing  8 week Timeframe  Appoint Consultant to Facilitate  KPIs compared;  Segment analysis – Quantity. margin p/t, MS%  Value Proposition – lead time, quality, Terms  Spend on Marcom, # of people, people cost Objective: Review Capability, Performance & Processes. Identify improvement opportunities 25
  • 26. Product & Market Development Process New Channels New Products / Services Expand Up / Down Value Chain New Segments M & A opportunities Geographic Footprint Expansion / Coverage  Sponsor: VP Sales & Marketing  8 week Timeframe  Facilitated by External Consultant  With conservative development success, is there sufficient projects in the long term pipeline to meet growth targets ?  KPIs compared;  Time to Market  New Channel  New Segment  New Product  New Geographic Location  % Projects on / ahead of target  3,5 Year Forecast Gap to Target Objective: Do we have an effective process & Have we identified & invested in a sufficient pipeline of growth opportunities to meet our growth targets ? 26
  • 27. IS / IT Systems Capability Measurement KPIs Competitiveness of IS system Age of Infrastructure Outsourcing Options Skills & Experience Technology as enabler of growth  Sponsor: CFO  8 week timeframe  Appoint external IS/IT Consultant to Facilitate  Do we have sufficient measurement systems ie KPIs = downtime, Support costs, Development Costs, Coms Costs , manual and legacy systems  Along with pareto analysis , reason codes for all problems  Do we know “Best Practice” performance and process ? Objective: Are these systems appropriate for our needs and are they efficient and cost effective ? 27
  • 28. Customer Service Excellence Measurement of KPIs (Lead Time, Stock Outs, $DOI, DIFOT%, distribution costs) Benchmark & Pareto Performance Gap Competitiveness of Value Proposition Quality Process On Time Process  Sponsor: VP Operations  8 week timeframe  Appoint external Consultant to Facilitate  Do we have sufficient measurement systems ie KPIs = Customer complaints & Returns, DIFOT%, Customer Loyalty - % of their spend, premium over Next Best Alternative  Along with pareto analysis , reason codes for all problems  Do we know “Best Practice” performance and process ? 28 Objective: Develop detailed plan to ensure the customer service is consistently competitive, value enhancing & meeting our promise to the customer ?
  • 29. OHS & E Process Does the leadership put OHS & E as #1 priority ? Have we implemented mitigating strategies for all High Impact risks / activities ? Do we measure incident pyramid ? Do 100% of employees conduct and questioned in regular audits ? Are all issues raised in Audits closed out in a timely matter Is there regular and sufficient training given ?  Sponsor: VP Operations  8 week timeframe  Appoint External OHS & E Consultant to Facilitate  If we don’t know what is “Best Practice” then we need to find out… eg BHPSTEEL in 1995 sort advice from leader DUPONT Objective: Are the OHS & E processes and performance at “Best Practice” levels 29 X
  • 30. Manufacturing Excellence Capability Measurement Fit for purpose Raw Materials & efficient utilization & batch size Appropriate Equipment (quality and efficiency) Repairs & Maintenance Skills & Experience Production Planning Process & Product Complexity  Sponsor: VP Operations  8 week timeframe  Appoint external manufacturing Consultant to Facilitate  Do we have sufficient measurement systems ie KPIs = downtime, Yield Loss, Throughput, Material Usage Variance, Variable costs, Fixed costs  Along with pareto analysis , reason codes for all problems  Do we know “Best Practice” performance and process ? Objective: Are the Manufacturing processes and performance at “Best Practice” levels 30
  • 31. Supply Chain Management Procurement Warehousing & Stock Management Distribution Forecast Accuracy Outsourcing Production Planning Process & Product Complexity  Sponsor: VP Operations  8 week timeframe  Appoint external manufacturing Consultant to Facilitate  Do we have sufficient measurement systems ie KPIs = Procurement cost, Stock Outs, $DOI, Distribution Costs  Along with pareto analysis , reason codes for all problems  Do we know “Best Practice” performance and process ?  Monthly Sales and Operations Planning Meeting Objective: Are these processes and performance at “Best Practice” levels 31
  • 32. Planning & Performance Process Strategy, Value Driver Model, benchmark & 5Year targets Actions to Close Gap & 1 year budget Integrate with individual STI targetsKPI Reporting Daily, Weekly, Monthly Corrective Actions One on One Performance Reviews Objective: Ensure there is a process in place that drives ongoing systematic improvement, provides clear accountability, focuses the business on things that are important and creates a sense of urgency Planning & Performance Management Process Strategy , benchmark & 5 year plans Action Plans to close gap along with 1 year budget Integrate with Individual STI targets Monitor Performance Daily, Weekly, Monthly KPI Reporting Take Corrective Actions to close gaps Undertake Individual Performance Reviews  Sponsor: CFO  8 week timeframe  Facilitated by External Consultant  See example in Appendix 5 32
  • 33. Performance Gap “Deep Dives” Identify items that make up at least 90% of Gap Undertake “Deep Dives” for these items with “Best” Understand why, & develop plan for closure of gap Reviewed & Signed off by CFO  Sponsor: CFO  8 week timeframe  Facilitated by  See example “Deep Dive” in Appendix 6 Objective: Turn “Theoretical Gap” into confirmed opportunities with management commitment and detailed hard action plans 33
  • 34. Synthesize Story & Syndicate Objective: Ensure everyone in the business can see the prize or precipice so they understand why we have to change 34  Sponsor: CEO  1 week timeframe  Facilitated by CEO & ELT
  • 36. 7 Example – Stage B Simple Value Driver Model Revenue p/t. Raw Material costs per Input Tonne. % Yield. Raw Material costs p/t Distribution Out costs p/t. Material Spread p/t Electricity cost per kwh. # Kwh p/t. Electricity cost p/t Gas cost per MBTU. MBTU p/t. Gas cost p/t Commissions/Royalties. Packaging. Consumables. Environmental. Other. Other Variable Costs p/t Variable Margin p/t Line Speed - Lineal MPM. Mix - M2 per tonne. Scheduled & Unscheduled Maint.. Production Capacity Forecast 5 year CAGR%.% Capacity Utilisation Capacity Constrained YOY % Growth.Market Size % Marketshare . Demand Constrained Prime Tonnes Despatched Variable Contribution # Employees. Payroll & Oncosts per employee. Payroll & Oncosts Motor Vehicles. Coms & Computers. Travel & Entertainment. Marketing & Growth costs. Repairs & Maint. Premises cost. Consultants. Other. Fixed Overhead Life.Depreciation Abnormals. EBIT * The value driver modeling was a technique I learnt from Neil Sylvester (now Partner in PIP) when he was engaged by Boral in the 1990s. 36 APPENDIX 1 EXA M PLE EXA M PLE DAILY (Email Template) Good News - Wins MTI, LTI, Enviro Incident, Fraud Incid Resignations - Key Management Bad News Despatches Unit Volume - Yesterday Unit Volume - MTD % of Mth Fcst Margin % - Act & Mth Fcst Orders Received Unit Volume - % of Mth Fcst Margin % - Act & Mth Fcst Cashflow - Act & Mth Fcst Cash Position WEEKLY KPIs. (Email Template) Act Cashflow v 1 week Fcst Fcst Cashflow Next Week Act Sales Rev v 1 week Fcst Fcst Sales Rev Next Week Interco Payables Overdue % Receivables Overdue % Inventory Over 30 days Inventory - % of Mth Fcst DIFOT % - Act & Mth Fcst MONTHLY ELT REVIEW AGENDA Minutes of Last Meeting Traffic Light Summary OHS&E C.S. - DIFOT % & Lead Time Days PEOPLE - Behavioural Change Agenda EBIT - Variance Analysis Volume - Pipeline & Market Margin Spread Selling Price Variable Costs Costs & Efficiencies Manufacturing Logistics S & M Admin & Other REVENUE - Variance Analysis CASHFLOW - Variance Analysis WC Inventories Receivables & Payables Capex & Disposals Project Progress Update Risks & Opportunities Agreed Actions & Checkout ONE HOUR ALERT (Phone Call) LTI Environment Issue Fraud Reporting / KPI pipeline – Daily, Weekly, Monthly
  • 38. EXAMPLES OF EBIT IMPROVEMENT PROCESS 8 Example – Stage D - Benchmark Gap analysis Column indented Item Names NZ & PI NSW QLD VIC & TAS BEST NZ & PI NSW QLD VIC & TAS NZ & PI NSW QLD VIC & TAS NZ & PI NSW QLD VIC & TAS ROC% 4% -3% 7% 7% 17% 16% 14% 24% Assets Employeed 195 125 123 152 4.0 150 101 101 100 Fixed Assets 150 100 100 100 150 100 100 100 Working Capital 38 20 19 47 0.0 (43) (23) (22) (51) (4) (3) (3) (4) Working Capital Days 90 60 60 110 (10) (10) (10) (10) (10) Inventory 25.6 9.9 12.8 25.6 0.0 13 0 3 13 12.8 10.7 9.6 12.8 Inventory Days 60 30 40 60 30 30 0 10 30 30 30 30 30 Receivables 21.4 16.4 12.8 29.9 0.0 13 10 6 21 8.5 7.1 6.4 8.5 Receivable Days 50 50 40 70 20 30 30 20 50 20 20 20 20 Payables 8.5 6.6 6.4 8.5 0.0 (17) (13) (13) (17) 25.6 21.4 19.2 25.6 Payable Days 20 20 20 20 60 (40) (40) (40) (40) 60 60 60 60 Other 7.0 5.0 4.0 5.0 4.0 (3) (1) 0 (1) 4 4 4 4 EBIT 8.3 (3.5) 9.0 10.9 (1.0) (17.5) (20.2) (6.5) (12.9) 25.4 16.2 14.6 23.8 Variable Contribution 33.9 22.6 29.6 39.9 0.0 43.4 36.2 32.6 43.4 Variable Margin p/t 282 226 328 333 362 (79.6) (136.0) (33.4) (29.1) (9.9) (14.1) (3.9) (3.5) 362 362 362 362 Material Spread p/t 340 292 375 382 395 (55.1) (103.7) (20.1) (13.8) (7.0) (10.9) (2.7) (1.7) 395 395 395 395 Revenue p/t 1,300 1,200 1,300 1,300 1,300 0.0 (100.0) 0.0 0.0 0.0 (10.0) 0.0 0.0 1,300 1,300 1,300 1,300 Raw Material costs p/t 960 908 925 918 905 55.1 3.7 20.1 13.8 6.6 0.4 1.8 1.7 905 905 905 905 Raw Material costs per Input Tonne 950 900 920 900 900 50 0 20 0 6.0 0.0 1.8 0.0 900 900 900 900 % Yield 99.0% 99.1% 99.5% 98.0% 99.5% -0.5% -0.4% 0.0% -1.5% 0.6 0.4 0.0 1.7 99.5% 99.5% 99.5% 99.5% Distribution Out costs p/t 18.0 20.0 25.0 15.0 15.0 3 5 10 0 0.4 0.5 0.9 0.0 15.0 15.0 15.0 15.0 Other Variable Costs p/t 58.3 66.0 47.0 49.0 33.7 24.6 32.3 13.3 15.3 2.9 3.2 1.2 1.8 33.7 33.7 33.7 33.7 Electricity cost p/t 8.3 4.0 4.0 4.5 3.2 5.1 0.8 0.8 1.3 0.6 0.1 0.1 0.2 3.2 3.2 3.2 3.2 Electricity cost per kwh 0.15 0.10 0.08 0.10 0.08 0.07 0.02 0.00 0.02 0.08 0.08 0.08 0.08 # Kwh p/t 55.0 40.0 50.0 45.0 40.0 15 0 10 5 40.0 40.0 40.0 40.0 Gas cost p/t 20.0 21.0 9.0 12.5 7.5 12.5 13.5 1.5 5.0 1.5 1.4 0.1 0.6 7.5 7.5 7.5 7.5 Gas cost per MBTU 4.0 3.0 3.0 2.5 2.5 1.5 0.5 0.5 0.0 2.5 2.5 2.5 2.5 MBTU p/t 5.0 7.0 3.0 5.0 3.0 2.0 4.0 0.0 2.0 3.0 3.0 3.0 3.0 Commissions/Royalties 4.0 6.0 7.0 5.0 4.0 0.0 2.0 3.0 1.0 0.0 0.2 0.3 0.1 4.0 4.0 4.0 4.0 Packaging 8.0 15.0 12.0 10.0 8.0 0.0 7.0 4.0 2.0 0.0 0.7 0.4 0.2 8.0 8.0 8.0 8.0 Consumables 12.0 10.0 5.0 7.0 5.0 7.0 5.0 0.0 2.0 0.8 0.5 0.0 0.2 5.0 5.0 5.0 5.0 Environmental 3.0 5.0 5.0 5.0 3.0 0.0 2.0 2.0 2.0 0.0 0.2 0.2 0.2 3.0 3.0 3.0 3.0 Other 3.0 5.0 5.0 5.0 3.0 0.0 2.0 2.0 2.0 0.0 0.2 0.2 0.2 3.0 3.0 3.0 3.0 Prime Tonnes Despatched 120,000 100,000 90,000 120,000 120,000 100,000 90,000 120,000 Production Capacity 200,000 125,000 125,000 125,000 230,000 145,833 152,778 138,889 Line Speed - Lineal MPM 100 90 90 90 100 0 (10) (10) (10) 100 100 100 100 Mix - M2 per tonne 300 400 500 500 300 0 100 200 200 300 300 300 300 Scheduled & Unscheduled Maint. 20% 10% 15% 5% 5% 15% 5% 10% 0% 5% 5% 5% 5% % Capacity Utilisation 60% 80% 72% 96% 52% 69% 59% 86% Forecast 5 year CAGR% 3% 3% 5% 10% 3% 3% 5% 10% Fixed Overhead 17.6 20.1 15.6 24.0 6.6 5.1 2.6 9.4 11.0 15.0 13.0 14.6 Payroll & Oncosts 7.5 10.0 10.0 14.4 1.5 0.0 2.0 4.8 6.0 10.0 8.0 9.6 # Employees 500 400 500 600 400 100 0 100 200 400 400 400 400 Payroll & Oncosts per employee 15,000 25,000 20,000 24,000 15,000 25,000 20,000 24,000 15,000 25,000 20,000 24,000 Motor Vehicles 1.0 1.2 0.8 0.7 0.7 0.3 0.5 0.1 0.0 0.7 0.7 0.7 0.7 Coms & Computers 0.6 0.5 0.8 1.0 0.5 0.1 0.0 0.3 0.5 0.5 0.5 0.5 0.5 Travel & Entertainment 1.0 0.5 0.7 1.0 0.5 0.5 0.0 0.2 0.5 0.5 0.5 0.5 0.5 Marketing & Growth costs 4.0 3.0 2.0 3.0 2.0 2.0 1.0 0.0 1.0 2.0 2.0 2.0 2.0 Repairs & Maint 1.5 1.3 0.5 2.0 0.5 1.0 0.8 0.0 1.5 0.5 0.5 0.5 0.5 Premises cost 0.5 0.6 0.3 0.4 0.3 0.2 0.3 0.0 0.1 0.3 0.3 0.3 0.3 Consultants 1.0 2.0 0.3 1.0 0.3 0.7 1.7 0.0 0.7 0.3 0.3 0.3 0.3 Other 0.5 1.0 0.2 0.5 0.2 0.3 0.8 0.0 0.3 0.2 0.2 0.2 0.2 Depreciation 6.0 5.0 4.0 4.0 0.0 1.0 0.0 0.0 6.0 4.0 4.0 4.0 Life 25.0 20.0 25.0 25.0 25.0 0.0 (5.0) 0.0 0.0 25 25 25 25 Abnormals 2.0 1.0 1.0 1.0 1.0 1.0 0.0 0.0 0.0 1.0 1.0 1.0 1.0 2009 PotentialGAP TO BEST - KPI2009 Financials GAP TO BEST - $m 38 APPENDIX 3 EXA M PLE EXA M PLE
  • 39. MISSION VALUES COC & DOAVISION TARGETS REPORTING • Hourly Alert • Daily – KPIs • Weekly – Cash • Monthly – BPR • Qtrly – Forecasts • Annual – Budget • A • B • C • D • A • B • C • D SITE VISITS • CEO Business Reviews • CEO / CFO Major Capital Project Reviews • CFO Stewardship & Commercial Reviews • ELT Monthly Reviews • Board Meetings • External & Internal Audits ELT GOVERNANCE FRAMEWORK OTHER • “Whistle Blower” System • OHS & E Alert System • Weekly Telecons – Cash • COC & DOA Training Programs • Values / Leadership Training Program OCT • Forecast Review JUL • LY Review FEB • Capex & WC AUG • Behavioral Change MAR • Deep Dive Signoff SEP • OHS&E APR • Budget & Risk Review JAN • Strategy & Growth MAY • Stewardship & Internal Audit NOV • Benchmark JUN • People & KRAs DEC • CPP ELT MONTHLY ONE DAY REVIEWS SPECIAL AGENDA (DEEP DIVES) APPENDIX 4 39 EXA M PLE EXA M PLE
  • 40. 40 APPENDIX 5 KPI: Owner: Target % Change: Key Objective: EBIT Sensitivity 1% : Performance: Target EBIT Impact: Forecast % Change: Forecast EBIT Impact: 10 Increase Uptime from average of 70% in 2006 to 83% in 2007 YTD Uptime is 2% below BUD (10% higher than LY). Expect to finish the year 1% below BUD (12% higher than LY). YTD improvement is due to Uptime Project. Month – worse than forecast: Due to Bottom Dross removal. UPTIME % - MCL VP Manufacturing YTD Downtime % - Pareto AnalysisYTD Downtime % - Pareto Analysis STATUS COMMENTSSTATUSIMPACTWHOTOP 3 ACTIONS / PROJECTS TO DELIVER THIS QTR FORECASTREF. UML3 UML2 UML1 On-trackMCL MgrBottom Dross Issue: Manage bottom dross growth until main pot replacement, by consistency of schedule cleaning and implement of dross grab to removed mushy dross. On-trackMCL MgrProcedure: Implement Reliability Workshop action plans DoneMCL MgrEquipment: Replace MCL Welder control to give consistency of welding quality On-trackMaint MgrJul’07Review potential local vendor for pot replacement.UML7 UML8 STATUS COMMENTSSTATUSIMPACTWHOWHENTOP 5 ACTIONS / PROJECTS TO IMPACT BEYOND THIS QTRREF. On-trackMaint MgrOct’07Equipment : Placing PO and commitment for main pot replacement project.UML6 InitiatedMCL Manager Dec ’07Standardization process map resin areaUML5 UML4 InitiatedVP MfgOct ‘07Bottom dross issue: Ensure new pot design is capable of minimizing dross build-up Trend – MonthTrend – MonthPerformancePerformance 13% US$0.3m * US$3.9m 12% US$3.6m EXA M PLE EXA M PLE MONTHLY KPI REPORT – Situation, Reason, Action
  • 41. EXAMPLES OF EBIT IMPROVEMENT PROCESS 9 Example - E - Deep Dive Summary on Material Benchmark Gap for Packaging cost per tonne SBU - NSW • Implementation Leader – Joe Brown (NSW Packaging Mgr) • ARITHMETIC BENCHMARK GAP TO BE ANALYSED = A$700k  Cost per Tonne = A$15 , Best A$8 ( SBU NZ )  Annual Tonnes despatched by Company NSW = 100,000 , therefore A$7 p/t gap = A$700,000 p.a.  Key reasons  Different material type of packaging – impact A$200k p.a.  Outsourcing used by NSW but in-house by NZ – impact A$400k p.a.  Different labor rates between countries that two businesses operate – impact A$100k. The labor rate difference cannot be closed as it reflects different market rates between the two countries..but will attempt to recover it in the selling price to the customer (see spread analysis)  Risks – Ensure NSW customers will accept NZ packaging  Therefore Agreed Gap for targeted closure – A$600k  Target implementation completion – Week 45 41 APPENDIX 6 EXA M PLE EXA M PLE