Download to read offline
![International Research Journal of Engineering and Technology (IRJET) e-ISSN: 2395-0056
Volume: 05 Issue: 06 | June-2018 www.irjet.net p-ISSN: 2395-0072
© 2018, IRJET | Impact Factor value: 6.171 | ISO 9001:2008 Certified Journal | Page 1130
RELIABILITY ANALYSIS OF CFST COLUMNS BY USING FORM AND LATIN
HYPERCUBE METHOD
Prakruthi 1, Khalid Nayaz Khan2, N.S.Kumar3
1Final Year Student, Department of Civil Engineering, Ghousia college of Engineering, Karnataka, India
2Associate Professor, Department of Civil Engineering, Ghousia college of Engineering, Karnataka, India
3Professor and Director (R&D-Civil Engineering), Department of Civil Engineering, Ghousia college of Engineering,
Karnataka, India
---------------------------------------------------------------------***---------------------------------------------------------------------
Abstract- This thesis focus to study the behavior of axially
loaded concrete filled steel tube (CFST) segments under
monotonic loading by utilizing the finite element software
ANSYS. Modeling exactness is built up by using outcomes
obtained from BS 5400, Eurocode 4 and AS 3600 codes. It is
inferred that various parameters haveconsiderable impact on
the behavior of concrete filled steel columns, the prime
variables are cross sectional area, thickness, and diameter of
steel tube etc.., Most of the Researches on concrete filled steel
tube is limited to deterministic approach yet in this thesis it
also includes the reliability analysis of concrete filled steel
tubes using First Order Reliability method and Latin
Hypercube method utilizing 2R rel software.
KeyWords: CFST, ANSYS, Reliability, FORM, Latin
Hypercube, 2R rel
1. INTRODUCTION
Nowadays, the composite components are very much
effectively used in tall Buildings, Bridges and other various
types of structures because CFST columns have several
advantages over the conventional reinforced concrete and
structural steel columns. The first one is the concrete infill is
confined by the steel tube.
The second one is concrete infill delays local buckling of the
steel tube. And finally the combined capacity of the steel and
concrete significantly increases the stiffness and ultimate
strength of CFST columns which makes them very suitable
for columns and other compressive members. Finally, the
steel tube serves as longitudinal reinforcement and
permanent formwork for the concrete core.
1.1 CONCEPT OF RELIABILITY
Reliability is the ability to meet specific requirements under
a specified period. Structural reliability of thesystemcannot
be find through failure rates because
the structure are unique in nature
structure fails due to loads exceeding the
residual strength.
Therefore structural reliability models are built for
Resistance R and loads S independently and then structural
reliability is evaluated through probability of failure.
That is, Probability of failure, Pf = P(R-S< 0)
Reliability = 1-pf
First order reliability method(FORM)
FORM was first developed by Hosfer st al (1974). It is fit for
handling non linear performance function using Taylor
series. FORM utilizes only mean and standard deviation of
variables.
Therefore, limit state function is given by Z= R-S
If both R & S are assumed as normal random variables, then
Z can also be referred as a random variables.
that is (𝜇𝑅−𝜇𝑠,√𝜎𝑅2+𝜎𝑠2). Then probabilityoffailurecan be
defined as
pf = P(Z<0)
pf =Φ[0-(μR-μS) ]
pf=1− Φ [𝜇𝑅−𝜇𝑆/ ]
Φ is the CFD of the standard normal variant
Thus, the probability of failure is a function of the mean
value of Z to its standard deviation.
𝛽 =𝜇𝑅−𝜇𝑆/(μR-μS) ]
The probability of failure can be expressed in terms of the
safety index as follows.
pf= Φ (−𝛽)=1−𝜑(𝛽)
Latin hypercube method (LHM)
To increase the efficiency of monte carlo simulation
technique, a new sampling method is introduce called Latin
hypercube sampling. Latin hypercube sampling utilizes the
stratified sampling scheme to improve the coverage ofinput
space.
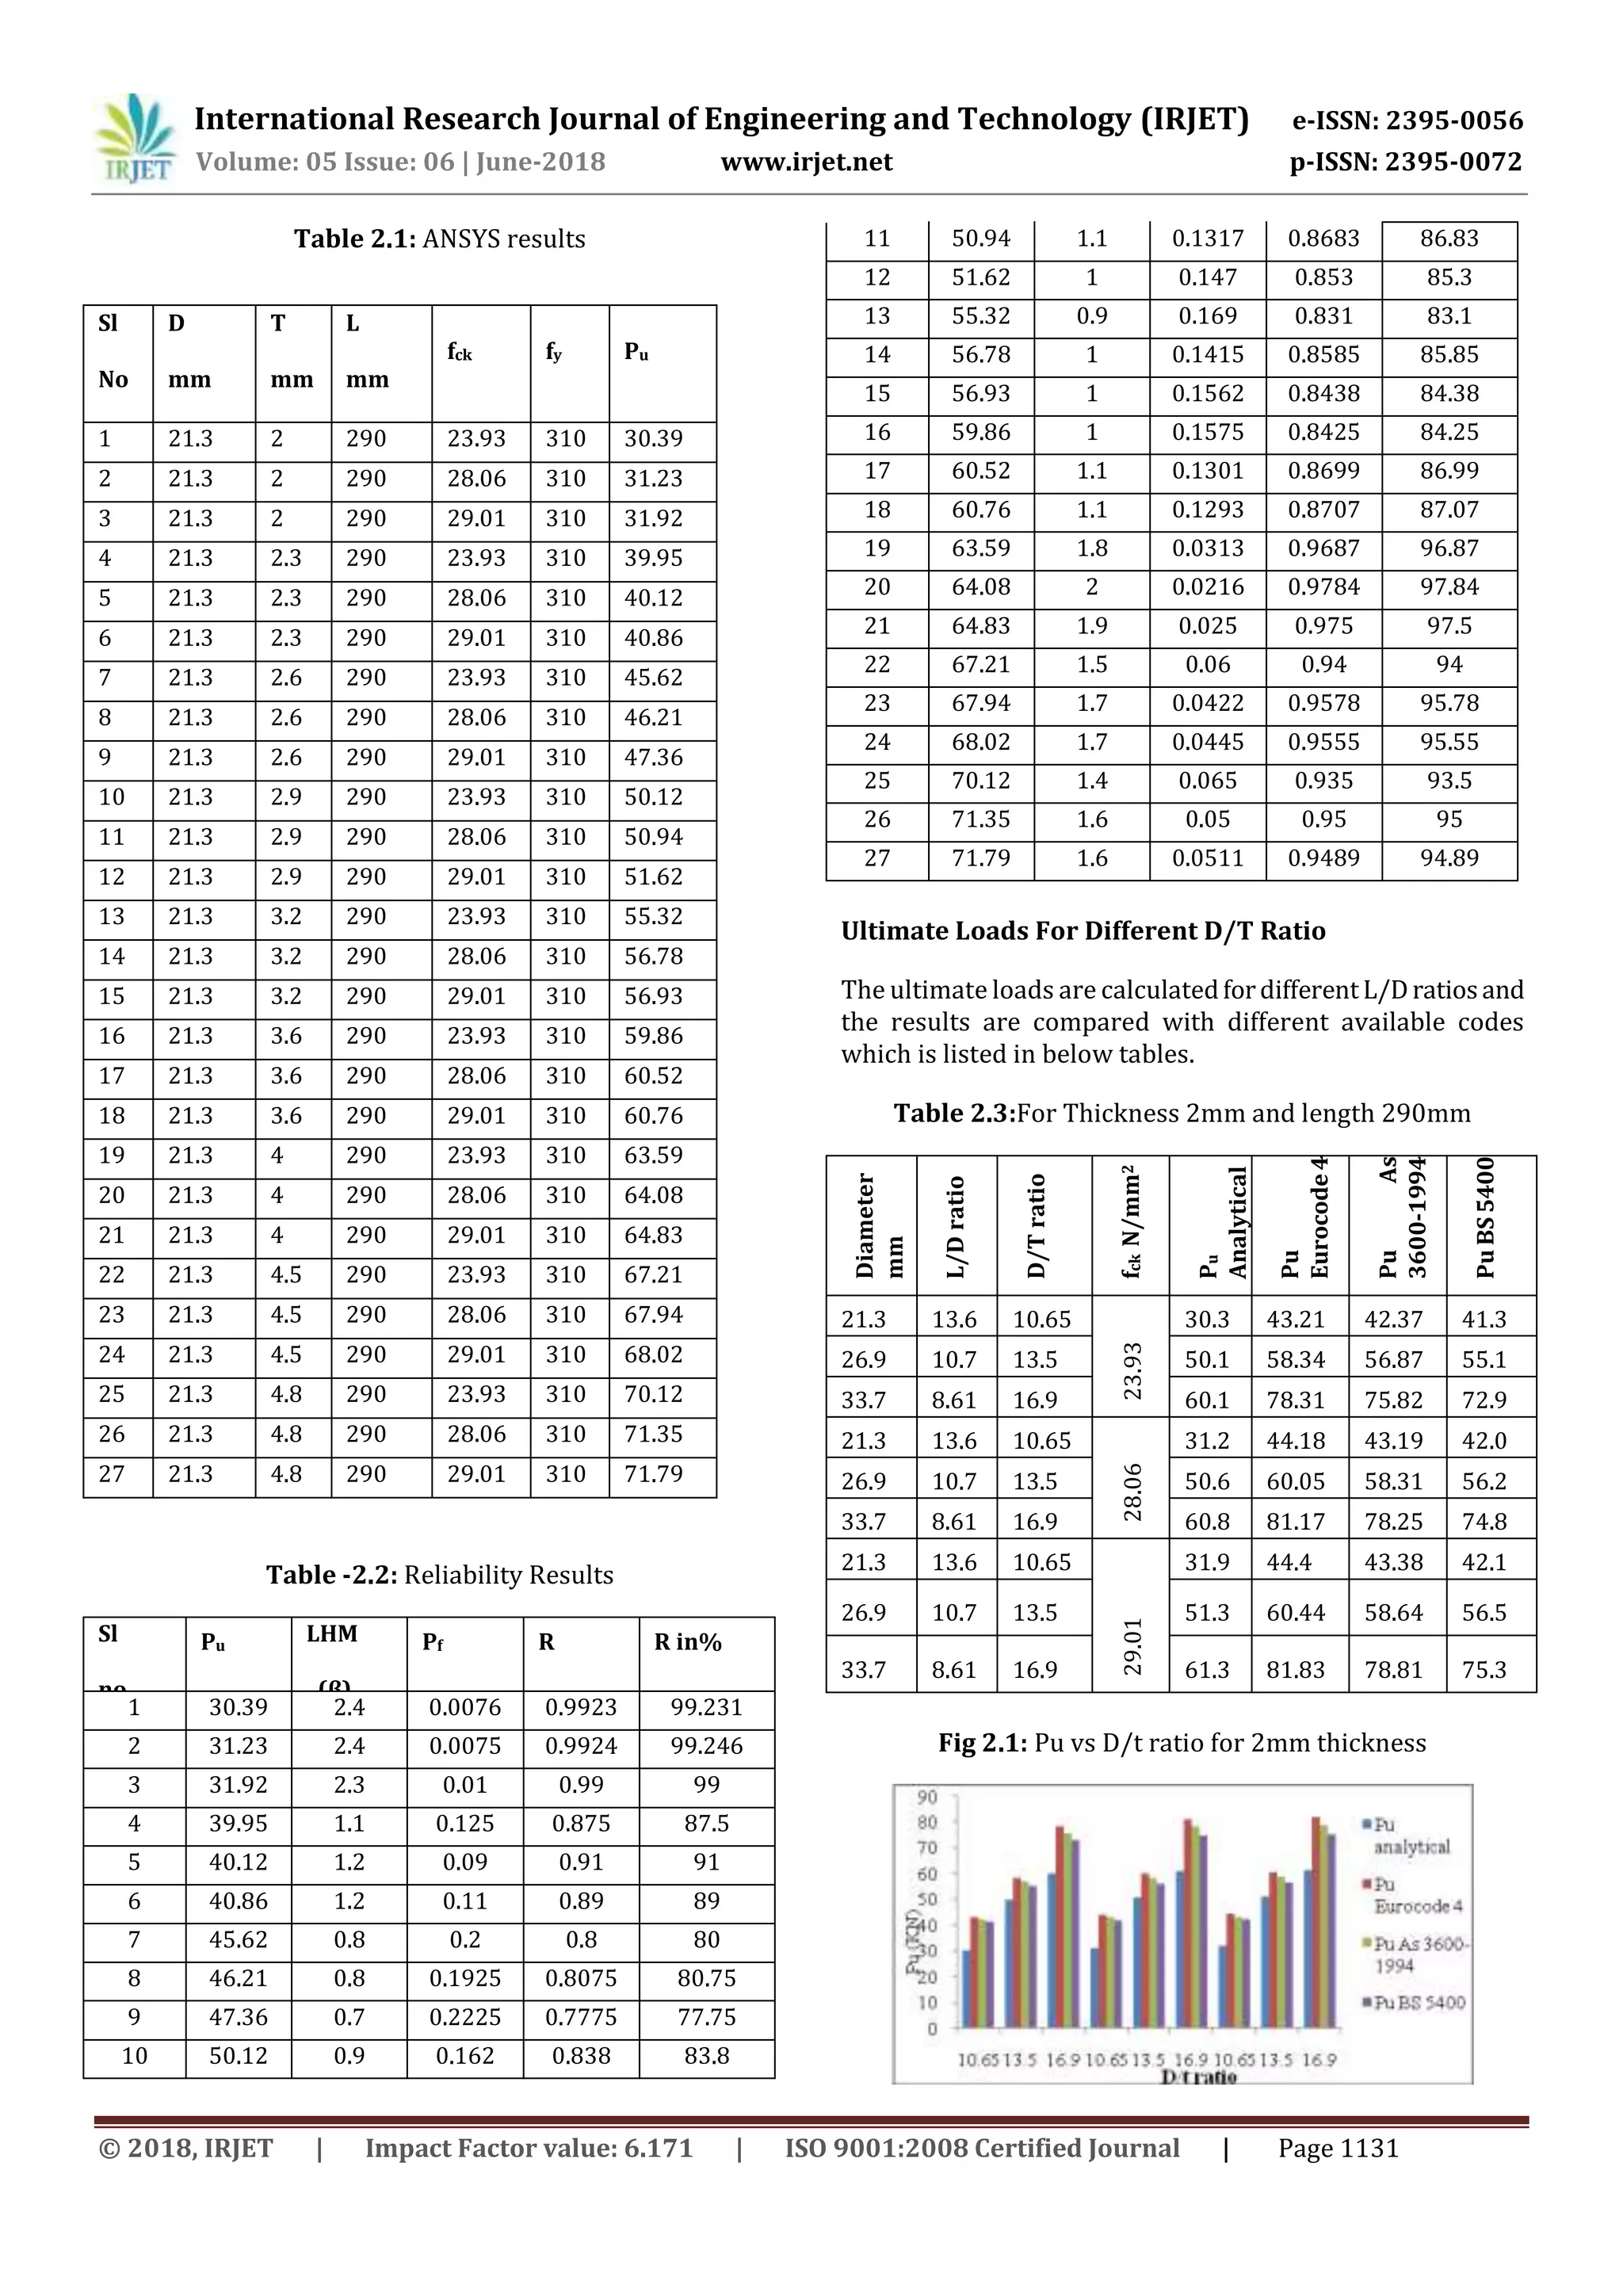
2. EXPERIMENTAL RESULTS
The ultimate loads are calculated by using ANSYS software
which are shown below table i.e. Table:2.1](https://image.slidesharecdn.com/irjet-v5i6211-180801064739/75/IRJET-Reliability-Analysis-of-CFST-Columns-by-using-Form-and-Latin-Hypercube-Method-1-2048.jpg)
![International Research Journal of Engineering and Technology (IRJET) e-ISSN: 2395-0056
Volume: 05 Issue: 06 | June-2018 www.irjet.net p-ISSN: 2395-0072
© 2018, IRJET | Impact Factor value: 6.171 | ISO 9001:2008 Certified Journal | Page 1135
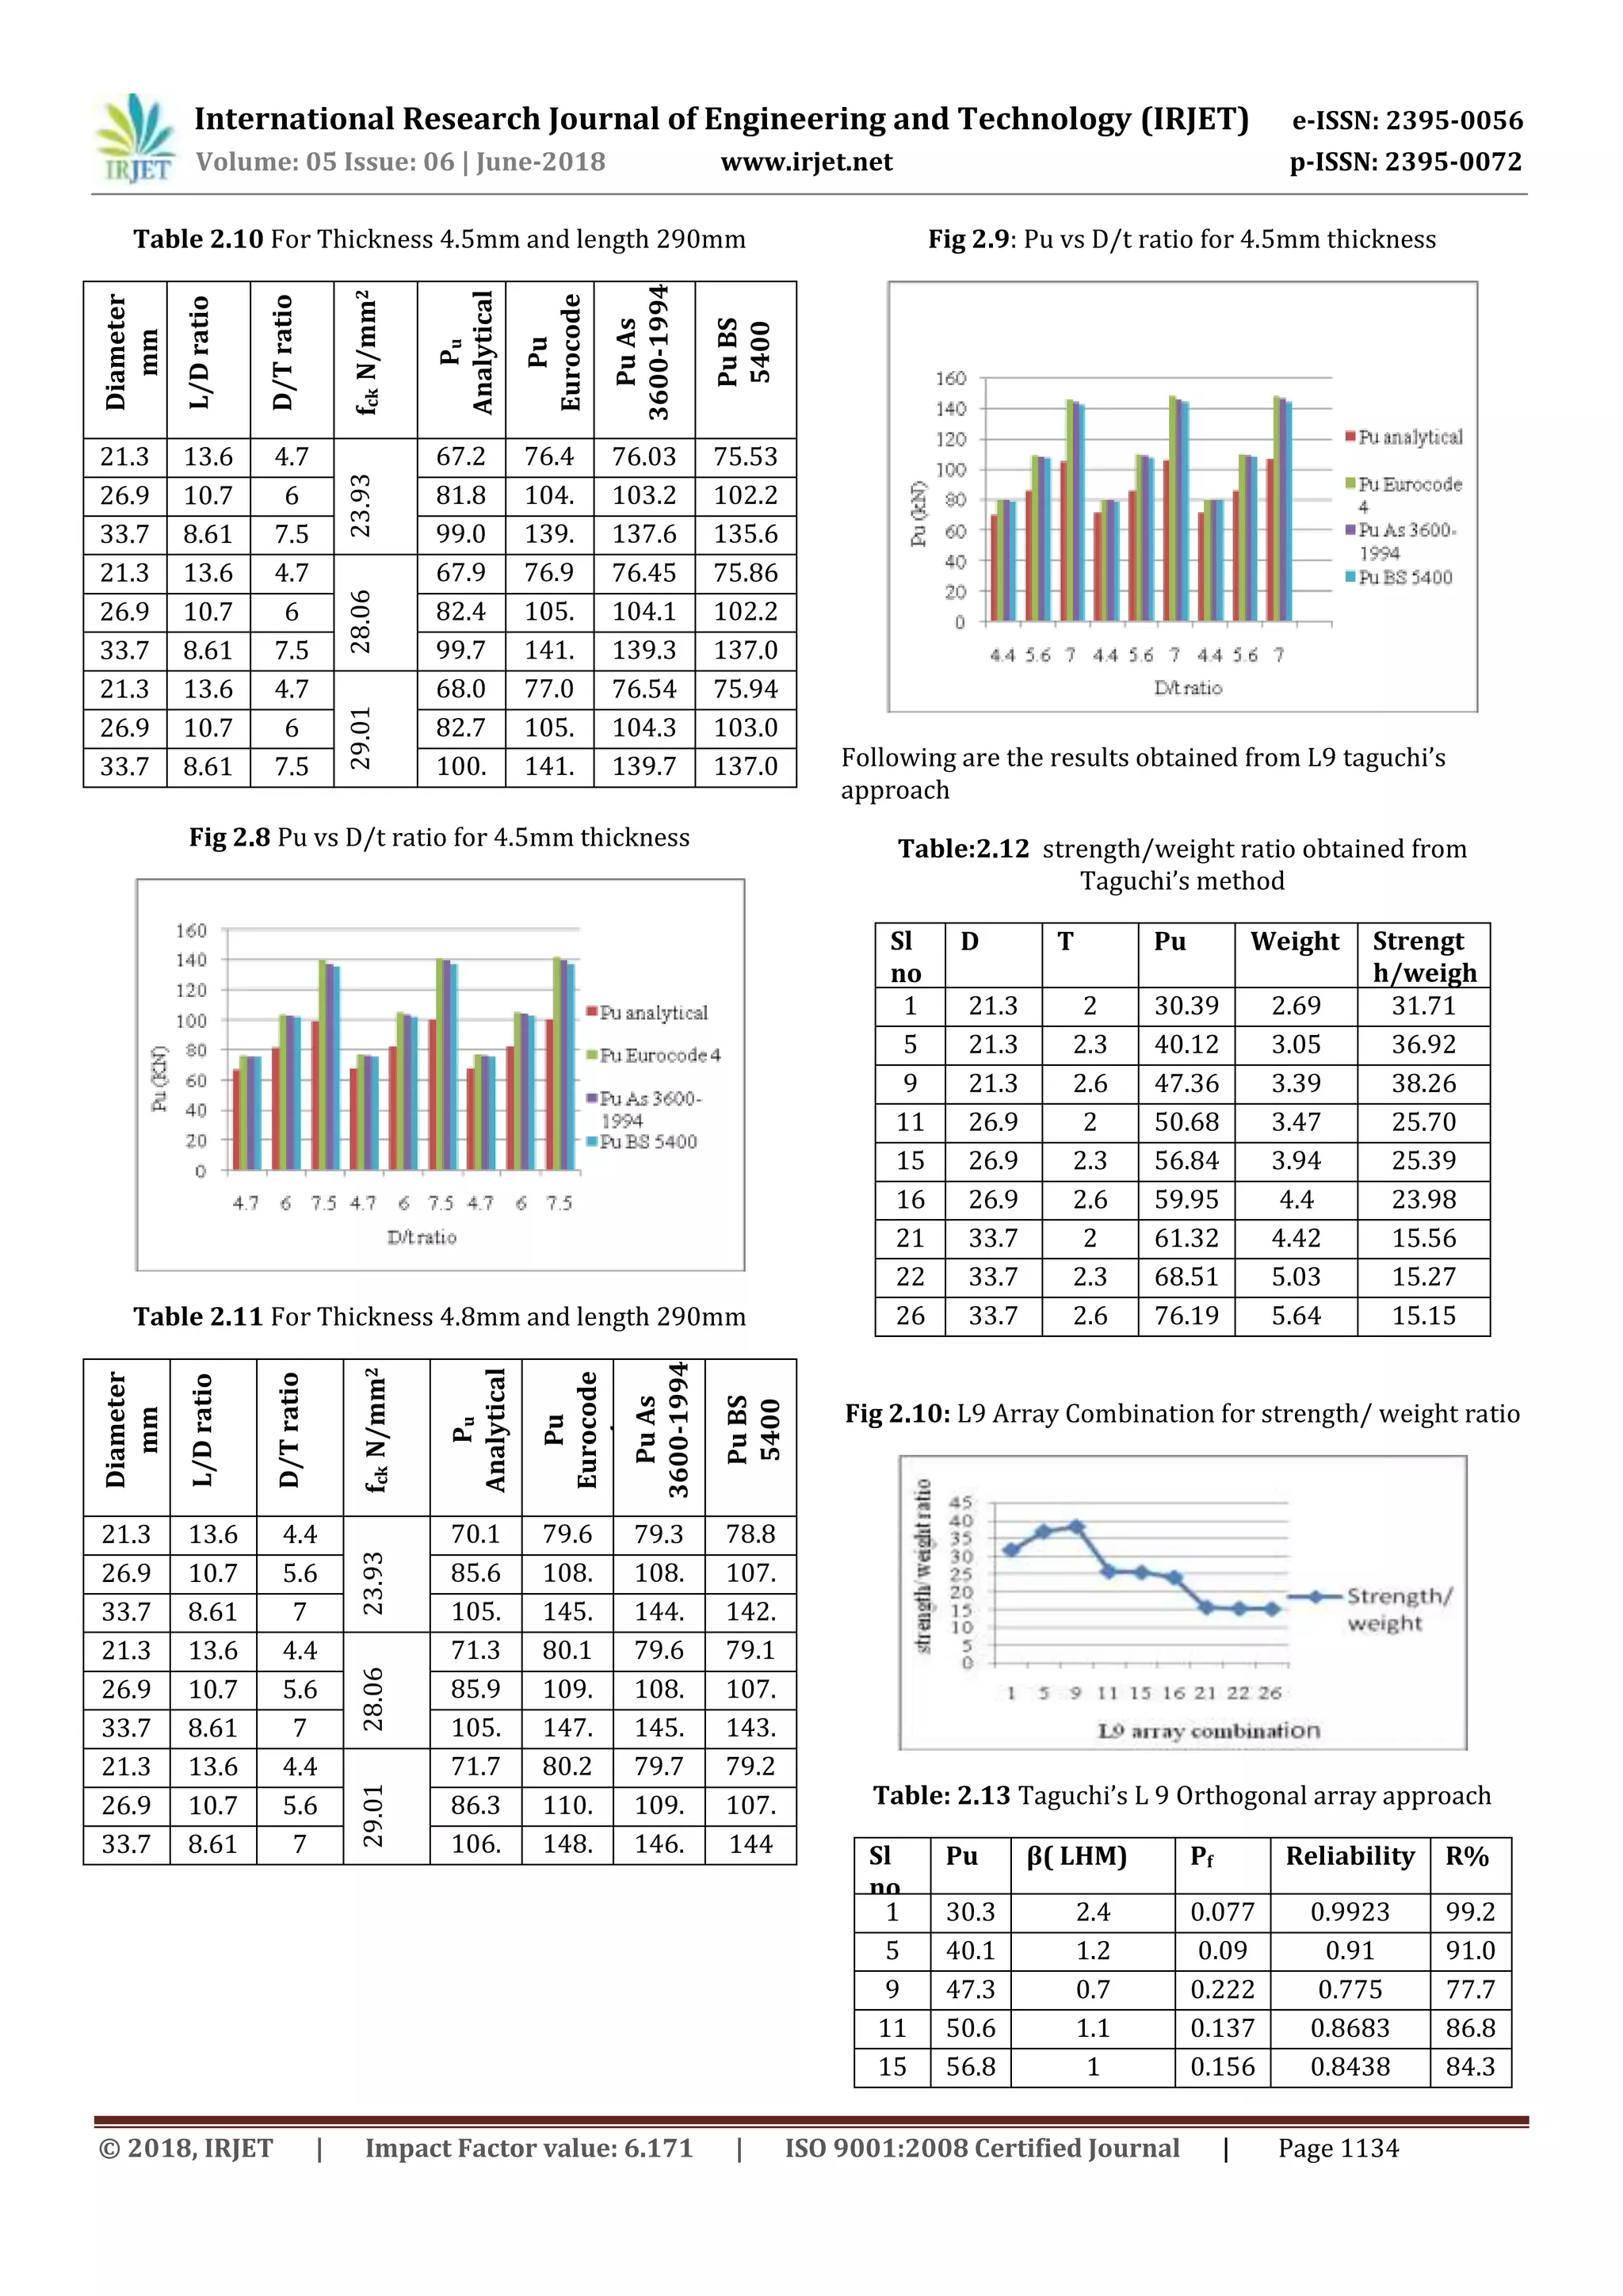
16 59.9 1 0.157 0.8425 84.2
21 61.3 1.9 0.025 0.9750 97.5
22 68.5 1.5 0.06 0.94 94
26 76.1 1.6 0.05 0.95 95
Fig: 2.11Taguchi’s method vs Reliability
3. Conclusion
[1] The ultimate load Pu obtained from ANSYS result
shows that the ultimate load carrying capacity of
CFST tubes increases with increase in thickness.
[2] The ANSYS results shows that the ultimate load
carrying capacity of CFST columns increases with
decrease in D/t ratio.
[3] Ultimate load Pu obtained from ANSYS and various
codes like Eurocode, BS 5400 and AC3600-1999
shows that Pu obtained from ANSYS is higher than
the Pu obtained from codes.
[4] It is observed that as the L/D ratio decreases,
ultimate load Pu increases.
[5] The Reliability of member decreases with increases
in diameter.
[6] Maximum strength/ weight ratio is obtained for
model 9 having diameter 21.3mm and thickness
2.6mm.
[7] Maximum reliability of 99.23 % is obtained for
model 1 having diameter 21.3mm & thickness 2mm
4. References
[1] Structural Reliability Methods (2005) by O. Dittevsen
and H.O Madsen.
[2] Naveen Kumar S, Khalid Nayaz Khan and Dr N.S.
Kumar(2017) “Reliability analysis of concrete filled steel
Tube columns by FOSM & Subset simulation Technique”
Mtech dissertation 2017
[3] Reliability Analysis of composite columns a dissertation
by Pankaj Kumar Department of civil engineering IIT
Roorke(2002)
[4] Finite Element Analysis Theory and application with
ANSYS by Saeed Moaveni, Minnesoter state university
Mankato.
[5]Reliability Analysis for Structural design (2009) by
Milan Holicky.
[6] Syed Aqeeb Javeed Pasha, Khalid Nayaz Khan and Dr
N.S.Kumar “Reliability analysis (FORM level-1 method)
of concrete filled steel tube columns using NASTRAN
Software Mtech dissertation 2016.
Biographies
Graduated in the year 2016 from
VTU, Belgaum. Presently perusing
Master of Technology in Structural
Engineering at Ghousia College of
Engineering, Ramanagaram Also
working on this topic for the
dissertation under the guidance of
Khalid Nayaz khan and Dr. N S
Kumar.
Associate Professor Dept. of Civil
Engineering GCE, Ramanagaram
562159. He has a teaching
experience of 32 years. Has
published about 13 papers in
various journals.
Involved in the Research field
related to behavior of Composite
Steel Column since a decade.
Presently guiding 6 Ph.D Scholars
(Research under VTU, Belgaum).
Has more than 29 years of
teaching experience &6 years of
Research experience at Ghousia
College of Engineering,
Ramanagaram.
2nd
Author
Photo
3rd
Author
Photo
1’st
Author
Photo](https://image.slidesharecdn.com/irjet-v5i6211-180801064739/75/IRJET-Reliability-Analysis-of-CFST-Columns-by-using-Form-and-Latin-Hypercube-Method-6-2048.jpg)

This document summarizes a study on the reliability analysis of concrete filled steel tube (CFST) columns using the First Order Reliability Method (FORM) and Latin Hypercube Method (LHM). Finite element analysis was performed using ANSYS to determine ultimate loads for CFST columns with varying diameters, thicknesses, and length-to-diameter ratios. Reliability indices (β) and probabilities of failure were then calculated using the LHM in 2R rel software. The results show that increasing the steel tube thickness and decreasing the diameter-to-thickness ratio increases the ultimate load capacity and reliability of the CFST columns.


![[IJET V2I3P8] Authors: Pravin B. Sonawane, P.G.Damle](https://cdn.slidesharecdn.com/ss_thumbnails/ijet-v2i3p8-160609052616-thumbnail.jpg?width=640&height=640&fit=bounds)


