Download to read offline
![International Research Journal of Engineering and Technology (IRJET) e-ISSN: 2395-0056
Volume: 06 Issue: 05 | May 2019 www.irjet.net p-ISSN: 2395-0072
© 2019, IRJET | Impact Factor value: 7.211 | ISO 9001:2008 Certified Journal | Page 6004
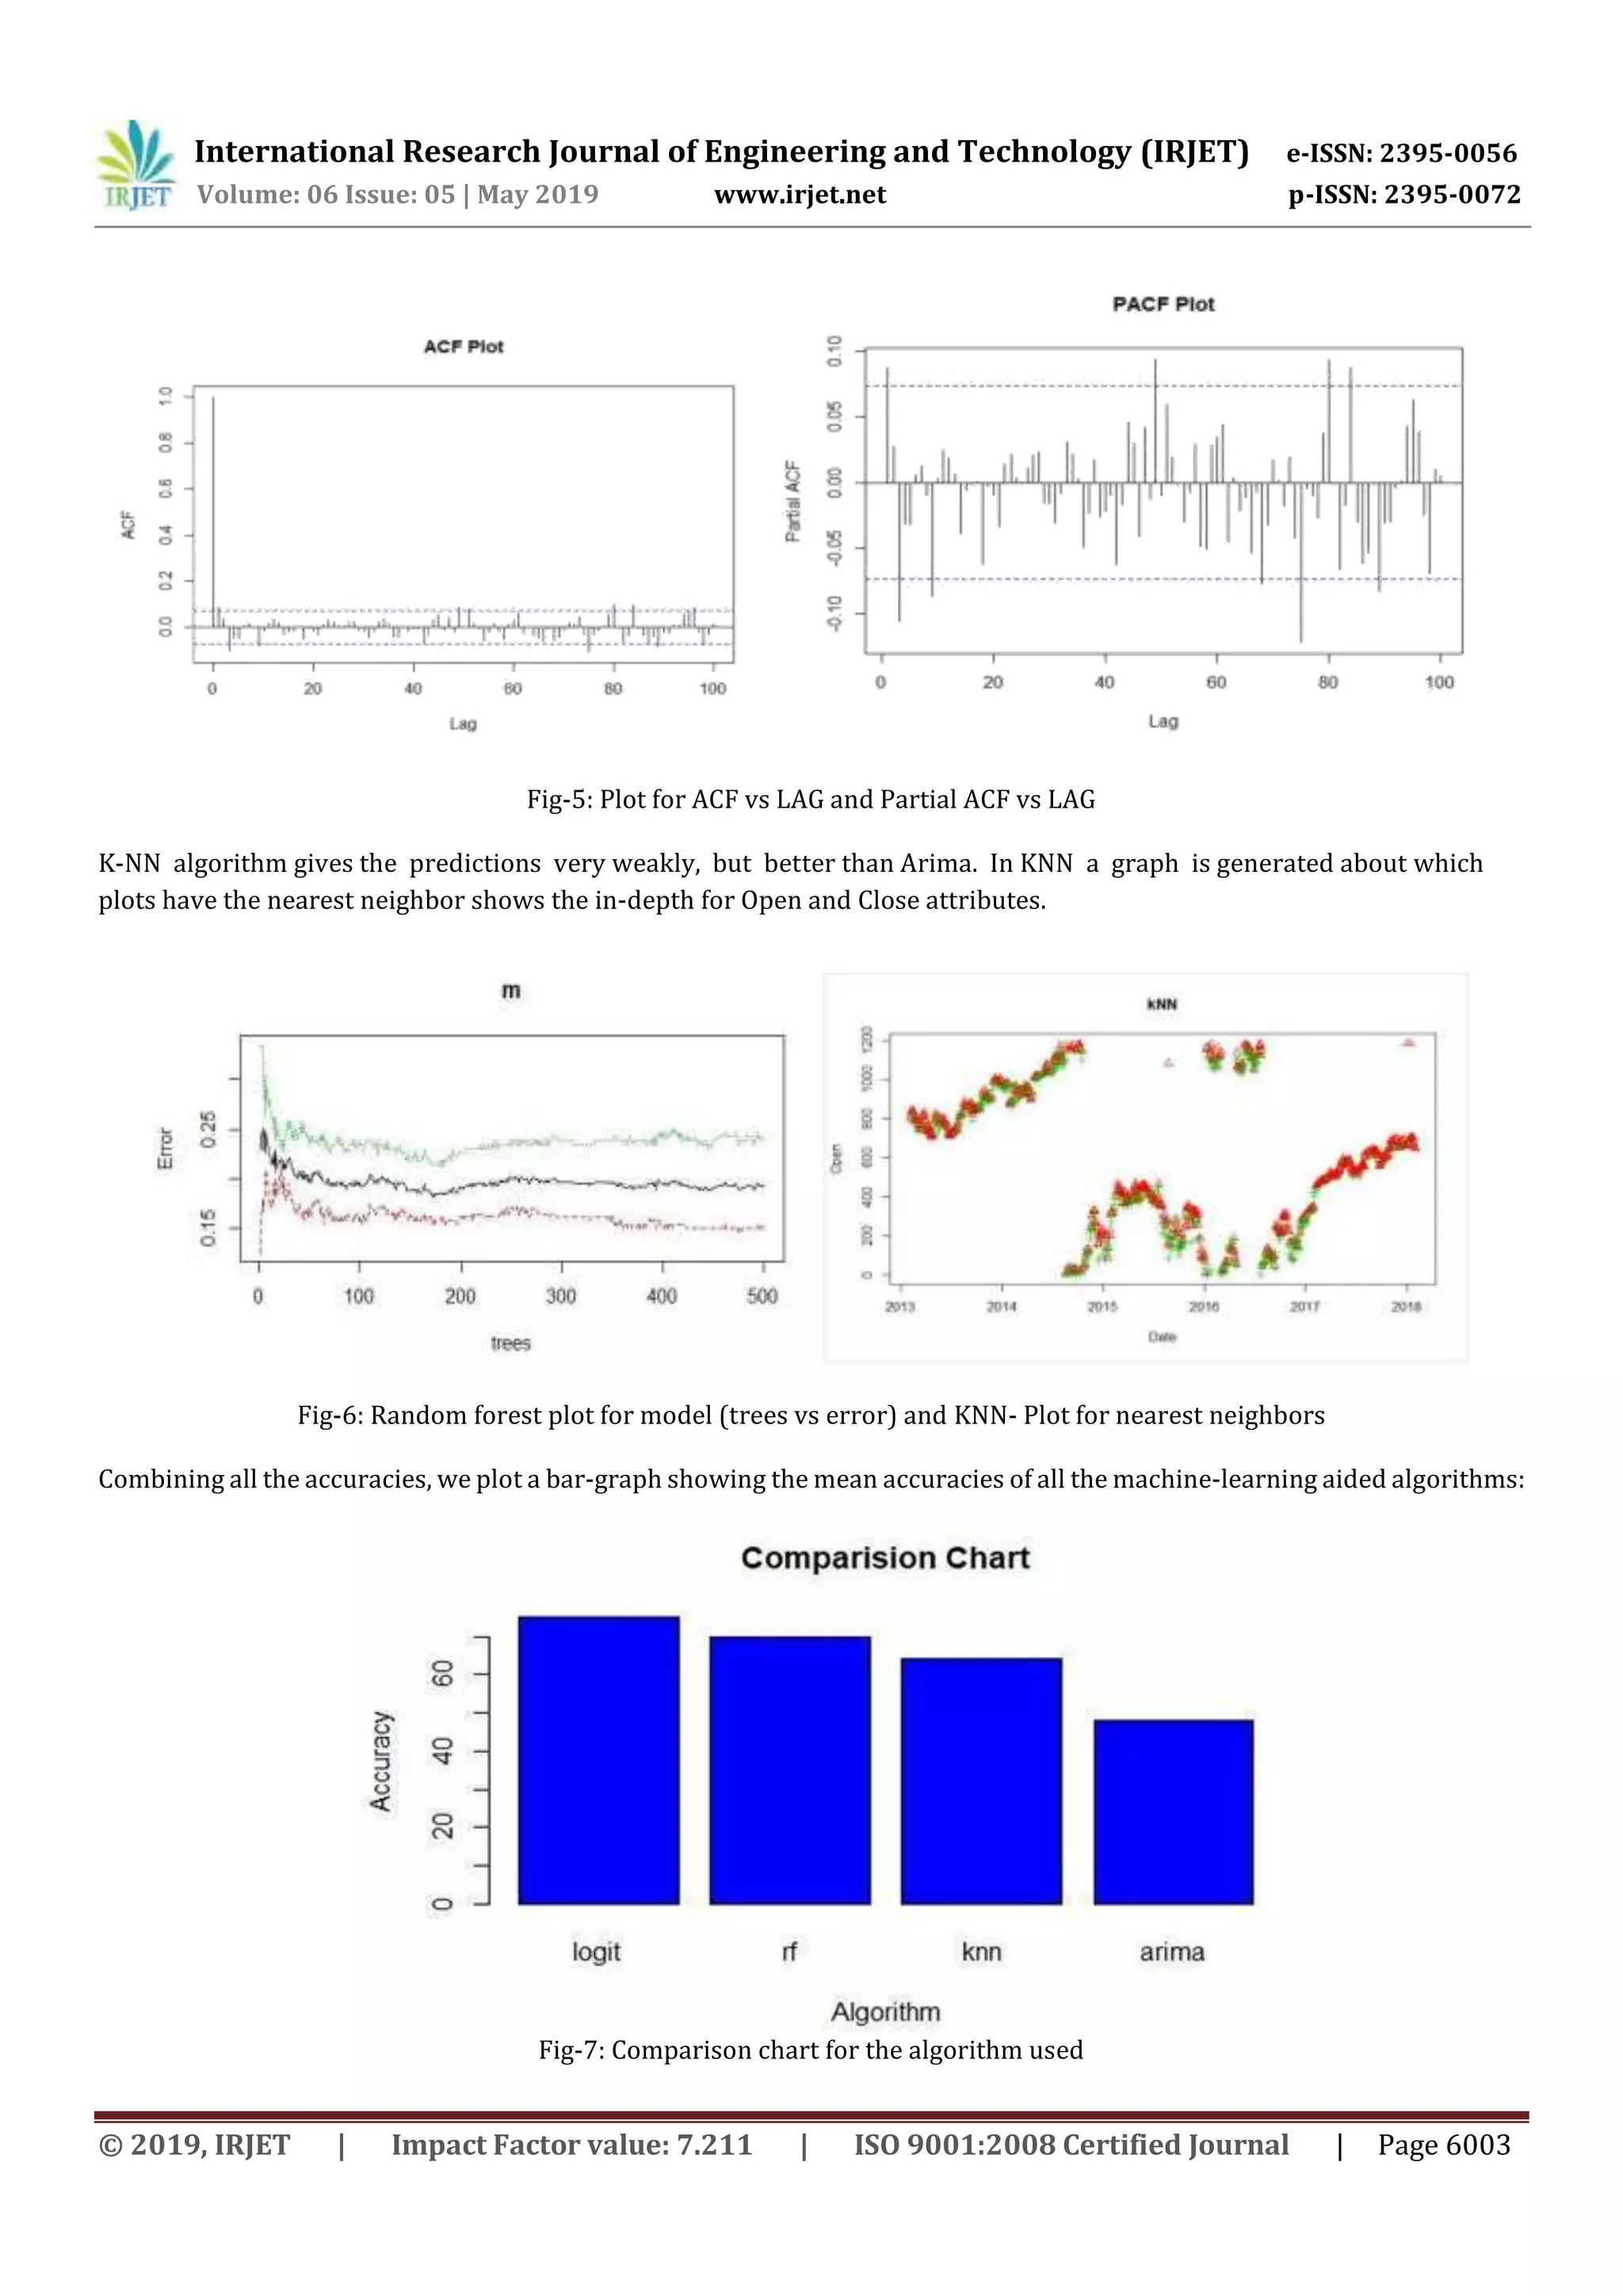
The bar plot shows that the Logistic Regression with 74% accuracy performs the best when compared to other techniques
which are implemented. Then comes Random Forest algorithm with 70.1% accuracy, then we have KNN 64% with andthe
last comes ARIMA in terms of Accuracy.
7. CONCLUSIONS
In the above paper, we inspected advancements in economic marketpredictions.Bylookingat differentpredictive models, we
discovered that Logistic-regression is offering the capacity to predict and analyzing market movement direction more
precisely than the other existing methods. Differentmodels,forexample,RandomForestandARIMAhaveadditionallyturned
out to be well known in stock market prediction. Random Forest demonstrated its fruitful application in classification
work, ARIMA on time series prediction and financial related applications. K-NN model is also applied in the experiment
which also show some good results in predicting stock market directions.
This shows that it can be conceivable to utilize Logistic-Regression as an effective approach to successfully predict the
future pattern of stock cost. Highlight Index Variables are creative and significant to the approach so proposed. Theyarejust
not simple to both comprehend for the private speculator and acquire from every day stock exchanging data, yet in addition
improve our approach perform than or equivalent to different strategies, e.g. Random- Forest and ARIMA Prediction Model
under similar states of Featured-Index Variables.
This method of choosing enhancing gathering of regression-coefficient enhances predicting accuracy to 74% which is quite
high. The approach so proposed is very low in unpredictability and straight forward or figure it out. Because of utilization
current month to month exchanging data, noteworthy time-viability and soli deliberateness empower clients foresee stock
value pattern of straightaway month simply through considering current month to month monetary information as
opposed to requiring a long haul system of examining furthermore, gathering budgetary information. In any case, one
deformity still exists in our approach looking at that as some component file factors come up short on account of little esteem
(surmised to zero) of this parameter. This is critical to assist examinations of Logistic-Regression representation for stocks in
value incline. Also, there exists the circumstance that element file factors flop in some case, we will think about how to choose
compelling factors to enhance prediction accuracy of stock value incline.
REFERENCES:
[1] C. N. Babu and B. E. Reddy, “Selected Indian stock predictions using a hybrid ARIMA-GARCH model,” 2014 Int. Conf. Adv.
Electron. Comput. Commun. ICAECC 2014, 2015.
[2] M. D. Shubhrata, D. Kaveri, T. Pranit, and S. Bhavana, “Stock Market Prediction and Analysis Using Naïve Bayes,” Int. J.
Recent Innov. Trends Comput. Commun., vol. 4, no.11, pp. 121–124, 2016.
[3] X. Ding, Y. Zhang, T. Liu, and J. Duan, “Deep Learning for Event-Driven Stock Prediction,” no. Ijcai, pp. 2327–2333, 2015.
[4] K. A. Smith and J. N. D. Gupta, “Neural networks in business: Techniques and applications for the operations
researcher,” Comput. Oper. Res., vol. 27, no. 11–12, pp.1023–1044, 2000.
[5] M. S. Babu, N. Geethanjali, and P. B. Satyanarayana, “Clustering Approach to Stock Market Prediction,” vol. 1291, pp. 1281–
1291, 2012.
[6] A. A, Adebiyi, A. K, Charles, A. O, Marion, and O. O, Sunday, “Stock Price Prediction using Neural Network with Hybridized
Market Indicators,” J. Emerg. Trends Comput. Inf. Sci., vol. 3, no. 1, pp. 1–9, 2012.
[7] S. Kayode, “Stock Trend Prediction Using Regression Analysis – A Data Mining Approach,” ARPN J. Syst. Softw., vol. 1, no. 4,
pp. 154–157, 2011.
[8] A. Sharma, D. Bhuriya, and U. Singh, “Survey of Stock Market Prediction Using Machine Learning Approach,” pp. 506–509,
2017.
[9] H. L. Siew and M. J. Nordin, “Regression techniques for the predictionofstock pricetrend,”ICSSBE2012 -Proceedings,2012
Int. Conf. Stat. Sci. Bus. Eng. "Empowering Decis. Mak. with Stat. Sci., pp. 99–103, 2012.](https://image.slidesharecdn.com/irjet-v6i5817-191010085640/75/IRJET-Prediction-of-Stock-Market-using-Machine-Learning-Algorithms-11-2048.jpg)
![International Research Journal of Engineering and Technology (IRJET) e-ISSN: 2395-0056
Volume: 06 Issue: 05 | May 2019 www.irjet.net p-ISSN: 2395-0072
© 2019, IRJET | Impact Factor value: 7.211 | ISO 9001:2008 Certified Journal | Page 6005
[10] B. Sivakumar and K. Srilatha, “A novel method to segment blood vessels and optic disc in the fundusretinal images,”Res.J.
Pharm. Biol. Chem. Sci., vol. 7, no. 3, pp. 365–373, 2016.
[11] M. P. Mali, H. Karchalkar, A. Jain, A. Singh, and V. Kumar, “Open Price Prediction of Stock Market using Regression
Analysis,” Ijarcce, vol. 6, no. 5, pp. 418–421, 2017.
[12] L. Khaidem, S. Saha, and S. R. Dey, “Predicting the direction of stock market prices using randomforest,”vol.0,no.0,pp.1–
20, 2016.
[13] T. Manojlović and I. Štajduhar, “Predicting stock market trends using random forests: A sample of the Zagreb stock
exchange,” 38th Int. Conv. Inf. Commun. Technol. Electron. Microelectron. MIPRO 2015, no. May, pp. 1189–1193, 2015.
[14] S. B. Imandoust and M. Bolandraftar, “Forecasting the direction of stock market index movement using three data
mining techniques: The case of Tehran Stock Exchange,” Int. J. Eng. Res. Appl., vol. 4, no. 6, pp. 106–117, 2014.
[15] K. Alkhatib, H. Najadat, I. Hmeidi, and M. K. A. Shatnawi, “Stock price prediction using K-nearestneighboralgorithm,”Int.
J. Business, Humanit. Technol., vol. 3, no. 3, pp. 32–44, 2013.
[16] S. H. Liu and F. Zhou, “On stock prediction based on KNN-ANN algorithm,” Proc. 2010 IEEE 5th Int. Conf. Bio-Inspired
Comput. Theor. Appl. BIC-TA 2010, pp. 310–312, 2010.
[17] T. Ye, “Stock forecasting method based on wavelet analysis and ARIMA-SVR model,” Inf. Manag. (ICIM), 2017 3rd Int., pp.
102–106, 2017.
[18] A. A. Ariyo, A. O. Adewumi, and C. K. Ayo, “Stock Price Prediction Using the ARIMA Model,” 2014 UKSim-AMSS 16th Int.
Conf. Comput. Model. Simul., no. March, pp. 106–112, 2014.
[19] P. Li, C. Jing, T. Liang, M. Liu, Z. Chen, and L. Guo, “Autoregressive moving average modeling in the financial sector,”
ICITACEE 2015 - 2nd Int. Conf. Inf. Technol. Comput. Electr. Eng. Green Technol. Strength. Inf. Technol. Electr. Comput. Eng.
Implementation, Proc., no. 4, pp. 68–71, 2016.
[20] R. P. Schumaker and H. Chen, “Textual analysis of stock market prediction using breaking financial news,”ACM Trans.Inf.
Syst., vol. 27, no. 2, pp. 1–19, 2009.](https://image.slidesharecdn.com/irjet-v6i5817-191010085640/75/IRJET-Prediction-of-Stock-Market-using-Machine-Learning-Algorithms-12-2048.jpg)

The document discusses predicting stock market prices using machine learning algorithms. It reviews past research applying algorithms like KNN, neural networks, ARIMA and random forest to stock price prediction. The paper aims to compare the performance of supervised learning algorithms like logistic regression, KNN and random forest on stock market datasets to determine the most accurate for predicting future prices. It reviews literature on the topic and discusses the methodology and algorithms that will be used to make predictions on datasets from five companies.