Download to read offline
![International Research Journal of Engineering and Technology (IRJET) e-ISSN: 2395-0056
Volume: 05 Issue: 04 | Apr-2018 www.irjet.net p-ISSN: 2395-0072
© 2018, IRJET | Impact Factor value: 6.171 | ISO 9001:2008 Certified Journal | Page 349
Location Identification for FACTs Device
Neha S. patel1, Priyank R.Bhavsar2
1PG student, Department of Electrical Engineering, Sankalchand Patel College of Engineering, Gujarat, India
2Associate professor, Department of Electrical Engineering, Sankalchand Patel College of Engineering,
Gujarat, India
--------------------------------------------------------------------***---------------------------------------------------------------------
Abstract—As result of deregulationofthepowersystemthe
power transmission line have to transfer power at their
maximum transmission limits because of the competitive
scenario of the electric market hence secured operation of
power system has become one of the most issue of modern
generation. It is essential for power systemtostudytheimpact
of contingencies on system security by proper use of FACTs
devices in electric network. This paper present three different
selection factors to decide the best location to place FACTs
device to improve the system security under contingencies .
Three selection factors Contingency Severity Index (CSI),
Excess Power Flow (EPF), Number of Times Overloaded Line
(NOTOL) are considered. This approach is tested on IEEE 6-
Bus and IEEE 30- Bus system and give ranking of most
preferable lines for placement of FACTs devices.
Keywords – Contingency Severity Index (CSI), Excess
Power flow (EPF), Number of Times Overloads Line
(NOTOL) Flexible ac Transmission system(FACTs)
1. INTRODUCTION
Day by day, increasing load on the power system, also
increasing severe contingency so the transmission network
parameter is working near to its thermal limits and voltage
limits that leading threat to power system security. The
whole system can lead to blackout because of severe
condition of overloading. This is very important for power
system security that the system would work within safe
limits. The overloadingofthe systemcanbe recoveredwhich
improve system security by two alternative, firstly
restructuring of power system and secondly by controlling
the line parameter of a system. But environmental, cost
problems are major problems for power transmission
network expansion due to power system restructuring
requires expanding potentials of the system network. To
Control the power flow of line in power system without
generation rescheduling can improve the performance. [2]
Hence, for best utilization of available capacities of system
and power flow control, installing FACTs devices. FACTs
devices such as (TCPAR) Thyristor Controlled Phase Angle
Regulator, (TCSC) Thyristor Controlled Series Capacitor,
Unified Power Flow Controlled (UPFC). These devices can
play an important role to reduce the flow of over-loaded
lines, increasing load -ability, low system loss improve
stability, reduce cost of production, stability margin
increased These devices used to control the power flows in
the line so power system security enhanced.[3]
2. POWER SYSTEM SECURITY
The security of power system can be defined as its ability to
withstand a set of severe but credible contingencies and to
survive the transition to acceptable new steady state
condition.
Contingency Creation
It is the initial step of contingency analysis. It is made up of
all set of viable contingencies that may happen in a power
system. This process consists of making contingency lists.
Contingency Selection
It is the second step in contingency analysis it is the process
which includes finding of severe contingencies from all that
may cause to violate bus voltages and power through lines.
Here in this procedure contingency list is reduced by
rejection of least severe contingency and taking into
consideration of most severe outages. In this process the
performance index has been used to find the most severe
ones.
Contingency Evaluation
It is the third step and the most significant step as it includes
necessary control and security actions whicharerequiredin
order to reduce the effects of most severe contingencies in a
power system.[2]
3. METHOD FOR OPTIMAL LOCATION FOR FACTs
DEVICE
There are several methods for finding the optimal location
of facts devices like: [4]
• Sensitivity Approach
• Contingency severity Index
3.1 Sensitivity Approach
The Sensitivity approach is characterized by to change in
active power performance index with respect to the FACTs
parameter. The sensitivity approach calculates to find the
optimal location of FACTs devices like a thyristor controlled
series capacitor (TCSC) and thyristor controlledphaseangle
regulator (TCPAR) .](https://image.slidesharecdn.com/irjet-v5i471-190212094320/85/IRJET-Location-Identification-for-FACTs-Device-1-320.jpg)
![International Research Journal of Engineering and Technology (IRJET) e-ISSN: 2395-0056
Volume: 05 Issue: 04 | Apr-2018 www.irjet.net p-ISSN: 2395-0072
© 2018, IRJET | Impact Factor value: 6.171 | ISO 9001:2008 Certified Journal | Page 349
Location Identification for FACTs Device
Neha S. patel1, Priyank R.Bhavsar2
1PG student, Department of Electrical Engineering, Sankalchand Patel College of Engineering, Gujarat, India
2Associate professor, Department of Electrical Engineering, Sankalchand Patel College of Engineering,
Gujarat, India
--------------------------------------------------------------------***---------------------------------------------------------------------
Abstract—As result of deregulationofthepowersystemthe
power transmission line have to transfer power at their
maximum transmission limits because of the competitive
scenario of the electric market hence secured operation of
power system has become one of the most issue of modern
generation. It is essential for power systemtostudytheimpact
of contingencies on system security by proper use of FACTs
devices in electric network. This paper present three different
selection factors to decide the best location to place FACTs
device to improve the system security under contingencies .
Three selection factors Contingency Severity Index (CSI),
Excess Power Flow (EPF), Number of Times Overloaded Line
(NOTOL) are considered. This approach is tested on IEEE 6-
Bus and IEEE 30- Bus system and give ranking of most
preferable lines for placement of FACTs devices.
Keywords – Contingency Severity Index (CSI), Excess
Power flow (EPF), Number of Times Overloads Line
(NOTOL) Flexible ac Transmission system(FACTs)
1. INTRODUCTION
Day by day, increasing load on the power system, also
increasing severe contingency so the transmission network
parameter is working near to its thermal limits and voltage
limits that leading threat to power system security. The
whole system can lead to blackout because of severe
condition of overloading. This is very important for power
system security that the system would work within safe
limits. The overloadingofthe systemcanbe recoveredwhich
improve system security by two alternative, firstly
restructuring of power system and secondly by controlling
the line parameter of a system. But environmental, cost
problems are major problems for power transmission
network expansion due to power system restructuring
requires expanding potentials of the system network. To
Control the power flow of line in power system without
generation rescheduling can improve the performance. [2]
Hence, for best utilization of available capacities of system
and power flow control, installing FACTs devices. FACTs
devices such as (TCPAR) Thyristor Controlled Phase Angle
Regulator, (TCSC) Thyristor Controlled Series Capacitor,
Unified Power Flow Controlled (UPFC). These devices can
play an important role to reduce the flow of over-loaded
lines, increasing load -ability, low system loss improve
stability, reduce cost of production, stability margin
increased These devices used to control the power flows in
the line so power system security enhanced.[3]
2. POWER SYSTEM SECURITY
The security of power system can be defined as its ability to
withstand a set of severe but credible contingencies and to
survive the transition to acceptable new steady state
condition.
Contingency Creation
It is the initial step of contingency analysis. It is made up of
all set of viable contingencies that may happen in a power
system. This process consists of making contingency lists.
Contingency Selection
It is the second step in contingency analysis it is the process
which includes finding of severe contingencies from all that
may cause to violate bus voltages and power through lines.
Here in this procedure contingency list is reduced by
rejection of least severe contingency and taking into
consideration of most severe outages. In this process the
performance index has been used to find the most severe
ones.
Contingency Evaluation
It is the third step and the most significant step as it includes
necessary control and security actions whicharerequiredin
order to reduce the effects of most severe contingencies in a
power system.[2]
3. METHOD FOR OPTIMAL LOCATION FOR FACTs
DEVICE
There are several methods for finding the optimal location
of facts devices like: [4]
• Sensitivity Approach
• Contingency severity Index
3.1 Sensitivity Approach
The Sensitivity approach is characterized by to change in
active power performance index with respect to the FACTs
parameter. The sensitivity approach calculates to find the
optimal location of FACTs devices like a thyristor controlled
series capacitor (TCSC) and thyristor controlledphaseangle
regulator (TCPAR) .](https://image.slidesharecdn.com/irjet-v5i471-190212094320/75/IRJET-Location-Identification-for-FACTs-Device-1-2048.jpg)
![International Research Journal of Engineering and Technology (IRJET) e-ISSN: 2395-0056
Volume: 05 Issue: 04 | Apr-2018 www.irjet.net p-ISSN: 2395-0072
© 2018, IRJET | Impact Factor value: 6.171 | ISO 9001:2008 Certified Journal | Page 350
3.1.1 Real power performance index
The severity of the system loading under contingency and
normal events can be drawn by an actual power line flow
performance index given below[3]
n
plm
plmN
m n
W mPI
2
max1 2
……………….(1)
plm = real power flow
plm
max
= rated capacity of line m
N= exponent
W m = real non negative weightingcoefficient whichmaybe
used to reflect the importance of lines.
3.2 Contingency severity Index [1]
The fundamental principle used in FACTs placement for
enhancing static security of the power system is to decide a
branch, which is most severity to the biggest number of
contingencies. Contingency severity Index (CSI) is a second
method to determine the location of FACTs devices which is
find from underneath equations. This chapter portrays the
definition and calculation of the contingency severity index
(CSI) and optimal placement procedure for the FACTs.
3.3 Problem Formulation
Selection three Factors to be consideredfor Optimal location
of FACTS Controllers are:[1]
Selection Factor-1: Concept of Contingency Severity Index
(CSI)
The CSI of a branch “j” is defined as of the sensitivities of
branch “j” to all the considered contingencies and is
experessed as
wijuij
m
i
ipjCSI
1 ………………………(2)
Where,
pi is the probability of occurrence for contingency “i” .
uij and
wij are elements of matrices U and W respectively.
M=The Total number of single contingency
pi uij wij = The element of matrix P,U,W
This equation is defined as sum of considered contingency
‘i’ for all branches are calculated A branch which has highest
CSI value will be more sensitive for security margin.
The participation matrix u:
This is an (m x n) binary matrix, where m is the aggregate of
single contingency and n is the aggregate of branches of
interest. uij is an element of matrix U, whose values are “1”
or “0” depending on comparing branch is overloaded. If
uij=0, the branch ‘j’ is not overloaded for contingency‘i’.If uij
=1, the branch ‘j’ is overloaded for contingency ‘i’.
The Ratio Matrix W:
This is a matrix of normalized excess overload branch flow
as for to the base case flow through branch “j” during
contingency “I” in dimensions of (m x n) and it is given by
bellowing equation:
1
sec
P aseojba
P ncyijcontinge
Wij
…………………..(3)
Where
Pij,cont = Power flow through branch” j” during specified
contingency i
P oj,norm = base case Power flow through branch j
Selection Factor-2: Concept of Excess Power Flow (EPF)
When there is a contingency, certain transmission linesmay
be overloaded with reference to thermal limit. The excess
power flow in the various overloaded lines withreferenceto
thermal limit of the corresponding lines for different
contingency conditions have to be calculated. The sum of
excess power flow in a particular branch for the different
contingencies is the best factor to be considered for ranking
of branches under different contingencies.
Selection Factor-3: Concept of Number of Times
Overloaded (NOTOL) When there is different contingency
condition, whether the line under study is getting
overloaded or not and that particular line how many times
getting overloaded for different contingencies have to be
observed. Utilizing this aspect, all the lines under studyhave
to be ranked.
Selection of branches for placement of FACTS
Controllers
The branches are listed out based on the CSI value in
descending order. While choosing selection factor-1, the
branch with largest value of CSI is considered as the best
location for FACTS Controller and to proceed further with
next highest CSI value for the next FACTS Controller.
However when considering selection factor 2 along with
selection factor-1, the branch with highest EPF gets higher
priority. Similarly when considering selection factor-3 in
addition to the above factors the branch with more number
of times overloaded for different contingencies gets higher
priority. Thus for selection of optimal location of line for
placing FACTS Controller, it is essential to consider all the
selection factors in a best combination way.](https://image.slidesharecdn.com/irjet-v5i471-190212094320/85/IRJET-Location-Identification-for-FACTs-Device-2-320.jpg)
![International Research Journal of Engineering and Technology (IRJET) e-ISSN: 2395-0056
Volume: 05 Issue: 04 | Apr-2018 www.irjet.net p-ISSN: 2395-0072
© 2018, IRJET | Impact Factor value: 6.171 | ISO 9001:2008 Certified Journal | Page 352
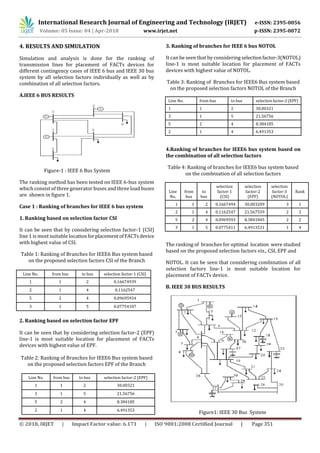
Case 2 : Ranking of branches for IEEE 30 bus system
based on the proposed selection factor viz CSI, EPF,
NOTOL
1.Ranking based on selection factor CSI
It can be seen that by considering selection factor-1 (CSI)
line-27 is most suitable location for placement of FACTs
device with highest value of CSI.
Table 1: Ranking of Branches for IEEE30 Bus system based
on the proposed selection factors CSI of the Branch
2. Ranking based on selection factor EPF
It can be seen that by considering selection factor-2(EPF)
line-10 is most suitable location for placement of FACTs
devices with highest value of EPF.
Table 2: Ranking of Branches for IEEE30 Bus system based
on the proposed selection factors EPF of the Branch
Line No. from bus to bus selection factor-2
(EPF)
10 6 8 22.31361
29 21 22 9.518213
22 15 18 7.802625
30 15 23 6.209976
16 12 13 5.538462
32 23 24 1.886208
35 25 27 1.205858
38 27 30 1.084967
40 8 28 0.875
37 27 29 0.723998
23 18 19 0.70939
41 6 28 0.549921
39 29 30 0.366601
21 16 17 0.27754
28 10 22 0.26136
33 24 25 0.20288
27 10 21 0.102809
3. Ranking based on selection factor NOTOL
It can be seen that by considering selectionfactor-3(NOTOL)
line-32 is most suitable location for placement of FACTs
devices with highest value of NOTOL.
Table 3: Ranking of Branches for IEEE30 Bus system
based on the proposed selection factors NOTOL of the
Branch
4.Ranking of branches for IEEE30 bus system based on
the proposed selection factors
Table 4: Ranking of branches for IEEE30 bus system based
on the proposed selection factors
Line
No.
from
bus
to
bus
selection
factor-1
(CSI)
selection
factor-2
(EPF)
selection
factor-3
(NOTOL)
Rank
23 18 19 0.0484 7.8026 4 1
27 10 21 0.1379 0.1082 1 2
21 16 17 0.0322 6.2099 3 3
1 1 2 0 1.2058 0 0
The ranking of branches for optimal location were studied
based on the proposed selection factors viz., CSI, EPF and
NOTOL. It can be seen that considering combination of all
selection factors line-23 is most suitable location for
placement of FACTs device.
5. CONCLUSION
From above analysis it can been that for IEEE 6 and IEEE 30
bus system by using different selection factors like CSI, EPF,
NOTOL individually the best locationforplacementofFACTs
device can be found and by combining all factors at a time
more reliable results can be obtained.
REFERENCES
[1] Balamurali, G.,& Thanushkodi, K. (2011). Novel
selection factors based optimal placement of TCSC
controller in power transmission system for
contingencies using PSO.
[2] Burada, S., Joshi, D., & Mistry , K. D. (2016, July).
Contingency analysis of power system by using
Line No. from bus to bus selection factor-1 (CSI)
27 10 21 0.13798
23 18 19 0.048414
22 15 18 0.047269
21 16 17 0.032259
10 6 8 0.003324
Line
No.
from bus to bus contingency
producing
overloads
selection
factor-3
(NOTOL)
32 23 24 6-7,16-17,18-19,19-
20,10-20,23-24,25-
27,27-29
8
23 18 19 16-17,10-17,10-
21,25-26
4
21 16 17 19-20,10-22,6-7 3
38 27 30 29-30,6-28 2
27 10 21 22-24 1
37 27 29 8-28 1
39 29 30 8-28 1
41 6 28 6-10 1](https://image.slidesharecdn.com/irjet-v5i471-190212094320/85/IRJET-Location-Identification-for-FACTs-Device-4-320.jpg)
![International Research Journal of Engineering and Technology (IRJET) e-ISSN: 2395-0056
Volume: 05 Issue: 04 | Apr-2018 www.irjet.net p-ISSN: 2395-0072
© 2018, IRJET | Impact Factor value: 6.171 | ISO 9001:2008 Certified Journal | Page 353
voltage and active power performance index. In
Power Electronics, Intelligent Control and Energy
Systems (ICPEICES), IEEE International Conference
on. IEEE.
[3] Mishra, A., &Gundavarapu, V. N. K. (2016).
Contingency management of power system with
Interline Power Flow Controller using Real Power
Performance Index and Line Stability Index. Ain
Shams Engineering Journal, 7(1), 209-222
[4] Singh, S. N. (2001). Location of FACTS devices for
enhancing power systems' security. In Power
Engineering, 2001. LESCOPE'01. 2001 Large
Engineering Systems Conference on (pp. 162-166).
IEEE
[5] Wood, A. J., &Wollenberg, B. F. (2012). Power
generation, operation, and control. John Wiley &
Sons.
[6] Stott, B., Alsac, O., &Monticelli, A. J. (1987). Security
analysis and optimization. Proceedings of the IEEE,
75(12), 1623-1644
[7] Shivashankar, S. (2013, February). Optimal location
of TCSC in transmission lines using contingency
severity index and performance index methods for
single contingency using PSO. In Power, Energyand
Control (ICPEC), 2013 International Conference on
(pp. 135-138). IEEE.
[8] Hingorani, N. G. (1993). Flexible AC transmission.
IEEE spectrum, 30(4), 40-45.
[9] Singh, S. N., & David, A. K. (2001). Optimal location
of FACTS devices for congestion management.
Electric Power Systems Research, 58(2), 71-
79management. Electric Power Systems Research,
58.
BIOGRAPHIES
Neha S. Patel
M.Tech. research scholar
Department of EE, SPCE,
Visnagar, Gujarat, India
Priyank R. Bhavsar
Associate professor
Department of EE, SPCE,
Visnagar, Gujarat, India
.
1’st
Author
Photo](https://image.slidesharecdn.com/irjet-v5i471-190212094320/85/IRJET-Location-Identification-for-FACTs-Device-5-320.jpg)

This document presents a method for determining the optimal location for placing Flexible AC Transmission System (FACTS) devices on a power grid to improve system security. It evaluates three selection factors: 1) Contingency Severity Index (CSI), which measures a line's sensitivity to overloads during contingencies, 2) Excess Power Flow (EPF), which calculates overload amounts during contingencies, and 3) Number of Times Overloaded Line (NOTOL), which counts how often a line is overloaded. These factors are calculated for different contingencies on IEEE 6-bus and 30-bus test systems. Lines are ranked based on the factors individually and combined. The highest ranked lines are determined to be the best locations for placing