Download to read offline


![Shankargouda.M. Patil, Sarojini B. K / International Journal of Engineering Research and
Applications (IJERA) ISSN: 2248-9622 www.ijera.com
Vol. 3, Issue 1, January -February 2013, pp.1621-1626
which yield a NaN, are divided by the sum to get a
normalized value.
Figure 5: Unwrapping the iris
Figure 3: Image with boundaries
3.2 Image Normalization
Once the iris region is segmented, the next stage
is to normalize this part, to enable generation of the
iris templates’ and their comparisons. Since
variations in the eye, like optical size of the iris,
position of pupil in the iris, and the iris orientation
change person to person, it is required to normalize
the iris image, so that the representation is common Figure 6: Normalized iris image
to all, with similar dimensions.
4. Matching
Normalization process involves unwrapping the
This method is performed to describe the
iris and converting it into its polar equivalent. It is
detailed process of effective region extraction,
done using Daugman’s Rubber sheet model. The
image alignment, and matching score calculation.
center of the pupil is considered as the reference
The main idea is to use the phase-based image
point and a remapping formula is used to convert the
matching for image alignment and matching score
points on the Cartesian scale to the polar scale.
calculation.
The modified form of the model is shown bellow.
4.1 Effective region extraction:
This step is performed to avoid certain
problems, which occurs when the extracted effective
region becomes too small to perform image
matching. Given a pair of normalized iris images f
(n1, n2) and g (n1, n2) to be compared, the purpose
of this process is to extract from the two images, the
effective regions f (n1, n2) and g (n1, n2) of same
size, which do not contain irrelevant regions. The
index range is assumed in any specified matrix
where amplitude and phase is detected and
evaluated. The inverse DFT is calculated. When two
images are not similar, the peak drops and the height
of the peak gives the good similarity measure for
image matching and the localization of the peak
shows the translation displacement of the image.
Figure 4: Normalization process
4.2 Phase-Based Image Matching:
Before discussing the image alignment and
The radial resolution was set to 100 and the
the matching score calculation, we introduce the
angular resolution to 2400 pixels. For every pixel in
principle of phase-based image matching using
the iris, an equivalent position is found out on polar
Phase-Only Correlation (POC) function [5].
axes. The normalized image was then interpolated
Consider two N1×N2-pixel images, f(n1, n2) and
into the size of the original image, by using the
g(n1, n2), where we assume that the index ranges
interp2 function. The parts in the normalized image
are n1 = −M1 · · ·M1
1623 | P a g e](https://image.slidesharecdn.com/iq3116211626-130226001831-phpapp02/75/Iq3116211626-3-2048.jpg)
![Shankargouda.M. Patil, Sarojini B. K / International Journal of Engineering Research and
Applications (IJERA) ISSN: 2248-9622 www.ijera.com
Vol. 3, Issue 1, January -February 2013, pp.1621-1626
Phase Based Matching
Matching Score
Calculation
Iris Image
N
Is Maximum Score (B)
above the Threshold?
Iris Localization
Not
Y Matching
Iris Normalization Matching
Stop
Database
Figure 7: process of flow diagram
Algorithm:
Begin:
Take input image.
If input image f
F1=cong [fft (f)]
(C)
For all data base 20 people
For all samples per person G1
Matches F1 and G1
POC store to peak
BLPOC store to peak
End
End
//TO find the maximum peak//
If peak>Th %Th= Threshold%
Match
Else
Not Match (D)
End Figure 8: Genuine matching using (A) & (B) The
original POC Function and (C) & (D) The Band
Limited POC function.
(A)
Figure 9: Distributions of matching score
1625 | P a g e](https://image.slidesharecdn.com/iq3116211626-130226001831-phpapp02/75/Iq3116211626-5-2048.jpg)
![Shankargouda.M. Patil, Sarojini B. K / International Journal of Engineering Research and
Applications (IJERA) ISSN: 2248-9622 www.ijera.com
Vol. 3, Issue 1, January -February 2013, pp.1621-1626
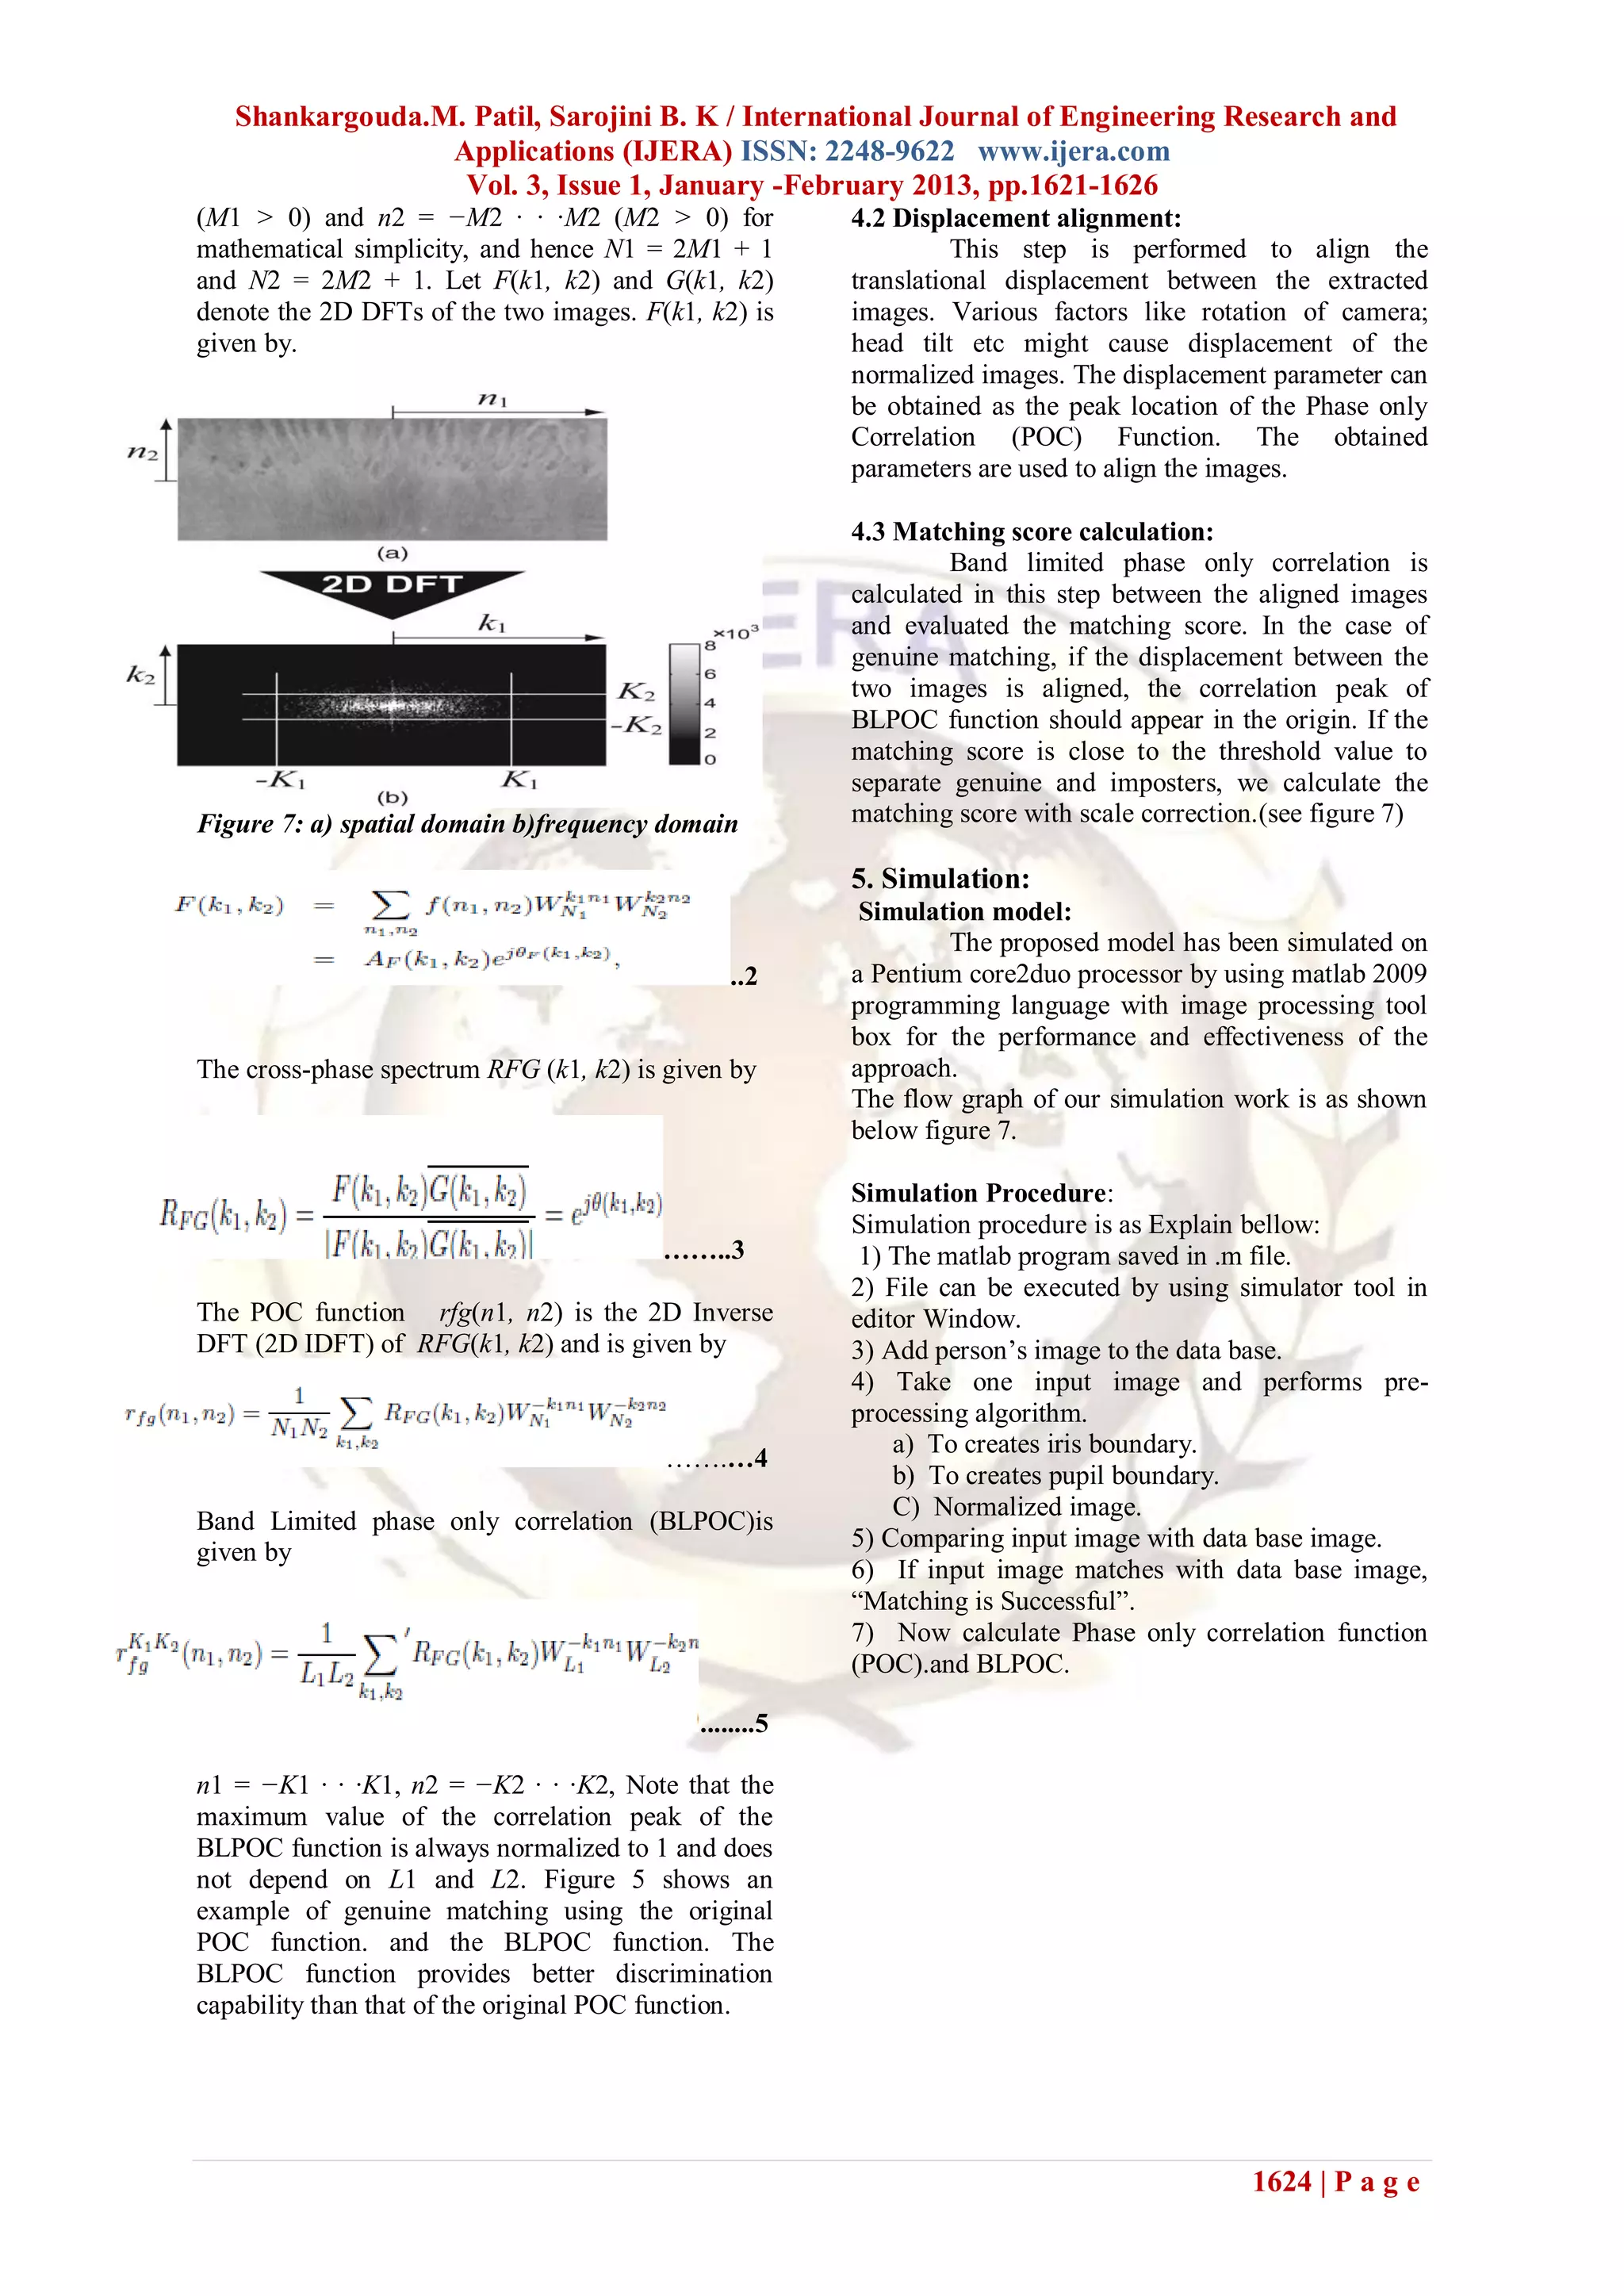
6. Results and discussion: [3] B. Kumar, C. Xie, and J. Thornton, “Iris
This section describes a set of experiments verification using correlation filters,” Proc.
using CASIA iris image database [6] for evaluating 4th Int. Conf. Audio- and Video-based
the proposed algorithm. This database contains 756 Biometric Person Authentication, pp. 697–
eye images (108 eyes and 7 images of each eye). We 705, 2003.
evaluate the genuine matching scores and the [4] K. Miyazawa, K. Ito, T. Aoki, K.
impostor matching scores for all the possible Kobayashi, and H. Nakajima, “An efficient
combinations (genuine: 2,268 attempts, impostor: iris recognition algorithm using phase-
283,122 attempts). based image matching,” Proc. Int. Conf. on
The score between minimum genuine value and Image Processing, pp. II– 49–II–52, Sept.
maximum impostor values can be chosen as a 2005.
threshold. [5] K. Miyazawa, K. Ito, T. Aoki, K.
Our observation shows that this performance Kobayashi, and H. Nakajima, “A phase-
degradation is mainly caused by the elimination of based iris recognition algorithm,” Lecture
the eyelid masking and the effective region Notes in Computer Science (ICB2006), vol.
extraction steps. Note that CASIA iris image 3832, pp. 356–365, Jan. 2006.
database contains many iris images whose irises are [6] CASIA iris image database ver 1.0.
heavily occluded by eyelids. Thus, the eyelid http://www.sinobiometris.com
masking and the effective region extraction steps [7] K. Ito, H. Nakajima, K. Kobayashi, T.
have a significant impact on the performance. In a Aoki, and T. Higuchi, “A fingerprint
practical system, however, such a difficult condition matching algorithm using phase-only
does not happen so often. On the other hand, the correlation,” IEICE Trans. Fundamentals,
processing time could be greatly reduced by the vol. E87-A, no. 3, pp. 682–691, Mar. 2004.
simplification which allows the system to perform [8] K. Ito, A. Morita, T. Aoki, T. Higuchi, H.
multiple matching within a short time. This leads to Nakajima, and K. Kobayashi, “A
better GAR (Genuine Accept Rate) for users. The fingerprint recognition algorithm
number of iris images in the database available at combining phase-based image matching
[7] is smaller than the complete database. The result and feature-based matching,” Lecture
demonstrates a potential possibility of phase-based Notes in Computer Science (ICB2006), vol.
image matching for creating an efficient iris 3832, pp. 316–325, Jan. 2006.
recognition system. [9] H. Nakajima, K. Kobayashi, M. Morikawa,
K. Atsushi, K. Ito, T. Aoki, and T. Higuchi,
7. Conclusion: “Fast and robust fingerprint identification
The personal identification technique algorithm and its application to residential
developed by John Daugman was implemented, access controller,” Lecture Notes in
with a few modifications involving due to Computer Science (ICB2006), vol. 3832,
processing speed. It has been tested only for the pp. 326–333, Jan. 2006.
CASIA database image. Due to computational [10] Products using phase-based image
efficiency, the search area in a couple of parts has matching.
been reduced, and the elimination of errors due to http://www.aoki.ecei.tohoku.ac.jp/poc/
reflections in the eye image has not been [11] John Daugman, University of Cambridge,
implemented. How Iris Recognition Works. Proceedings
at International Conference on Image
8. Acknowledgment Processing.
Portions of the research in this paper use CASIA iris [12] Tisse, Martin, Torres, Robert, Personal
image database collected by Institute of Automation, Identification using human iris recognition,
Chinese Academy of Sciences. Peter Kovesi, Matlab functions for
Computer Vision and Image Processing
References:
[1] J. Daugman, “High confidence visual
recognition of persons by a test of
statistical independence,” IEEE Trans.
Pattern Analy. Machine Intell., vol. 15, no.
11, pp. 1148–1161, Nov. 1993.
[2] L. Ma, T. Tan, Y. Wang, and D. Zhang,
“Efficient iris recognition by characterizing
key local variations,” IEEE Trans. Image
Processing, vol. 13, no. 6, pp. 739–750,
June 2004.
1626 | P a g e](https://image.slidesharecdn.com/iq3116211626-130226001831-phpapp02/75/Iq3116211626-6-2048.jpg)

This document summarizes an iris recognition system that uses phase-based matching. The system first acquires iris images, then performs preprocessing including localization of the iris and pupil boundaries and normalization. It then performs phase-based image matching using techniques like phase-only correlation to calculate a matching score and determine if two iris images match. The system is evaluated using a database of iris images, demonstrating efficient matching performance of the proposed algorithm.