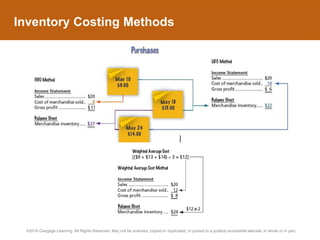
Accounting
Inventories
human/iStock/360/Getty
Images
Learning Objectives
• LO1: Describe the importance of control over inventory.
• LO2: Describe three inventory cost flow assumptions and how they
impact the income statement and balance sheet.
• LO3: Determine the cost of inventory under the perpetual inventory
system, using the FIFO, LIFO, and weighted average cost methods.
• LO4: Determine the cost of inventory under the periodic inventory
system, using the FIFO, LIFO, and weighted average cost methods.
• LO5: Compare and contrast the use of the three inventory costing
methods.
• LO6: Describe and illustrate the reporting of merchandise inventory in
the financial statements.
• LO7: Describe and illustrate the inventory turnover and the number of
days’ sales in inventory in analyzing the efficiency and effectiveness
of inventory management.
©2016 Cengage Learning. All Rights Reserved. May not be scanned, copied or duplicated, or posted to a publicly accessible website, in whole or in part.
Control of Inventory
• Two primary objectives of control over inventory
are:
o Safeguarding the inventory from damage or theft.
o Reporting inventory in the financial statements.
©2016 Cengage Learning. All Rights Reserved. May not be scanned, copied or duplicated, or posted to a publicly accessible website, in whole or in part.
Safeguarding Inventory
(slide 1 of 2)
• The purchase order authorizes the purchase of
the inventory from an approved vendor.
• The receiving report establishes an initial
record of the receipt of the inventory.
• The price, quantity, and description of the item
on the purchase order and receiving report are
compared to the vendor’s invoice before the
inventory is recorded in the accounting records.
©2016 Cengage Learning. All Rights Reserved. May not be scanned, copied or duplicated, or posted to a publicly accessible website, in whole or in part.
Safeguarding Inventory
(slide 2 of 2)
• Recording inventory using a perpetual inventory system
is also an effective means of control. The amount of
inventory is always available in the subsidiary inventory
ledger.
• Controls for safeguarding inventory should include
security measures to prevent damage and customer or
employee theft. Some examples of security measures
include:
o Storing inventory in areas that are restricted to only authorized
employees
o Locking high-priced inventory in cabinets
o Using two-way mirrors, cameras, security tags, and guards
©2016 Cengage Learning. All Rights Reserved. May not be scanned, copied or duplicated, or posted to a publicly accessible website, in whole or in part.
Reporting Inventory
• A physical inventory or count of inventory
should be taken near year-end to make sure that
the quantity of inventory reported in the financial
statements is accurate.
©2016 Cengage Learning. All Rights Reserved. May not be scanned, copied or duplicated, or posted to a publicly accessible website, in whole or in part.
Cost Flow Assumptions
©2016 Cengage Learning. All Rights Reserved. May not be scanned, copied or duplicated, or posted to a publicly accessible website, in whole or in part.
Inventory Cost Flow Assumptions
(slide 1 of 4)
• Assume that three identical units of merchandise
are purchased during May, as follows:
©2016 Cengage Learning. All Rights Reserved. May not be scanned, copied or duplicated, or posted to a publicly accessible website, in whole or in part.
Inventory Cost Flow Assumptions
(slide 2 of 4)
• Assume that one unit is sold on May 30 for $20.
Depending upon which unit was sold, the gross
profit varies from $11 to $6 and the ending
inventory value varies from $27 to $22, as
shown below:
©2016 Cengage Learning. All Rights Reserved. May not be scanned, copied or duplicated, or posted to a publicly accessible website, in whole or in part.
Inventory Cost Flow Assumptions
(slide 3 of 4)
• Under the specific identification inventory
cost flow method, the unit sold is identified with
a specific purchase.
©2016 Cengage Learning. All Rights Reserved. May not be scanned, copied or duplicated, or posted to a publicly accessible website, in whole or in part.
Inventory Cost Flow Assumptions
(slide 4 of 4)
• Under the first-in, first-out (FIFO) inventory cost flow
method, the first units purchased are assumed to be sold
and the ending inventory is made up of the most recent
purchases.
• Under the last-in, first out (LIFO) inventory cost flow
method, the last units purchased are assumed to be sold
and the ending inventory is made up of the first
purchases.
• Under the weighted average inventory cost flow
method, the cost of the units sold and in ending
inventory is a weighted average of the purchase costs.
©2016 Cengage Learning. All Rights Reserved. May not be scanned, copied or duplicated, or posted to a publicly accessible website, in whole or in part.
Inventory Costing Methods
©2016 Cengage Learning. All Rights Reserved. May not be scanned, copied or duplicated, or posted to a publicly accessible website, in whole or in part.
Use of Inventory Costing Methods
©2016 Cengage Learning. All Rights Reserved. May not be scanned, copied or duplicated, or posted to a publicly accessible website, in whole or in part.
Example Exercise
©2016 Cengage Learning. All Rights Reserved. May not be scanned, copied or duplicated, or posted to a publicly accessible website, in whole or in part.
The following three identical units of Item QBM are
purchased during February:
Assume that one unit is sold on February 27 for $70.
Determine the gross profit for February and ending
inventory on February 28 using the (a) first-in, first-out
(FIFO), (b) last-in, first-out (LIFO), and (c) weighted
average cost methods.
Cost Flow Methods
(slide 1 of 2)
Example Exercise
©2016 Cengage Learning. All Rights Reserved. May not be scanned, copied or duplicated, or posted to a publicly accessible website, in whole or in part.
Cost Flow Methods
(slide 2 of 2)
Inventory Costing Methods Under a
Perpetual Inventory System
• For purposes of illustration, the data for Item
127B are used, as shown below. We will
examine the perpetual inventory system first.
©2016 Cengage Learning. All Rights Reserved. May not be scanned, copied or duplicated, or posted to a publicly accessible website, in whole or in part.
First-In, First-Out Method
• When the FIFO method is used in a perpetual
inventory system, costs are included in the cost
of merchandise sold in the order in which they
were purchased.
• This is often the same as the physical flow of the
merchandise.
• For example, grocery stores shelve milk and
other perishable products by expiration dates.
Products with early expiration dates are stocked
in front. In this way, the oldest products (earliest
purchases) are sold first.
©2016 Cengage Learning. All Rights Reserved. May not be scanned, copied or duplicated, or posted to a publicly accessible website, in whole or in part.
Entries and Perpetual Inventory Account
(FIFO)
©2016 Cengage Learning. All Rights Reserved. May not be scanned, copied or duplicated, or posted to a publicly accessible website, in whole or in part.
Example Exercise
©2016 Cengage Learning. All Rights Reserved. May not be scanned, copied or duplicated, or posted to a publicly accessible website, in whole or in part.
Beginning inventory, purchases, and sales for Item ER27
are as follows:
Assuming a perpetual inventory system and using the
first-in, first-out (FIFO) method, determine (a) the cost
of merchandise sold on November 21 and (b) the
inventory on November 30.
Perpetual Inventory Using FIFO
Last-In, First-Out Method
• When the LIFO method is used in a perpetual
inventory system, the cost of the units sold is the
cost of the most recent purchases.
• The LIFO method was originally used in those
rare cases where the units sold were taken from
the most recently purchased units. However, for
tax purposes, LIFO is now widely used even
when it does not represent the physical flow of
units.
©2016 Cengage Learning. All Rights Reserved. May not be scanned, copied or duplicated, or posted to a publicly accessible website, in whole or in part.
Entries and Perpetual Inventory Account
(LIFO)
©2016 Cengage Learning. All Rights Reserved. May not be scanned, copied or duplicated, or posted to a publicly accessible website, in whole or in part.
Example Exercise
©2016 Cengage Learning. All Rights Reserved. May not be scanned, copied or duplicated, or posted to a publicly accessible website, in whole or in part.
Beginning inventory, purchases, and sales for Item ER27
are as follows:
Assuming a perpetual inventory system and using the
last-in, first-out (LIFO) method, determine (a) the cost
of merchandise sold on November 21 and (b) the
inventory on November 30.
Perpetual Inventory Using LIFO
Weighted Average Cost Method
• When the weighted average cost method is used
in a perpetual inventory system, a weighted
average unit cost for each item is computed
each time a purchase is made.
• This unit cost is used to determine the cost of
each sale until another purchase is made and a
new average is computed. This technique is
called a moving average.
©2016 Cengage Learning. All Rights Reserved. May not be scanned, copied or duplicated, or posted to a publicly accessible website, in whole or in part.
Entries and Perpetual Inventory Account
(Weighted Average)
©2016 Cengage Learning. All Rights Reserved. May not be scanned, copied or duplicated, or posted to a publicly accessible website, in whole or in part.
Example Exercise
©2016 Cengage Learning. All Rights Reserved. May not be scanned, copied or duplicated, or posted to a publicly accessible website, in whole or in part.
Beginning inventory, purchases, and sales for Item ER27
are as follows:
Assuming a perpetual inventory system and using the
weighted average method, determine (a) the weighted
average unit cost after the November 11 purchase, (b)
the cost of merchandise sold on November 21, and (c)
the inventory on November 30.
Perpetual Inventory Using
Weighted Average (slide 1 of 2)
Example Exercise
©2016 Cengage Learning. All Rights Reserved. May not be scanned, copied or duplicated, or posted to a publicly accessible website, in whole or in part.
Perpetual Inventory Using
Weighted Average (slide 2 of 2)
Inventory Costing Methods Under a
Periodic Inventory System
• When the periodic inventory system is used, only
revenue is recorded each time a sale is made.
• No entry is made at the time of sale to record the cost of
the merchandise sold.
• At the end of the accounting period, a physical inventory
is taken to determine the cost of the inventory and the
cost of the merchandise sold.
• Like the perpetual inventory system, a cost flow
assumption must be made when identical units are
acquired at different unit costs during a period.
©2016 Cengage Learning. All Rights Reserved. May not be scanned, copied or duplicated, or posted to a publicly accessible website, in whole or in part.
First-In, First-Out Method
(slide 1 of 3)
• The beginning inventory and purchases of Item
127B in January are as follows:
©2016 Cengage Learning. All Rights Reserved. May not be scanned, copied or duplicated, or posted to a publicly accessible website, in whole or in part.
Cost of merchandise
available for sale
First-In, First-Out Method
(slide 2 of 3)
• The physical count on January 31 shows that
800 units are on hand.
• The cost of the 800 units in the ending inventory
on January 31 is determined as follows:
©2016 Cengage Learning. All Rights Reserved. May not be scanned, copied or duplicated, or posted to a publicly accessible website, in whole or in part.
First-In, First-Out Method
(slide 3 of 3)
• Now, we can calculate the cost of merchandise
sold, as follows:
• The $18,460 cost of the ending merchandise
inventory on January 31 is made up of the most
recent costs.
• The $26,720 cost of merchandise sold is made
up of the beginning inventory and the earliest
costs.
©2016 Cengage Learning. All Rights Reserved. May not be scanned, copied or duplicated, or posted to a publicly accessible website, in whole or in part.
First-In, First-Out Flow of Costs
©2016 Cengage Learning. All Rights Reserved. May not be scanned, copied or duplicated, or posted to a publicly accessible website, in whole or in part.
Last-In, First-Out Method
(slide 1 of 2)
• Assume again that the physical count on
January 31 shows that 800 units are on hand.
• The cost of the 800 units in ending inventory on
January 31 is $16,000, which consists of 800
units from the beginning inventory at a cost of
$20.00 per unit.
©2016 Cengage Learning. All Rights Reserved. May not be scanned, copied or duplicated, or posted to a publicly accessible website, in whole or in part.
Last-In, First-Out Method
(slide 2 of 2)
• The cost of merchandise sold is computed as
follows:
• The $16,000 cost of the ending merchandise
inventory on January 31 is made up of the
earliest costs.
• The $29,180 cost of merchandise sold is made
up of the most recent costs.
©2016 Cengage Learning. All Rights Reserved. May not be scanned, copied or duplicated, or posted to a publicly accessible website, in whole or in part.
Last-In, First-Out Flow of Costs
©2016 Cengage Learning. All Rights Reserved. May not be scanned, copied or duplicated, or posted to a publicly accessible website, in whole or in part.
Weighted Average Cost Method
(slide 1 of 2)
• What is the average cost per unit and the ending
inventory?
©2016 Cengage Learning. All Rights Reserved. May not be scanned, copied or duplicated, or posted to a publicly accessible website, in whole or in part.
Average cost
per unit
Ending
inventory
Weighted Average Cost Method
(slide 2 of 2)
• The cost of merchandise sold is computed as
follows:
©2016 Cengage Learning. All Rights Reserved. May not be scanned, copied or duplicated, or posted to a publicly accessible website, in whole or in part.
Example Exercise
©2016 Cengage Learning. All Rights Reserved. May not be scanned, copied or duplicated, or posted to a publicly accessible website, in whole or in part.
The units of an item available for sale during the year were as
follows:
There are 16 units of the item in the physical inventory at
December 31. The periodic inventory system is used. Determine
the inventory cost using (a) the first-in, first-out (FIFO) method,
(b) the last-in, first-out (LIFO) method, and (c) the weighted
average cost method.
Periodic Inventory Using FIFO, LIFO,
and Weighted Average Cost Methods
Comparing Inventory Costing Methods
• A different cost flow is assumed for the FIFO,
LIFO, and weighted average inventory cost flow
methods. As a result, the three methods
normally yield different amounts for the
following:
o Cost of merchandise sold
o Gross Profit
o Net Income
o Ending merchandise inventory
• Note that if costs (prices) remain the same, all
three methods would yield the same results.
However, costs (prices) normally do change.
©2016 Cengage Learning. All Rights Reserved. May not be scanned, copied or duplicated, or posted to a publicly accessible website, in whole or in part.
Partial Income Statements:
(FIFO, Weighted Average Cost, LIFO)
• Using the perpetual inventory system illustration
with sales of $39,000 (1,300 units × $30), the
differences in cost of merchandise sold, gross
profit, and ending merchandise inventory are
illustrated below.
©2016 Cengage Learning. All Rights Reserved. May not be scanned, copied or duplicated, or posted to a publicly accessible website, in whole or in part.
Effects of Changing Costs (Prices):
FIFO and LIFO Cost Methods
©2016 Cengage Learning. All Rights Reserved. May not be scanned, copied or duplicated, or posted to a publicly accessible website, in whole or in part.
Comparing Inventory Costing Methods:
FIFO
• The FIFO method reports higher gross profit and
net income than the LIFO method during periods
of inflation, or when costs (prices) are
increasing.
• However, in periods of rapidly rising costs, the
inventory that is sold must be replaced at
increasingly higher costs. In this case, the larger
FIFO gross profit and net income are sometimes
called inventory profits or illusory profits.
©2016 Cengage Learning. All Rights Reserved. May not be scanned, copied or duplicated, or posted to a publicly accessible website, in whole or in part.
Comparing Inventory Costing Methods:
LIFO
• During a period of increasing costs, LIFO
matches more recent costs against sales on the
income statement.
• LIFO also offers an income tax savings during
periods of increasing costs. This is because
LIFO reports the lowest amount of gross profit
and, thus, lower taxable net income.
• On the balance sheet, however, the ending
inventory may be quite different from its current
replacement cost.
©2016 Cengage Learning. All Rights Reserved. May not be scanned, copied or duplicated, or posted to a publicly accessible website, in whole or in part.
Comparing Inventory Costing Methods:
Weighted Average
• The weighted average cost method is a
compromise between FIFO and LIFO.
• The effect of cost (price) trends is averaged in
determining the cost of merchandise sold and
the ending inventory.
©2016 Cengage Learning. All Rights Reserved. May not be scanned, copied or duplicated, or posted to a publicly accessible website, in whole or in part.
Reporting Merchandise Inventory
in the Financial Statements
• Cost is the primary basis for valuing and
reporting inventories in the financial statements.
However, inventory may be valued at other than
cost in the following cases:
o The cost of replacing items in inventory is below the
recorded cost.
o The inventory cannot be sold at normal prices due to
imperfections, style changes, spoilage, damage,
obsolescence, or other causes.
©2016 Cengage Learning. All Rights Reserved. May not be scanned, copied or duplicated, or posted to a publicly accessible website, in whole or in part.
Valuation at Lower of Cost or Market
(slide 1 of 3)
• If the market is lower than the purchase cost, the
lower-of-cost-or-market (LCM) method is
used to value the inventory.
• Market, as used in lower of cost or market, is the
net realizable value of the merchandise. Net
realizable value is determined as follows:
o Direct costs of disposal include selling expenses such
as special advertising or sales commissions.
©2016 Cengage Learning. All Rights Reserved. May not be scanned, copied or duplicated, or posted to a publicly accessible website, in whole or in part.
Net Realizable Value = Estimated Selling Price – Direct Costs of
Disposal
Valuation at Lower of Cost or Market
(slide 2 of 3)
• Assume the following data about an item of
damaged merchandise:
• In applying LCM, the market value of the
merchandise is $650, computed as follows:
• Thus, the merchandise would be valued at $650,
which is the lower of its cost of $1,000 and its
market value of $650.
©2016 Cengage Learning. All Rights Reserved. May not be scanned, copied or duplicated, or posted to a publicly accessible website, in whole or in part.
Valuation at Lower of Cost or Market
(slide 3 of 3)
• The lower-of-cost-or-market method can be
applied in one of three ways. The cost, market
price, and any declines could be determined for
the following:
o Each item in the inventory
o Each major class or category of inventory
o Total inventory as a whole
©2016 Cengage Learning. All Rights Reserved. May not be scanned, copied or duplicated, or posted to a publicly accessible website, in whole or in part.
Determining Inventory at
Lower of Cost or Market (LCM)
©2016 Cengage Learning. All Rights Reserved. May not be scanned, copied or duplicated, or posted to a publicly accessible website, in whole or in part.
Example Exercise
©2016 Cengage Learning. All Rights Reserved. May not be scanned, copied or duplicated, or posted to a publicly accessible website, in whole or in part.
On the basis of the following data, determine the value
of the inventory at the lower of cost or market. Apply
lower of cost or market to each inventory item.
Lower-of-Cost-or-Market Method
Merchandise Inventory on the Balance Sheet
(slide 1 of 2)
©2016 Cengage Learning. All Rights Reserved. May not be scanned, copied or duplicated, or posted to a publicly accessible website, in whole or in part.
• Merchandise inventory is usually presented in
the Current Assets section of the balance sheet.
• In addition to this amount, the following are
reported:
o The method of determining the cost of the inventory
(FIFO, LIFO, or weighted average)
o The method of valuing the inventory (cost or the lower
of cost or market)
Merchandise Inventory on the Balance Sheet
(slide 2 of 2)
©2016 Cengage Learning. All Rights Reserved. May not be scanned, copied or duplicated, or posted to a publicly accessible website, in whole or in part.
Effect of Inventory Errors
on the Financial Statements
(slide 1 of 3)
• Any errors in merchandise inventory will affect
the balance sheet and income statement.
• Some reasons that inventory errors may occur
include the following:
o Physical inventory on hand was miscounted.
o Costs were incorrectly assigned to inventory.
o Inventory in transit was incorrectly included or
excluded from inventory.
o Consigned inventory was incorrectly included or
excluded from inventory.
©2016 Cengage Learning. All Rights Reserved. May not be scanned, copied or duplicated, or posted to a publicly accessible website, in whole or in part.
Effect of Inventory Errors
on the Financial Statements
(slide 2 of 3)
• Inventory errors often arise from merchandise
that is in transit at year-end.
• Shipping terms determine when the title to
merchandise passes.
o When goods are purchased or sold FOB shipping
point, title passes to the buyer when the goods are
shipped.
o When the terms are FOB destination, title passes to
the buyer when the goods are received.
©2016 Cengage Learning. All Rights Reserved. May not be scanned, copied or duplicated, or posted to a publicly accessible website, in whole or in part.
Effect of Inventory Errors
on the Financial Statements
(slide 3 of 3)
• Inventory errors often arise from consigned
inventory. Manufacturers sometimes ship
merchandise to retailers who act as the
manufacturer’s agent.
• The manufacturer, called the consignor, retains
title until the goods are sold. Such merchandise
is said to be shipped on consignment to the
retailer, called the consignee.
• Any unsold merchandise at year-end is part of
the manufacturer’s (consignor’s) inventory, even
though the merchandise is in the hands of the
retailer (consignee).
©2016 Cengage Learning. All Rights Reserved. May not be scanned, copied or duplicated, or posted to a publicly accessible website, in whole or in part.
Effect of Inventory Errors on
Current Period’s Income Statement
©2016 Cengage Learning. All Rights Reserved. May not be scanned, copied or duplicated, or posted to a publicly accessible website, in whole or in part.
Effect of Inventory Errors on
Two Years’ Income Statements
©2016 Cengage Learning. All Rights Reserved. May not be scanned, copied or duplicated, or posted to a publicly accessible website, in whole or in part.
Effect of Inventory Errors on
Current Period’s Balance Sheet
©2016 Cengage Learning. All Rights Reserved. May not be scanned, copied or duplicated, or posted to a publicly accessible website, in whole or in part.
Example Exercise
©2016 Cengage Learning. All Rights Reserved. May not be scanned, copied or duplicated, or posted to a publicly accessible website, in whole or in part.
Zula Repair Shop incorrectly counted its December 31,
2016, inventory as $250,000 instead of the correct
amount of $220,000. Indicate the effect of the
misstatement on Zula’s December 31, 2016, balance
sheet and income statement for the year ended
December 31, 2016.
Effect of Inventory Errors
Financial Analysis and Interpretation:
Inventory Turnover
(slide 1 of 2)
• Inventory turnover measures the relationship
between cost of merchandise sold and the
amount of inventory carried during the period. It
is calculated as follows:
©2016 Cengage Learning. All Rights Reserved. May not be scanned, copied or duplicated, or posted to a publicly accessible website, in whole or in part.
Inventory Turnover =
Cost of Merchandise
Sold
Average Inventory
Financial Analysis and Interpretation:
Inventory Turnover
(slide 2 of 2)
• To illustrate, inventory turnover for Best Buy is
shown below (in millions).
©2016 Cengage Learning. All Rights Reserved. May not be scanned, copied or duplicated, or posted to a publicly accessible website, in whole or in part.
Financial Analysis and Interpretation:
Number of Days’ Sales in Inventory
(slide 1 of 2)
• The number of days’ sales in inventory
measures the length of time it takes to acquire,
sell, and replace the inventory. It is computed as
follows:
©2016 Cengage Learning. All Rights Reserved. May not be scanned, copied or duplicated, or posted to a publicly accessible website, in whole or in part.
Number of Days’
Sales in Inventory
Average Inventory
Average Daily Cost of Merchandise
Sold
=
Financial Analysis and Interpretation:
Number of Days’ Sales in Inventory
(slide 2 of 2)
• To illustrate, the number of days’ sales in
inventory for Best Buy is computed below (in
millions).
©2016 Cengage Learning. All Rights Reserved. May not be scanned, copied or duplicated, or posted to a publicly accessible website, in whole or in part.
Example Exercise
©2016 Cengage Learning. All Rights Reserved. May not be scanned, copied or duplicated, or posted to a publicly accessible website, in whole or in part.
Financial statement data for years ending December 31 for
Beadle Company follows:
a. Determine the inventory turnover for 2016 and 2015.
b. Determine the number of days’ sales in inventory for 2016
and 2015, using 365 days.
c. Does the change in the inventory turnover and the number of
days’ sales in inventory from 2015 to 2016 indicate a favorable
or an unfavorable trend?
Inventory Turnover and Number of
Days’ Sales in Inventory (slide 1 of 2)
Example Exercise
©2016 Cengage Learning. All Rights Reserved. May not be scanned, copied or duplicated, or posted to a publicly accessible website, in whole or in part.
Inventory Turnover and Number of
Days’ Sales in Inventory (slide 2 of 2)
Appendix: Estimating Inventory Cost
• A business may need to estimate the amount of
inventory for the following reasons:
o Perpetual inventory records are not maintained.
o A disaster such as a fire or flood has destroyed the
inventory records and the inventory.
o Monthly or quarterly financial statements are needed,
but a physical inventory is taken only once a year.
• Two widely used methods of estimating
inventory cost are the retail inventory method
and gross profit method.
©2016 Cengage Learning. All Rights Reserved. May not be scanned, copied or duplicated, or posted to a publicly accessible website, in whole or in part.
Appendix: Retail Method of Inventory Costing
• The retail inventory method of estimating
inventory cost requires costs and retail prices to
be maintained for the merchandise available for
sale.
• A ratio of cost to retail price is then used to
convert ending inventory at retail to estimate the
ending inventory cost.
©2016 Cengage Learning. All Rights Reserved. May not be scanned, copied or duplicated, or posted to a publicly accessible website, in whole or in part.
Determining Inventory by the Retail Method
©2016 Cengage Learning. All Rights Reserved. May not be scanned, copied or duplicated, or posted to a publicly accessible website, in whole or in part.
Appendix: Gross Profit Method
of Inventory Costing
• The gross profit method uses the estimated
gross profit for the period to estimate the
inventory at the end of the period.
• The gross profit is estimated from the preceding
year, adjusted for any current-period changes in
the cost and sales prices.
©2016 Cengage Learning. All Rights Reserved. May not be scanned, copied or duplicated, or posted to a publicly accessible website, in whole or in part.
Estimating Inventory by Gross Profit Method
©2016 Cengage Learning. All Rights Reserved. May not be scanned, copied or duplicated, or posted to a publicly accessible website, in whole or in part.

Inventory accounting & costing methods.pptx

  • 1.
  • 2.
    Learning Objectives • LO1:Describe the importance of control over inventory. • LO2: Describe three inventory cost flow assumptions and how they impact the income statement and balance sheet. • LO3: Determine the cost of inventory under the perpetual inventory system, using the FIFO, LIFO, and weighted average cost methods. • LO4: Determine the cost of inventory under the periodic inventory system, using the FIFO, LIFO, and weighted average cost methods. • LO5: Compare and contrast the use of the three inventory costing methods. • LO6: Describe and illustrate the reporting of merchandise inventory in the financial statements. • LO7: Describe and illustrate the inventory turnover and the number of days’ sales in inventory in analyzing the efficiency and effectiveness of inventory management. ©2016 Cengage Learning. All Rights Reserved. May not be scanned, copied or duplicated, or posted to a publicly accessible website, in whole or in part.
  • 3.
    Control of Inventory •Two primary objectives of control over inventory are: o Safeguarding the inventory from damage or theft. o Reporting inventory in the financial statements. ©2016 Cengage Learning. All Rights Reserved. May not be scanned, copied or duplicated, or posted to a publicly accessible website, in whole or in part.
  • 4.
    Safeguarding Inventory (slide 1of 2) • The purchase order authorizes the purchase of the inventory from an approved vendor. • The receiving report establishes an initial record of the receipt of the inventory. • The price, quantity, and description of the item on the purchase order and receiving report are compared to the vendor’s invoice before the inventory is recorded in the accounting records. ©2016 Cengage Learning. All Rights Reserved. May not be scanned, copied or duplicated, or posted to a publicly accessible website, in whole or in part.
  • 5.
    Safeguarding Inventory (slide 2of 2) • Recording inventory using a perpetual inventory system is also an effective means of control. The amount of inventory is always available in the subsidiary inventory ledger. • Controls for safeguarding inventory should include security measures to prevent damage and customer or employee theft. Some examples of security measures include: o Storing inventory in areas that are restricted to only authorized employees o Locking high-priced inventory in cabinets o Using two-way mirrors, cameras, security tags, and guards ©2016 Cengage Learning. All Rights Reserved. May not be scanned, copied or duplicated, or posted to a publicly accessible website, in whole or in part.
  • 6.
    Reporting Inventory • Aphysical inventory or count of inventory should be taken near year-end to make sure that the quantity of inventory reported in the financial statements is accurate. ©2016 Cengage Learning. All Rights Reserved. May not be scanned, copied or duplicated, or posted to a publicly accessible website, in whole or in part.
  • 7.
    Cost Flow Assumptions ©2016Cengage Learning. All Rights Reserved. May not be scanned, copied or duplicated, or posted to a publicly accessible website, in whole or in part.
  • 8.
    Inventory Cost FlowAssumptions (slide 1 of 4) • Assume that three identical units of merchandise are purchased during May, as follows: ©2016 Cengage Learning. All Rights Reserved. May not be scanned, copied or duplicated, or posted to a publicly accessible website, in whole or in part.
  • 9.
    Inventory Cost FlowAssumptions (slide 2 of 4) • Assume that one unit is sold on May 30 for $20. Depending upon which unit was sold, the gross profit varies from $11 to $6 and the ending inventory value varies from $27 to $22, as shown below: ©2016 Cengage Learning. All Rights Reserved. May not be scanned, copied or duplicated, or posted to a publicly accessible website, in whole or in part.
  • 10.
    Inventory Cost FlowAssumptions (slide 3 of 4) • Under the specific identification inventory cost flow method, the unit sold is identified with a specific purchase. ©2016 Cengage Learning. All Rights Reserved. May not be scanned, copied or duplicated, or posted to a publicly accessible website, in whole or in part.
  • 11.
    Inventory Cost FlowAssumptions (slide 4 of 4) • Under the first-in, first-out (FIFO) inventory cost flow method, the first units purchased are assumed to be sold and the ending inventory is made up of the most recent purchases. • Under the last-in, first out (LIFO) inventory cost flow method, the last units purchased are assumed to be sold and the ending inventory is made up of the first purchases. • Under the weighted average inventory cost flow method, the cost of the units sold and in ending inventory is a weighted average of the purchase costs. ©2016 Cengage Learning. All Rights Reserved. May not be scanned, copied or duplicated, or posted to a publicly accessible website, in whole or in part.
  • 12.
    Inventory Costing Methods ©2016Cengage Learning. All Rights Reserved. May not be scanned, copied or duplicated, or posted to a publicly accessible website, in whole or in part.
  • 13.
    Use of InventoryCosting Methods ©2016 Cengage Learning. All Rights Reserved. May not be scanned, copied or duplicated, or posted to a publicly accessible website, in whole or in part.
  • 14.
    Example Exercise ©2016 CengageLearning. All Rights Reserved. May not be scanned, copied or duplicated, or posted to a publicly accessible website, in whole or in part. The following three identical units of Item QBM are purchased during February: Assume that one unit is sold on February 27 for $70. Determine the gross profit for February and ending inventory on February 28 using the (a) first-in, first-out (FIFO), (b) last-in, first-out (LIFO), and (c) weighted average cost methods. Cost Flow Methods (slide 1 of 2)
  • 15.
    Example Exercise ©2016 CengageLearning. All Rights Reserved. May not be scanned, copied or duplicated, or posted to a publicly accessible website, in whole or in part. Cost Flow Methods (slide 2 of 2)
  • 16.
    Inventory Costing MethodsUnder a Perpetual Inventory System • For purposes of illustration, the data for Item 127B are used, as shown below. We will examine the perpetual inventory system first. ©2016 Cengage Learning. All Rights Reserved. May not be scanned, copied or duplicated, or posted to a publicly accessible website, in whole or in part.
  • 17.
    First-In, First-Out Method •When the FIFO method is used in a perpetual inventory system, costs are included in the cost of merchandise sold in the order in which they were purchased. • This is often the same as the physical flow of the merchandise. • For example, grocery stores shelve milk and other perishable products by expiration dates. Products with early expiration dates are stocked in front. In this way, the oldest products (earliest purchases) are sold first. ©2016 Cengage Learning. All Rights Reserved. May not be scanned, copied or duplicated, or posted to a publicly accessible website, in whole or in part.
  • 18.
    Entries and PerpetualInventory Account (FIFO) ©2016 Cengage Learning. All Rights Reserved. May not be scanned, copied or duplicated, or posted to a publicly accessible website, in whole or in part.
  • 19.
    Example Exercise ©2016 CengageLearning. All Rights Reserved. May not be scanned, copied or duplicated, or posted to a publicly accessible website, in whole or in part. Beginning inventory, purchases, and sales for Item ER27 are as follows: Assuming a perpetual inventory system and using the first-in, first-out (FIFO) method, determine (a) the cost of merchandise sold on November 21 and (b) the inventory on November 30. Perpetual Inventory Using FIFO
  • 20.
    Last-In, First-Out Method •When the LIFO method is used in a perpetual inventory system, the cost of the units sold is the cost of the most recent purchases. • The LIFO method was originally used in those rare cases where the units sold were taken from the most recently purchased units. However, for tax purposes, LIFO is now widely used even when it does not represent the physical flow of units. ©2016 Cengage Learning. All Rights Reserved. May not be scanned, copied or duplicated, or posted to a publicly accessible website, in whole or in part.
  • 21.
    Entries and PerpetualInventory Account (LIFO) ©2016 Cengage Learning. All Rights Reserved. May not be scanned, copied or duplicated, or posted to a publicly accessible website, in whole or in part.
  • 22.
    Example Exercise ©2016 CengageLearning. All Rights Reserved. May not be scanned, copied or duplicated, or posted to a publicly accessible website, in whole or in part. Beginning inventory, purchases, and sales for Item ER27 are as follows: Assuming a perpetual inventory system and using the last-in, first-out (LIFO) method, determine (a) the cost of merchandise sold on November 21 and (b) the inventory on November 30. Perpetual Inventory Using LIFO
  • 23.
    Weighted Average CostMethod • When the weighted average cost method is used in a perpetual inventory system, a weighted average unit cost for each item is computed each time a purchase is made. • This unit cost is used to determine the cost of each sale until another purchase is made and a new average is computed. This technique is called a moving average. ©2016 Cengage Learning. All Rights Reserved. May not be scanned, copied or duplicated, or posted to a publicly accessible website, in whole or in part.
  • 24.
    Entries and PerpetualInventory Account (Weighted Average) ©2016 Cengage Learning. All Rights Reserved. May not be scanned, copied or duplicated, or posted to a publicly accessible website, in whole or in part.
  • 25.
    Example Exercise ©2016 CengageLearning. All Rights Reserved. May not be scanned, copied or duplicated, or posted to a publicly accessible website, in whole or in part. Beginning inventory, purchases, and sales for Item ER27 are as follows: Assuming a perpetual inventory system and using the weighted average method, determine (a) the weighted average unit cost after the November 11 purchase, (b) the cost of merchandise sold on November 21, and (c) the inventory on November 30. Perpetual Inventory Using Weighted Average (slide 1 of 2)
  • 26.
    Example Exercise ©2016 CengageLearning. All Rights Reserved. May not be scanned, copied or duplicated, or posted to a publicly accessible website, in whole or in part. Perpetual Inventory Using Weighted Average (slide 2 of 2)
  • 27.
    Inventory Costing MethodsUnder a Periodic Inventory System • When the periodic inventory system is used, only revenue is recorded each time a sale is made. • No entry is made at the time of sale to record the cost of the merchandise sold. • At the end of the accounting period, a physical inventory is taken to determine the cost of the inventory and the cost of the merchandise sold. • Like the perpetual inventory system, a cost flow assumption must be made when identical units are acquired at different unit costs during a period. ©2016 Cengage Learning. All Rights Reserved. May not be scanned, copied or duplicated, or posted to a publicly accessible website, in whole or in part.
  • 28.
    First-In, First-Out Method (slide1 of 3) • The beginning inventory and purchases of Item 127B in January are as follows: ©2016 Cengage Learning. All Rights Reserved. May not be scanned, copied or duplicated, or posted to a publicly accessible website, in whole or in part. Cost of merchandise available for sale
  • 29.
    First-In, First-Out Method (slide2 of 3) • The physical count on January 31 shows that 800 units are on hand. • The cost of the 800 units in the ending inventory on January 31 is determined as follows: ©2016 Cengage Learning. All Rights Reserved. May not be scanned, copied or duplicated, or posted to a publicly accessible website, in whole or in part.
  • 30.
    First-In, First-Out Method (slide3 of 3) • Now, we can calculate the cost of merchandise sold, as follows: • The $18,460 cost of the ending merchandise inventory on January 31 is made up of the most recent costs. • The $26,720 cost of merchandise sold is made up of the beginning inventory and the earliest costs. ©2016 Cengage Learning. All Rights Reserved. May not be scanned, copied or duplicated, or posted to a publicly accessible website, in whole or in part.
  • 31.
    First-In, First-Out Flowof Costs ©2016 Cengage Learning. All Rights Reserved. May not be scanned, copied or duplicated, or posted to a publicly accessible website, in whole or in part.
  • 32.
    Last-In, First-Out Method (slide1 of 2) • Assume again that the physical count on January 31 shows that 800 units are on hand. • The cost of the 800 units in ending inventory on January 31 is $16,000, which consists of 800 units from the beginning inventory at a cost of $20.00 per unit. ©2016 Cengage Learning. All Rights Reserved. May not be scanned, copied or duplicated, or posted to a publicly accessible website, in whole or in part.
  • 33.
    Last-In, First-Out Method (slide2 of 2) • The cost of merchandise sold is computed as follows: • The $16,000 cost of the ending merchandise inventory on January 31 is made up of the earliest costs. • The $29,180 cost of merchandise sold is made up of the most recent costs. ©2016 Cengage Learning. All Rights Reserved. May not be scanned, copied or duplicated, or posted to a publicly accessible website, in whole or in part.
  • 34.
    Last-In, First-Out Flowof Costs ©2016 Cengage Learning. All Rights Reserved. May not be scanned, copied or duplicated, or posted to a publicly accessible website, in whole or in part.
  • 35.
    Weighted Average CostMethod (slide 1 of 2) • What is the average cost per unit and the ending inventory? ©2016 Cengage Learning. All Rights Reserved. May not be scanned, copied or duplicated, or posted to a publicly accessible website, in whole or in part. Average cost per unit Ending inventory
  • 36.
    Weighted Average CostMethod (slide 2 of 2) • The cost of merchandise sold is computed as follows: ©2016 Cengage Learning. All Rights Reserved. May not be scanned, copied or duplicated, or posted to a publicly accessible website, in whole or in part.
  • 37.
    Example Exercise ©2016 CengageLearning. All Rights Reserved. May not be scanned, copied or duplicated, or posted to a publicly accessible website, in whole or in part. The units of an item available for sale during the year were as follows: There are 16 units of the item in the physical inventory at December 31. The periodic inventory system is used. Determine the inventory cost using (a) the first-in, first-out (FIFO) method, (b) the last-in, first-out (LIFO) method, and (c) the weighted average cost method. Periodic Inventory Using FIFO, LIFO, and Weighted Average Cost Methods
  • 38.
    Comparing Inventory CostingMethods • A different cost flow is assumed for the FIFO, LIFO, and weighted average inventory cost flow methods. As a result, the three methods normally yield different amounts for the following: o Cost of merchandise sold o Gross Profit o Net Income o Ending merchandise inventory • Note that if costs (prices) remain the same, all three methods would yield the same results. However, costs (prices) normally do change. ©2016 Cengage Learning. All Rights Reserved. May not be scanned, copied or duplicated, or posted to a publicly accessible website, in whole or in part.
  • 39.
    Partial Income Statements: (FIFO,Weighted Average Cost, LIFO) • Using the perpetual inventory system illustration with sales of $39,000 (1,300 units × $30), the differences in cost of merchandise sold, gross profit, and ending merchandise inventory are illustrated below. ©2016 Cengage Learning. All Rights Reserved. May not be scanned, copied or duplicated, or posted to a publicly accessible website, in whole or in part.
  • 40.
    Effects of ChangingCosts (Prices): FIFO and LIFO Cost Methods ©2016 Cengage Learning. All Rights Reserved. May not be scanned, copied or duplicated, or posted to a publicly accessible website, in whole or in part.
  • 41.
    Comparing Inventory CostingMethods: FIFO • The FIFO method reports higher gross profit and net income than the LIFO method during periods of inflation, or when costs (prices) are increasing. • However, in periods of rapidly rising costs, the inventory that is sold must be replaced at increasingly higher costs. In this case, the larger FIFO gross profit and net income are sometimes called inventory profits or illusory profits. ©2016 Cengage Learning. All Rights Reserved. May not be scanned, copied or duplicated, or posted to a publicly accessible website, in whole or in part.
  • 42.
    Comparing Inventory CostingMethods: LIFO • During a period of increasing costs, LIFO matches more recent costs against sales on the income statement. • LIFO also offers an income tax savings during periods of increasing costs. This is because LIFO reports the lowest amount of gross profit and, thus, lower taxable net income. • On the balance sheet, however, the ending inventory may be quite different from its current replacement cost. ©2016 Cengage Learning. All Rights Reserved. May not be scanned, copied or duplicated, or posted to a publicly accessible website, in whole or in part.
  • 43.
    Comparing Inventory CostingMethods: Weighted Average • The weighted average cost method is a compromise between FIFO and LIFO. • The effect of cost (price) trends is averaged in determining the cost of merchandise sold and the ending inventory. ©2016 Cengage Learning. All Rights Reserved. May not be scanned, copied or duplicated, or posted to a publicly accessible website, in whole or in part.
  • 44.
    Reporting Merchandise Inventory inthe Financial Statements • Cost is the primary basis for valuing and reporting inventories in the financial statements. However, inventory may be valued at other than cost in the following cases: o The cost of replacing items in inventory is below the recorded cost. o The inventory cannot be sold at normal prices due to imperfections, style changes, spoilage, damage, obsolescence, or other causes. ©2016 Cengage Learning. All Rights Reserved. May not be scanned, copied or duplicated, or posted to a publicly accessible website, in whole or in part.
  • 45.
    Valuation at Lowerof Cost or Market (slide 1 of 3) • If the market is lower than the purchase cost, the lower-of-cost-or-market (LCM) method is used to value the inventory. • Market, as used in lower of cost or market, is the net realizable value of the merchandise. Net realizable value is determined as follows: o Direct costs of disposal include selling expenses such as special advertising or sales commissions. ©2016 Cengage Learning. All Rights Reserved. May not be scanned, copied or duplicated, or posted to a publicly accessible website, in whole or in part. Net Realizable Value = Estimated Selling Price – Direct Costs of Disposal
  • 46.
    Valuation at Lowerof Cost or Market (slide 2 of 3) • Assume the following data about an item of damaged merchandise: • In applying LCM, the market value of the merchandise is $650, computed as follows: • Thus, the merchandise would be valued at $650, which is the lower of its cost of $1,000 and its market value of $650. ©2016 Cengage Learning. All Rights Reserved. May not be scanned, copied or duplicated, or posted to a publicly accessible website, in whole or in part.
  • 47.
    Valuation at Lowerof Cost or Market (slide 3 of 3) • The lower-of-cost-or-market method can be applied in one of three ways. The cost, market price, and any declines could be determined for the following: o Each item in the inventory o Each major class or category of inventory o Total inventory as a whole ©2016 Cengage Learning. All Rights Reserved. May not be scanned, copied or duplicated, or posted to a publicly accessible website, in whole or in part.
  • 48.
    Determining Inventory at Lowerof Cost or Market (LCM) ©2016 Cengage Learning. All Rights Reserved. May not be scanned, copied or duplicated, or posted to a publicly accessible website, in whole or in part.
  • 49.
    Example Exercise ©2016 CengageLearning. All Rights Reserved. May not be scanned, copied or duplicated, or posted to a publicly accessible website, in whole or in part. On the basis of the following data, determine the value of the inventory at the lower of cost or market. Apply lower of cost or market to each inventory item. Lower-of-Cost-or-Market Method
  • 50.
    Merchandise Inventory onthe Balance Sheet (slide 1 of 2) ©2016 Cengage Learning. All Rights Reserved. May not be scanned, copied or duplicated, or posted to a publicly accessible website, in whole or in part. • Merchandise inventory is usually presented in the Current Assets section of the balance sheet. • In addition to this amount, the following are reported: o The method of determining the cost of the inventory (FIFO, LIFO, or weighted average) o The method of valuing the inventory (cost or the lower of cost or market)
  • 51.
    Merchandise Inventory onthe Balance Sheet (slide 2 of 2) ©2016 Cengage Learning. All Rights Reserved. May not be scanned, copied or duplicated, or posted to a publicly accessible website, in whole or in part.
  • 52.
    Effect of InventoryErrors on the Financial Statements (slide 1 of 3) • Any errors in merchandise inventory will affect the balance sheet and income statement. • Some reasons that inventory errors may occur include the following: o Physical inventory on hand was miscounted. o Costs were incorrectly assigned to inventory. o Inventory in transit was incorrectly included or excluded from inventory. o Consigned inventory was incorrectly included or excluded from inventory. ©2016 Cengage Learning. All Rights Reserved. May not be scanned, copied or duplicated, or posted to a publicly accessible website, in whole or in part.
  • 53.
    Effect of InventoryErrors on the Financial Statements (slide 2 of 3) • Inventory errors often arise from merchandise that is in transit at year-end. • Shipping terms determine when the title to merchandise passes. o When goods are purchased or sold FOB shipping point, title passes to the buyer when the goods are shipped. o When the terms are FOB destination, title passes to the buyer when the goods are received. ©2016 Cengage Learning. All Rights Reserved. May not be scanned, copied or duplicated, or posted to a publicly accessible website, in whole or in part.
  • 54.
    Effect of InventoryErrors on the Financial Statements (slide 3 of 3) • Inventory errors often arise from consigned inventory. Manufacturers sometimes ship merchandise to retailers who act as the manufacturer’s agent. • The manufacturer, called the consignor, retains title until the goods are sold. Such merchandise is said to be shipped on consignment to the retailer, called the consignee. • Any unsold merchandise at year-end is part of the manufacturer’s (consignor’s) inventory, even though the merchandise is in the hands of the retailer (consignee). ©2016 Cengage Learning. All Rights Reserved. May not be scanned, copied or duplicated, or posted to a publicly accessible website, in whole or in part.
  • 55.
    Effect of InventoryErrors on Current Period’s Income Statement ©2016 Cengage Learning. All Rights Reserved. May not be scanned, copied or duplicated, or posted to a publicly accessible website, in whole or in part.
  • 56.
    Effect of InventoryErrors on Two Years’ Income Statements ©2016 Cengage Learning. All Rights Reserved. May not be scanned, copied or duplicated, or posted to a publicly accessible website, in whole or in part.
  • 57.
    Effect of InventoryErrors on Current Period’s Balance Sheet ©2016 Cengage Learning. All Rights Reserved. May not be scanned, copied or duplicated, or posted to a publicly accessible website, in whole or in part.
  • 58.
    Example Exercise ©2016 CengageLearning. All Rights Reserved. May not be scanned, copied or duplicated, or posted to a publicly accessible website, in whole or in part. Zula Repair Shop incorrectly counted its December 31, 2016, inventory as $250,000 instead of the correct amount of $220,000. Indicate the effect of the misstatement on Zula’s December 31, 2016, balance sheet and income statement for the year ended December 31, 2016. Effect of Inventory Errors
  • 59.
    Financial Analysis andInterpretation: Inventory Turnover (slide 1 of 2) • Inventory turnover measures the relationship between cost of merchandise sold and the amount of inventory carried during the period. It is calculated as follows: ©2016 Cengage Learning. All Rights Reserved. May not be scanned, copied or duplicated, or posted to a publicly accessible website, in whole or in part. Inventory Turnover = Cost of Merchandise Sold Average Inventory
  • 60.
    Financial Analysis andInterpretation: Inventory Turnover (slide 2 of 2) • To illustrate, inventory turnover for Best Buy is shown below (in millions). ©2016 Cengage Learning. All Rights Reserved. May not be scanned, copied or duplicated, or posted to a publicly accessible website, in whole or in part.
  • 61.
    Financial Analysis andInterpretation: Number of Days’ Sales in Inventory (slide 1 of 2) • The number of days’ sales in inventory measures the length of time it takes to acquire, sell, and replace the inventory. It is computed as follows: ©2016 Cengage Learning. All Rights Reserved. May not be scanned, copied or duplicated, or posted to a publicly accessible website, in whole or in part. Number of Days’ Sales in Inventory Average Inventory Average Daily Cost of Merchandise Sold =
  • 62.
    Financial Analysis andInterpretation: Number of Days’ Sales in Inventory (slide 2 of 2) • To illustrate, the number of days’ sales in inventory for Best Buy is computed below (in millions). ©2016 Cengage Learning. All Rights Reserved. May not be scanned, copied or duplicated, or posted to a publicly accessible website, in whole or in part.
  • 63.
    Example Exercise ©2016 CengageLearning. All Rights Reserved. May not be scanned, copied or duplicated, or posted to a publicly accessible website, in whole or in part. Financial statement data for years ending December 31 for Beadle Company follows: a. Determine the inventory turnover for 2016 and 2015. b. Determine the number of days’ sales in inventory for 2016 and 2015, using 365 days. c. Does the change in the inventory turnover and the number of days’ sales in inventory from 2015 to 2016 indicate a favorable or an unfavorable trend? Inventory Turnover and Number of Days’ Sales in Inventory (slide 1 of 2)
  • 64.
    Example Exercise ©2016 CengageLearning. All Rights Reserved. May not be scanned, copied or duplicated, or posted to a publicly accessible website, in whole or in part. Inventory Turnover and Number of Days’ Sales in Inventory (slide 2 of 2)
  • 65.
    Appendix: Estimating InventoryCost • A business may need to estimate the amount of inventory for the following reasons: o Perpetual inventory records are not maintained. o A disaster such as a fire or flood has destroyed the inventory records and the inventory. o Monthly or quarterly financial statements are needed, but a physical inventory is taken only once a year. • Two widely used methods of estimating inventory cost are the retail inventory method and gross profit method. ©2016 Cengage Learning. All Rights Reserved. May not be scanned, copied or duplicated, or posted to a publicly accessible website, in whole or in part.
  • 66.
    Appendix: Retail Methodof Inventory Costing • The retail inventory method of estimating inventory cost requires costs and retail prices to be maintained for the merchandise available for sale. • A ratio of cost to retail price is then used to convert ending inventory at retail to estimate the ending inventory cost. ©2016 Cengage Learning. All Rights Reserved. May not be scanned, copied or duplicated, or posted to a publicly accessible website, in whole or in part.
  • 67.
    Determining Inventory bythe Retail Method ©2016 Cengage Learning. All Rights Reserved. May not be scanned, copied or duplicated, or posted to a publicly accessible website, in whole or in part.
  • 68.
    Appendix: Gross ProfitMethod of Inventory Costing • The gross profit method uses the estimated gross profit for the period to estimate the inventory at the end of the period. • The gross profit is estimated from the preceding year, adjusted for any current-period changes in the cost and sales prices. ©2016 Cengage Learning. All Rights Reserved. May not be scanned, copied or duplicated, or posted to a publicly accessible website, in whole or in part.
  • 69.
    Estimating Inventory byGross Profit Method ©2016 Cengage Learning. All Rights Reserved. May not be scanned, copied or duplicated, or posted to a publicly accessible website, in whole or in part.