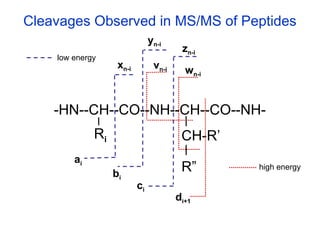
Mass Spectrometry 101
AnIntroductory Lecture On Mass Spectrometry
Fundamentals
Presented to the Sandler Mass Spectrometry Users’ Group
University of California San Francisco
April 11, 2003
2.
What does amass spectrometer do?
1. It measures mass better than any other technique.
2. It can give information about chemical structures.
What are mass measurements good for?
To identify, verify, and quantitate: metabolites,
recombinant proteins, proteins isolated from natural
sources, oligonucleotides, drug candidates, peptides,
synthetic organic chemicals, polymers
3.
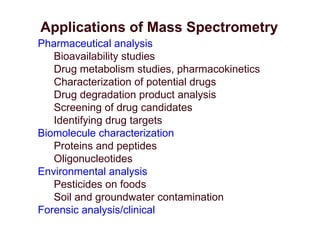
Pharmaceutical analysis
Bioavailability studies
Drugmetabolism studies, pharmacokinetics
Characterization of potential drugs
Drug degradation product analysis
Screening of drug candidates
Identifying drug targets
Biomolecule characterization
Proteins and peptides
Oligonucleotides
Environmental analysis
Pesticides on foods
Soil and groundwater contamination
Forensic analysis/clinical
Applications of Mass Spectrometry
4.
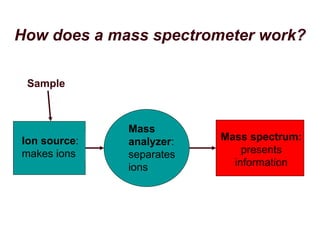
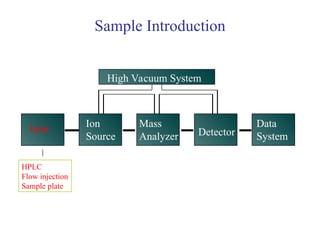
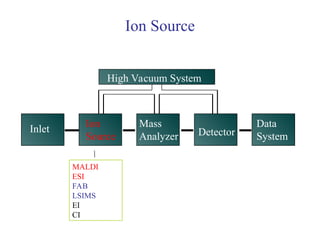
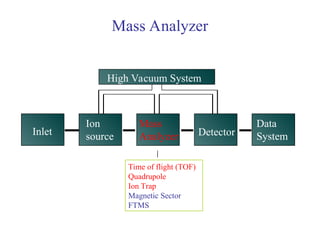
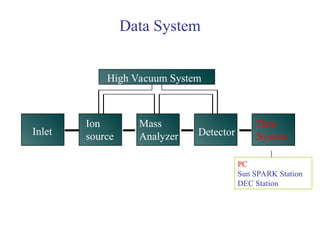
How does amass spectrometer work?
Ion source:
makes ions
Mass
analyzer:
separates
ions
Mass spectrum:
presents
information
Sample
¤ Operate underhigh vacuum (keeps ions from bumping
into gas molecules)
¤ Actually measure mass-to-charge ratio of ions (m/z)
¤ Key specifications are resolution, mass measurement
accuracy, and sensitivity.
¤ Several kinds exist: for bioanalysis, quadrupole, time-of-
flight and ion traps are most used.
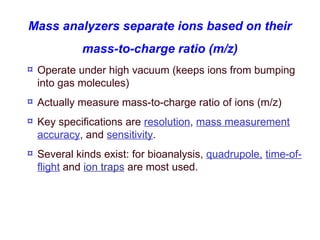
Mass analyzers separate ions based on their
mass-to-charge ratio (m/z)
13.
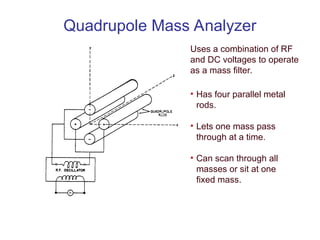
Quadrupole Mass Analyzer
Usesa combination of RF
and DC voltages to operate
as a mass filter.
• Has four parallel metal
rods.
• Lets one mass pass
through at a time.
• Can scan through all
masses or sit at one
fixed mass.
14.
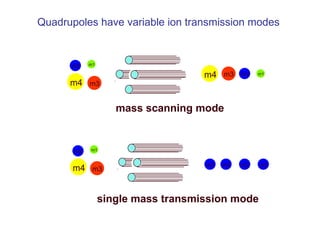
mass scanning mode
m1
m3
m4m2
m3
m1
m4
m2
single mass transmission mode
m2 m2 m2 m2
m3
m1
m4
m2
Quadrupoles have variable ion transmission modes
15.
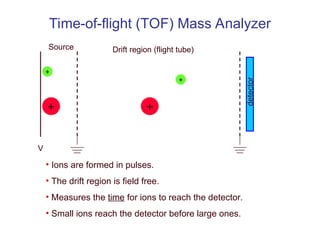
Time-of-flight (TOF) MassAnalyzer
+
+
+
+
Source Drift region (flight tube)
detector
V
• Ions are formed in pulses.
• The drift region is field free.
• Measures the time for ions to reach the detector.
• Small ions reach the detector before large ones.
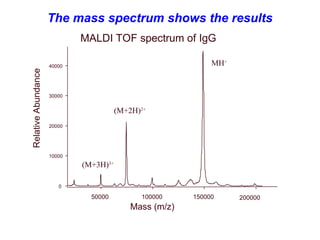
The mass spectrumshows the results
Relative
Abundance
Mass (m/z)
0
10000
20000
30000
40000
50000 100000 150000 200000
MH+
(M+2H)2+
(M+3H)3+
MALDI TOF spectrum of IgG
21.
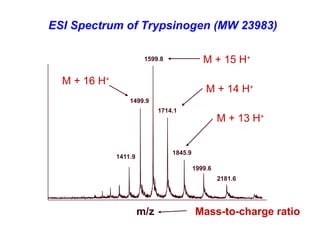
ESI Spectrum ofTrypsinogen (MW 23983)
1599.8
1499.9
1714.1
1845.9
1411.9
1999.6
2181.6
M + 15 H+
M + 13 H+
M + 14 H+
M + 16 H+
m/z Mass-to-charge ratio
22.
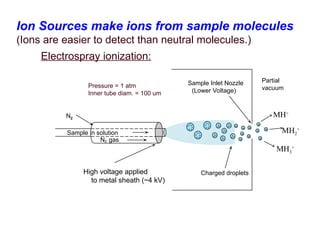
How do massspectrometers get their names?
Types of ion sources:
• Electrospray (ESI)
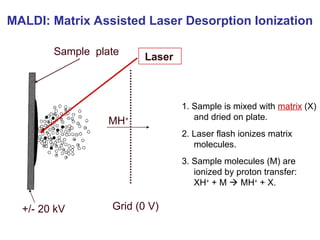
• Matrix Assisted Laser Desorption Ionization (MALDI)
Types of mass analyzers:
• Quadrupole (Quad, Q)
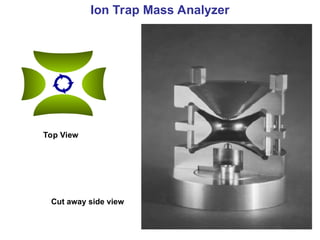
• Ion Trap
• Time-of-Flight (TOF)
-Either source type can work with either analyzer type: “MALDI-
TOF,” “ESI-Quad.”
-Analyzers can be combined to create “hybrid” instruments.
ESI-QQQ, MALDI QQ TOF, Q Trap
23.
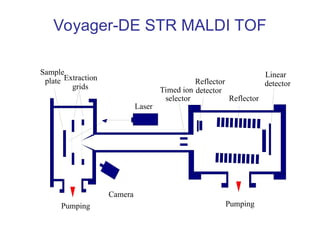
Voyager-DE STR MALDITOF
Camera
Laser
Sample
plate
Pumping Pumping
Timed ion
selector Reflector
Linear
detector
Extraction
grids
Reflector
detector
24.
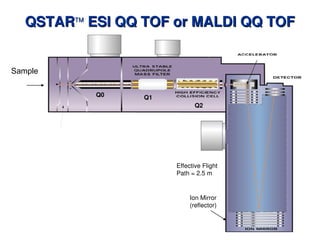
QSTAR
QSTARTM
TM
ESI QQ TOFor MALDI QQ TOF
ESI QQ TOF or MALDI QQ TOF
Q1
Ion Mirror
(reflector)
Effective Flight
Path = 2.5 m
Q2
Q0
Sample
25.
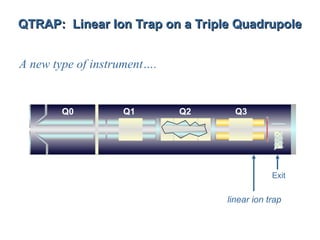
QTRAP: Linear IonTrap on a Triple Quadrupole
QTRAP: Linear Ion Trap on a Triple Quadrupole
A new type of instrument….
linear ion trap
Exit
Q0 Q1 Q2 Q3
26.
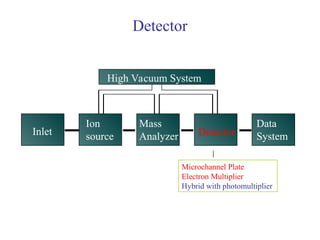
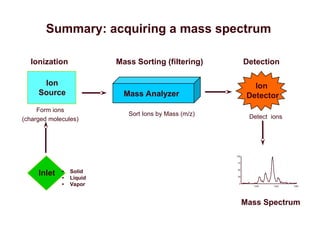
Inlet
Ionization
Mass Analyzer
Mass Sorting(filtering)
Ion
Detector
Detection
Ion
Source
• Solid
• Liquid
• Vapor
Detect ions
Form ions
(charged molecules)
Sort Ions by Mass (m/z)
1330 1340 1350
100
75
50
25
0
Mass Spectrum
Summary: acquiring a mass spectrum
27.
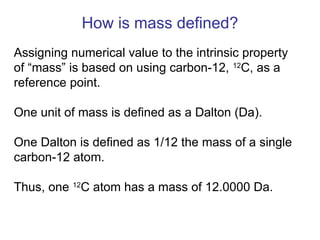
Assigning numerical valueto the intrinsic property
of “mass” is based on using carbon-12, 12
C, as a
reference point.
One unit of mass is defined as a Dalton (Da).
One Dalton is defined as 1/12 the mass of a single
carbon-12 atom.
Thus, one 12
C atom has a mass of 12.0000 Da.
How is mass defined?
28.
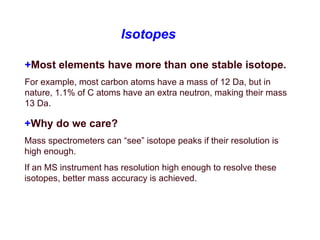
Isotopes
+Most elements havemore than one stable isotope.
For example, most carbon atoms have a mass of 12 Da, but in
nature, 1.1% of C atoms have an extra neutron, making their mass
13 Da.
+Why do we care?
Mass spectrometers can “see” isotope peaks if their resolution is
high enough.
If an MS instrument has resolution high enough to resolve these
isotopes, better mass accuracy is achieved.
29.
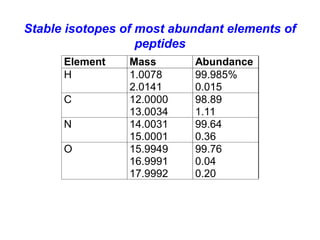
Element Mass Abundance
H1.0078
2.0141
99.985%
0.015
C 12.0000
13.0034
98.89
1.11
N 14.0031
15.0001
99.64
0.36
O 15.9949
16.9991
17.9992
99.76
0.04
0.20
Stable isotopes of most abundant elements of
peptides
30.
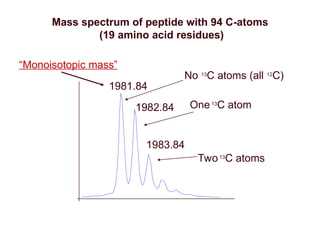
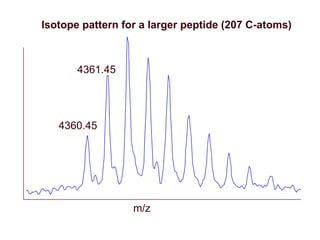
1981.84
1982.84
1983.84
Mass spectrum ofpeptide with 94 C-atoms
(19 amino acid residues)
No 13
C atoms (all 12
C)
One13
C atom
Two13
C atoms
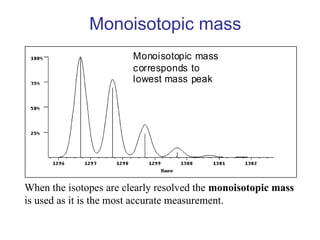
“Monoisotopic mass”
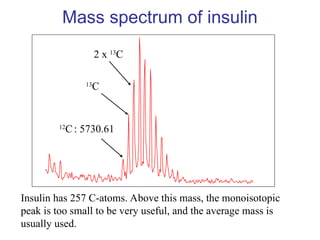
Mass spectrum ofinsulin
12
C: 5730.61
13
C
2 x 13
C
Insulin has 257 C-atoms. Above this mass, the monoisotopic
peak is too small to be very useful, and the average mass is
usually used.
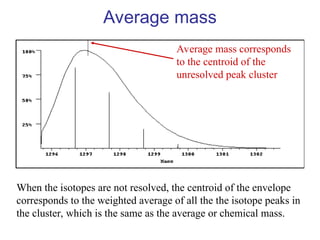
Average mass
Average masscorresponds
to the centroid of the
unresolved peak cluster
When the isotopes are not resolved, the centroid of the envelope
corresponds to the weighted average of all the the isotope peaks in
the cluster, which is the same as the average or chemical mass.
35.
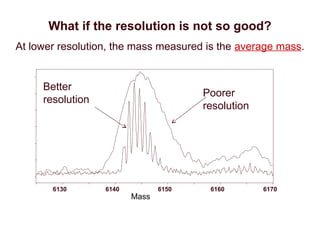
6130 6140 61506160 6170
Poorer
resolution
Better
resolution
What if the resolution is not so good?
At lower resolution, the mass measured is the average mass.
Mass
36.
15.01500 15.01820 15.0214015.02460 15.02780 15.03100
Mass (m/z)
100
0
10
20
30
40
50
60
70
80
90
100
%
In
t
e
n
s
it
y
ISO:CH3
15.0229
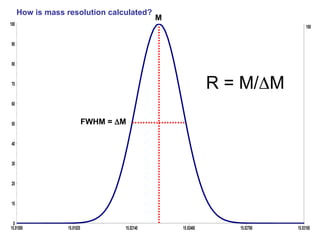
M
FWHM = M
R = M/M
How is mass resolution calculated?
37.
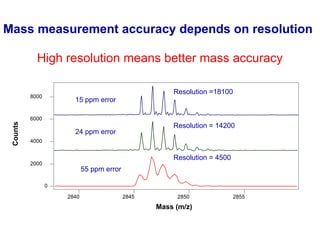
Mass measurement accuracydepends on resolution
0
2000
4000
6000
8000
Counts
2840 2845 2850 2855
Mass (m/z)
Resolution = 14200
Resolution = 4500
Resolution =18100
15 ppm error
24 ppm error
55 ppm error
High resolution means better mass accuracy
38.
How do weachieve superior mass
resolution?
Delayed Extraction on a MALDI source
Reflector TOF Mass Analyzer
39.
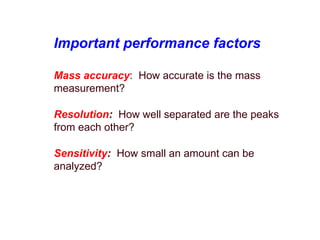
Important performance factors
Massaccuracy: How accurate is the mass
measurement?
Resolution: How well separated are the peaks
from each other?
Sensitivity: How small an amount can be
analyzed?
40.
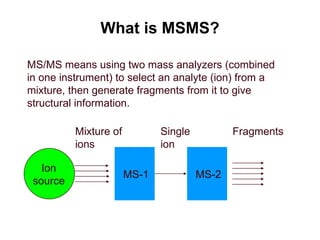
What is MSMS?
MS/MSmeans using two mass analyzers (combined
in one instrument) to select an analyte (ion) from a
mixture, then generate fragments from it to give
structural information.
Ion
source
MS-2
MS-1
Mixture of
ions
Single
ion
Fragments
41.
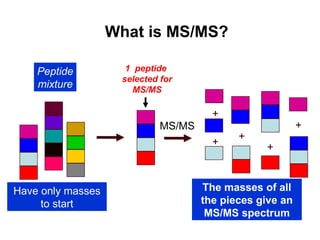
What is MS/MS?
MS/MS
+
+
++
+
1 peptide
selected for
MS/MS
The masses of all
the pieces give an
MS/MS spectrum
Peptide
mixture
Have only masses
to start
42.
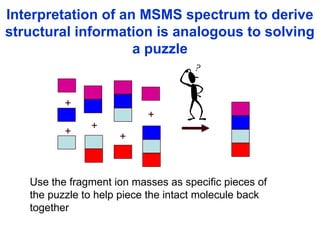
Interpretation of anMSMS spectrum to derive
structural information is analogous to solving
a puzzle
+
+
+ +
+
Use the fragment ion masses as specific pieces of
the puzzle to help piece the intact molecule back
together
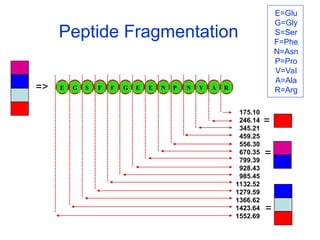
E G SF F G E E N P N V A R
Peptide Fragmentation
175.10
246.14
345.21
459.25
556.30
670.35
799.39
928.43
985.45
1132.52
1279.59
1366.62
1423.64
1552.69
=>
=
=
=
E=Glu
G=Gly
S=Ser
F=Phe
N=Asn
P=Pro
V=Val
A=Ala
R=Arg
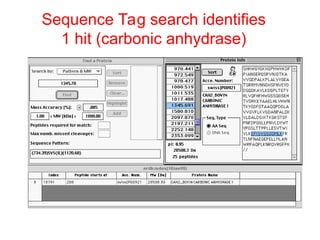
45.
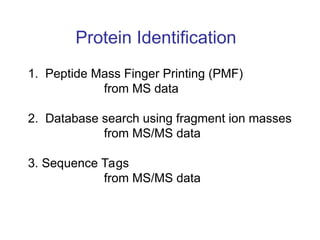
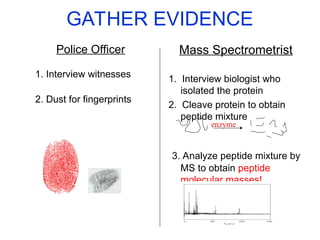
Protein Identification
1. PeptideMass Finger Printing (PMF)
from MS data
2. Database search using fragment ion masses
from MS/MS data
3. Sequence Tags
from MS/MS data
Mass Spectrometrist
1. Interviewbiologist who
isolated the protein
2. Cleave protein to obtain
peptide mixture
3. Analyze peptide mixture by
MS to obtain peptide
molecular masses!
GATHER EVIDENCE
Police Officer
1. Interview witnesses
2. Dust for fingerprints
enzyme
48.
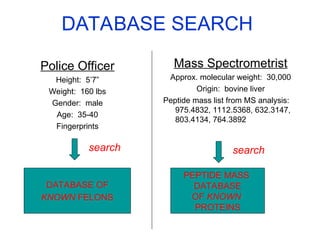
DATABASE SEARCH
Police Officer
Height:5’7”
Weight: 160 lbs
Gender: male
Age: 35-40
Fingerprints
Mass Spectrometrist
Approx. molecular weight: 30,000
Origin: bovine liver
Peptide mass list from MS analysis:
975.4832, 1112.5368, 632.3147,
803.4134, 764.3892
DATABASE OF
KNOWN FELONS
PEPTIDE MASS
DATABASE
OF KNOWN
PROTEINS
search search
49.
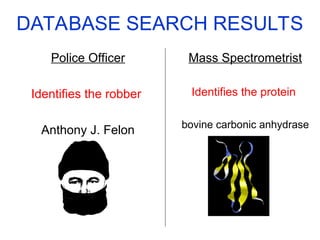
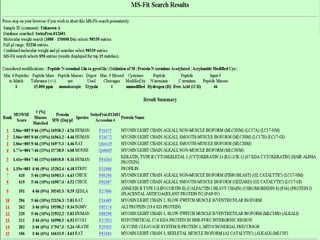
DATABASE SEARCH RESULTS
PoliceOfficer
Identifies the robber
Anthony J. Felon
Mass Spectrometrist
Identifies the protein
bovine carbonic anhydrase
50.
886.0 1165.6 1445.21724.8 2004.4 2284.0
Mass (m/z)
0
2.7E+4
0
10
20
30
40
50
60
70
80
90
100
%
I
n
t
e
n
s
i
t
y
Voyager Spec #1 MC=>AdvBC(32,0.5,0.1)=>NR(1.50)[BP= 1025.5, 26876]
1
0
2
5
.
5
0
1
3
4
1
.
6
3
1
7
8
6
.
8
2
1
2
7
7
.
7
1
1
1
7
9
.
6
0
1
5
4
4
.
6
9
9
9
5
.
5
8
1
2
3
4
.
6
5
1
3
0
8
.
6
6
2
2
1
1
.
1
0
1
7
0
8
.
7
5
1
1
0
7
.
5
6
1
9
9
4
.
9
9
Peptide mass fingerprint of Spot A
Gel coordinates: 16kDa, 4.2 (mwt, pI)
500 610 720830 940 1050
Mass (m/z)
0
6735.5
0
10
20
30
40
50
60
70
80
90
100
%
In
te
n
s
ity
Stitched PSD=>BC=>SM25=>AdvBC(32,0.5,0.1)[BP = 120.1, 50520]
y
4
(+
1
)
b
5
(+
1
)
y
8
(+
1
)
y
4
-
1
7
(+
1
)
a
5
(+
1
)
6
4
7
.4
7
1
4
.8
y
7
(+
1
)
A
F
Q
L
F
D
(+
1
)
-
1
7
,A
F
Q
L
F
D
(+
1
)
-
1
8
7
3
0
.1
9
7
3
.7
9
6
1
.0
8
1
9
.9
9
4
1
.5
b
7
(+
1
)
65 152 239 326 413 500
Mass (m/z)
0
5.1E+4
0
10
20
30
40
50
60
70
80
90
100
%
In
te
n
s
ity
Stitched PSD=>BC=>SM25=>AdvBC(32,0.5,0.1)[BP = 120.1, 50520]
F
y
1
(+
1
)
b
2
(+
1
)
F
Q
(+
1
)
Q
a
2
(+
1
)
b
4
(+
1
),Q
L
F
D
(+
1
)
-
2
8
L
b
1
-
1
8
(+
1
)
1
6
5
.1
3
6
5
.1
3
4
7
.1
y
2
(+
1
)
y
3
-
1
7
(+
1
)
Q
L
(+
1
)
-
2
8
y
1
-
1
7
(+
1
)
7
0
.0
y
3
(+
1
)
8
4
.0
Q
L
(+
1
)
b
3
-
1
8
(+
1
),A
F
Q
(+
1
)
-
1
7
2
2
9
.2
F
Q
L
(+
1
),Q
L
F
(+
1
)
F
D
(+
1
)
b
4
-
1
8
(+
1
)
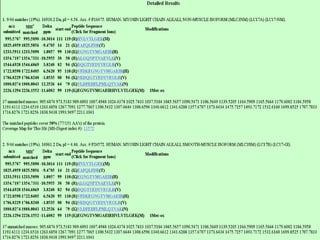
MS/MS spectrum for tryptic peptide MH+
= 1025.5, EAFQLFDR, from
Spot A. An MS-Tag search using the fragment ions from this spectrum
confirmed the identity of Spot A as myosin light chain.
55.
Sequence Tags fromPeptide
Fragmentation by MS/MS
peptide molecular weight (MW)
partial sequence (region 2)
molecular wt before partial sequence (region 1)
molecular wts after partial sequence (region 3)
A V I/L T
Peptide measured molecular wt = 1927.2
1108.13
Partial Sequence
- A-V-I/L-T-
381.1
region 1 region 2 region 3
One sequence tag includes four components:
1546.11
56.
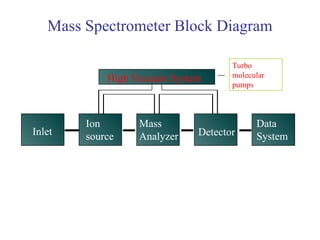
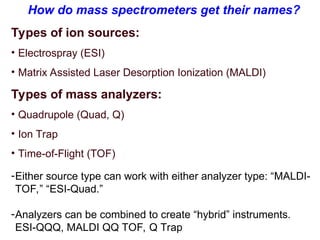
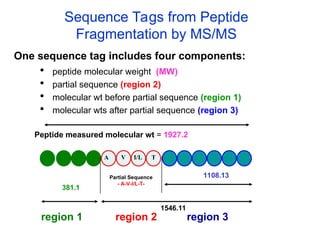
Sequence TAG Examplefrom MS/MS Spectrum
Peptide MW = 1345.70
y 1 1
y 1 0
y 9
y 8
y 7
y 6
y 5
y 4
y 3
y 2
y 1
b1 b2 b3 b4 b5
I/ L
a2
2 9 4 .2
b2 - H2 O
b3 - H2 O
b4 - H2 O
b5 - H2 O
b6 - H2 O
b5 - 2 ( H2 O)
200 400 600 800 1000 1200
m/z, amu
100
200
300
400
500
600
700
800
Sequence Tag (739.34)SVS(I/L)(1120.60)
739.34
1120.60
[M+2H]2+
S V I/L
S
Acknowledgements
We thank theApplied Biosystems Mass Spectrometry Applications
Laboratory for allowing the use of some of their slides for this
presentation.
Editor's Notes
#25 This instrument has the basic footprint of a triple quadrupole instrument - it’s the same as our small benchtop API2000. The modifications made were the addition of a gridded exit lens and the auxiliary AC- applied dipolar. Also the Q3 is now gold-coated stainless steel rods with two collar lenses, and this is to improve the resolution and peak shape when in LIT mode. Gold-coated rods have less pits on the surface than the stainless steel rods- less imperfect fields means better resolution / sensitivity performance.
![886.0 1165.6 1445.2 1724.8 2004.4 2284.0
Mass (m/z)
0
2.7E+4
0
10
20
30
40
50
60
70
80
90
100
%
I
n
t
e
n
s
i
t
y
Voyager Spec #1 MC=>AdvBC(32,0.5,0.1)=>NR(1.50)[BP= 1025.5, 26876]
1
0
2
5
.
5
0
1
3
4
1
.
6
3
1
7
8
6
.
8
2
1
2
7
7
.
7
1
1
1
7
9
.
6
0
1
5
4
4
.
6
9
9
9
5
.
5
8
1
2
3
4
.
6
5
1
3
0
8
.
6
6
2
2
1
1
.
1
0
1
7
0
8
.
7
5
1
1
0
7
.
5
6
1
9
9
4
.
9
9
Peptide mass fingerprint of Spot A
Gel coordinates: 16kDa, 4.2 (mwt, pI)](https://image.slidesharecdn.com/introtoms-250808182113-948f195e/85/IntrotoMS-ppt-presentation-master-in-phylosphy-50-320.jpg)
![500 610 720 830 940 1050
Mass (m/z)
0
6735.5
0
10
20
30
40
50
60
70
80
90
100
%
In
te
n
s
ity
Stitched PSD=>BC=>SM25=>AdvBC(32,0.5,0.1)[BP = 120.1, 50520]
y
4
(+
1
)
b
5
(+
1
)
y
8
(+
1
)
y
4
-
1
7
(+
1
)
a
5
(+
1
)
6
4
7
.4
7
1
4
.8
y
7
(+
1
)
A
F
Q
L
F
D
(+
1
)
-
1
7
,A
F
Q
L
F
D
(+
1
)
-
1
8
7
3
0
.1
9
7
3
.7
9
6
1
.0
8
1
9
.9
9
4
1
.5
b
7
(+
1
)
65 152 239 326 413 500
Mass (m/z)
0
5.1E+4
0
10
20
30
40
50
60
70
80
90
100
%
In
te
n
s
ity
Stitched PSD=>BC=>SM25=>AdvBC(32,0.5,0.1)[BP = 120.1, 50520]
F
y
1
(+
1
)
b
2
(+
1
)
F
Q
(+
1
)
Q
a
2
(+
1
)
b
4
(+
1
),Q
L
F
D
(+
1
)
-
2
8
L
b
1
-
1
8
(+
1
)
1
6
5
.1
3
6
5
.1
3
4
7
.1
y
2
(+
1
)
y
3
-
1
7
(+
1
)
Q
L
(+
1
)
-
2
8
y
1
-
1
7
(+
1
)
7
0
.0
y
3
(+
1
)
8
4
.0
Q
L
(+
1
)
b
3
-
1
8
(+
1
),A
F
Q
(+
1
)
-
1
7
2
2
9
.2
F
Q
L
(+
1
),Q
L
F
(+
1
)
F
D
(+
1
)
b
4
-
1
8
(+
1
)
MS/MS spectrum for tryptic peptide MH+
= 1025.5, EAFQLFDR, from
Spot A. An MS-Tag search using the fragment ions from this spectrum
confirmed the identity of Spot A as myosin light chain.](https://image.slidesharecdn.com/introtoms-250808182113-948f195e/85/IntrotoMS-ppt-presentation-master-in-phylosphy-54-320.jpg)
![Sequence TAG Example from MS/MS Spectrum
Peptide MW = 1345.70
y 1 1
y 1 0
y 9
y 8
y 7
y 6
y 5
y 4
y 3
y 2
y 1
b1 b2 b3 b4 b5
I/ L
a2
2 9 4 .2
b2 - H2 O
b3 - H2 O
b4 - H2 O
b5 - H2 O
b6 - H2 O
b5 - 2 ( H2 O)
200 400 600 800 1000 1200
m/z, amu
100
200
300
400
500
600
700
800
Sequence Tag (739.34)SVS(I/L)(1120.60)
739.34
1120.60
[M+2H]2+
S V I/L
S](https://image.slidesharecdn.com/introtoms-250808182113-948f195e/85/IntrotoMS-ppt-presentation-master-in-phylosphy-56-320.jpg)