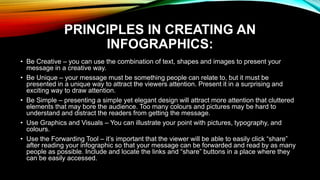
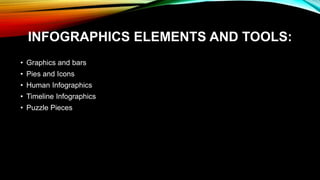
SlideShare a Scribd company logo
1 of 7
INFOGRAPHICS AND ICT
PROJECTS
EUGENE ADRIANNE L. GALANO
JANRYLLE ANIDILUM
JHONRIEL PARDS HABULAN
OBJECTIVES
• Identify a local or regional cause or issue for Social Change related to specific
professional tracks that can be addressed or tackled using an ICT Project for Social
Change.
• Analysed how target or intended users and audiences are expected to respond to
the proposed ICT project for Social Change on the basis of content, value, and user
experience.
• Integrate rich multimedia content in design and development to best enhance the
user experience and deliver content of an ICT Project for Social Change.
• Develop a working prototype of and ICT Project for Social Change .
• Understand how to work with peers and public/partners for the development of an
ICT project that advocates or mobilizes for a specific social change or cause.
DEVELOPING AN ICT PROJECT FOR
SOCIAL CHANGE
• To be able to succeed in the implementation of your ICT Project, it’s the team head
or project management is the discipline of planning, organising, securing and
managing resources for the successful completion of a task for project to meet
specific goals and objectives. The team should follow the stages of a project,
development and practice, effective communication and brainstorming discussion
on development.
PRINCIPLES OF VISUAL MESSAGE, DISIGNED
USING INFOGRAPHICS
• Infographics are visual presentations of information that use the elements of design to quickly communicate
an idea. Good infographics attract readers and are viewed where more easily than long texts article.
Therefore, infographics can deliver a message more easily which can spread around the world with the use
of pre-sharing tools.
Ways that infographics can be used:
• Presenting survey data - infographics are highly useful in presenting result gathered from survey data.
When organise infographics, it becomes much easier and faster to draw meaning from data.
• Simplifying a complicated concept - the core purpose of an infographics is to simplify a complex idea
which make them great educational tools, especially when presenting an overview of a topic instead of
an in-depth analysis.
• Explaining how things work – in addition, to simplifying complex ideas, infographics are often used to
reveal the mechanics behind how objects work. Skilled designers can crate infographics that pull apart
complex products like camera, iPhones, and clocks and graphically explain their core features.
• Comparison – when drawing comparisons, infographics help organise similarities and differences by
visually creating parallels that complement the information being presented. Comparison can be difficult
to express which words, sometimes to the point of being more confusing than revealing to the audience.
By presenting the same information in a nearly organised infographics, comparisons, become clearer.
PRINCIPLES IN CREATING AN
INFOGRAPHICS:
• Be Creative – you can use the combination of text, shapes and images to present your
message in a creative way.
• Be Unique – your message must be something people can relate to, but it must be
presented in a unique way to attract the viewers attention. Present it in a surprising and
exciting way to draw attention.
• Be Simple – presenting a simple yet elegant design will attract more attention that cluttered
elements that may bore the audience. Too many colours and pictures may be hard to
understand and distract the readers from getting the message.
• Use Graphics and Visuals – You can illustrate your point with pictures, typography, and
colours.
• Use the Forwarding Tool – it’s important that the viewer will be able to easily click “share”
after reading your infographic so that your message can be forwarded and read by as many
people as possible. Include and locate the links and “share” buttons in a place where they
can be easily accessed.
INFOGRAPHICS ELEMENTS AND TOOLS:
• Graphics and bars
• Pies and Icons
• Human Infographics
• Timeline Infographics
• Puzzle Pieces
QUIZ
1-4: WHAT ARE THE FOUR ELEMENTS OF INFOGRAPHIC ELEMENTS AND
TOLLS?
5-7: WHAT ARE THE THREE PRINCIPLE IN CREATING AN INFOGRAPHIC?
8-10: WHAT ARE THE THREE WAYS THAT INFOGRAPHICS CAN BE USED?

More Related Content

What's hot

Contextualized Online Search and Research Skills
Contextualized Online Search and Research SkillsContextualized Online Search and Research Skills
Contextualized Online Search and Research SkillsAngelito Quiambao
 
Planning-and-Conceptualizing-an-ICT-for-Social-Change (1).pdf
Planning-and-Conceptualizing-an-ICT-for-Social-Change (1).pdfPlanning-and-Conceptualizing-an-ICT-for-Social-Change (1).pdf
Planning-and-Conceptualizing-an-ICT-for-Social-Change (1).pdfEidene Joy Manuel
 
8 Collaborative ICT Development
8 Collaborative ICT Development8 Collaborative ICT Development
8 Collaborative ICT DevelopmentTeodoro Llanes II
 
Online Safety, Security, Ethics, and Netiquette - Empowerment Technologies
Online Safety, Security, Ethics, and Netiquette - Empowerment TechnologiesOnline Safety, Security, Ethics, and Netiquette - Empowerment Technologies
Online Safety, Security, Ethics, and Netiquette - Empowerment TechnologiesMark Jhon Oxillo
 
Emp tech q2_m12_l1_multimedia_and_ict_fv
Emp tech q2_m12_l1_multimedia_and_ict_fvEmp tech q2_m12_l1_multimedia_and_ict_fv
Emp tech q2_m12_l1_multimedia_and_ict_fvVivienPastores1
 
Module 1 Lesson 1.pptx
Module 1 Lesson 1.pptxModule 1 Lesson 1.pptx
Module 1 Lesson 1.pptxlevipoi
 
EMP TECH Q2 LESSON 1.pptx
EMP TECH Q2 LESSON 1.pptxEMP TECH Q2 LESSON 1.pptx
EMP TECH Q2 LESSON 1.pptxsherelynbalada1
 
Collaborative ICT Development - Empowerment Technologies
Collaborative ICT Development - Empowerment TechnologiesCollaborative ICT Development - Empowerment Technologies
Collaborative ICT Development - Empowerment TechnologiesMark Jhon Oxillo
 
Group 3 lesson 13 ict project publication and statistics
Group 3 lesson 13 ict project publication and statisticsGroup 3 lesson 13 ict project publication and statistics
Group 3 lesson 13 ict project publication and statisticsEricaVS
 
7 Imaging and Design for the Online Environment
7 Imaging and Design for the Online Environment7 Imaging and Design for the Online Environment
7 Imaging and Design for the Online EnvironmentTeodoro Llanes II
 
Online platforms for ICT Content Development
Online platforms for ICT Content DevelopmentOnline platforms for ICT Content Development
Online platforms for ICT Content DevelopmentAngelito Quiambao
 
Empowerment Technologies - Module 1
Empowerment Technologies - Module 1Empowerment Technologies - Module 1
Empowerment Technologies - Module 1Jesus Rances
 
Empowerment technologies
Empowerment technologiesEmpowerment technologies
Empowerment technologiesRufa Laguit
 
Ict project-publication-and-statistics
Ict project-publication-and-statisticsIct project-publication-and-statistics
Ict project-publication-and-statisticsJenniferandMichael
 
Imaging and Design for Online Environment
Imaging and Design for Online EnvironmentImaging and Design for Online Environment
Imaging and Design for Online EnvironmentAngelito Quiambao
 
Infographics and I.C.T Project
Infographics and I.C.T ProjectInfographics and I.C.T Project
Infographics and I.C.T ProjectDennis Morales
 
Online Platform Tools for ICT Content Development
Online Platform Tools for ICT Content Development Online Platform Tools for ICT Content Development
Online Platform Tools for ICT Content Development Christine Joy Benedicto
 
Module 8: ICT Projects for Social Awareness
Module 8: ICT Projects for Social AwarenessModule 8: ICT Projects for Social Awareness
Module 8: ICT Projects for Social AwarenessSherilyn Gabest
 
Imaging and Design for Online Environment
Imaging and Design for Online EnvironmentImaging and Design for Online Environment
Imaging and Design for Online EnvironmentRichard Meriveles
 

What's hot (20)

Contextualized Online Search and Research Skills
Contextualized Online Search and Research SkillsContextualized Online Search and Research Skills
Contextualized Online Search and Research Skills
 
Planning-and-Conceptualizing-an-ICT-for-Social-Change (1).pdf
Planning-and-Conceptualizing-an-ICT-for-Social-Change (1).pdfPlanning-and-Conceptualizing-an-ICT-for-Social-Change (1).pdf
Planning-and-Conceptualizing-an-ICT-for-Social-Change (1).pdf
 
8 Collaborative ICT Development
8 Collaborative ICT Development8 Collaborative ICT Development
8 Collaborative ICT Development
 
ICT as a Platform for Change
ICT as a Platform for Change ICT as a Platform for Change
ICT as a Platform for Change
 
Online Safety, Security, Ethics, and Netiquette - Empowerment Technologies
Online Safety, Security, Ethics, and Netiquette - Empowerment TechnologiesOnline Safety, Security, Ethics, and Netiquette - Empowerment Technologies
Online Safety, Security, Ethics, and Netiquette - Empowerment Technologies
 
Emp tech q2_m12_l1_multimedia_and_ict_fv
Emp tech q2_m12_l1_multimedia_and_ict_fvEmp tech q2_m12_l1_multimedia_and_ict_fv
Emp tech q2_m12_l1_multimedia_and_ict_fv
 
Module 1 Lesson 1.pptx
Module 1 Lesson 1.pptxModule 1 Lesson 1.pptx
Module 1 Lesson 1.pptx
 
EMP TECH Q2 LESSON 1.pptx
EMP TECH Q2 LESSON 1.pptxEMP TECH Q2 LESSON 1.pptx
EMP TECH Q2 LESSON 1.pptx
 
Collaborative ICT Development - Empowerment Technologies
Collaborative ICT Development - Empowerment TechnologiesCollaborative ICT Development - Empowerment Technologies
Collaborative ICT Development - Empowerment Technologies
 
Group 3 lesson 13 ict project publication and statistics
Group 3 lesson 13 ict project publication and statisticsGroup 3 lesson 13 ict project publication and statistics
Group 3 lesson 13 ict project publication and statistics
 
7 Imaging and Design for the Online Environment
7 Imaging and Design for the Online Environment7 Imaging and Design for the Online Environment
7 Imaging and Design for the Online Environment
 
Online platforms for ICT Content Development
Online platforms for ICT Content DevelopmentOnline platforms for ICT Content Development
Online platforms for ICT Content Development
 
Empowerment Technologies - Module 1
Empowerment Technologies - Module 1Empowerment Technologies - Module 1
Empowerment Technologies - Module 1
 
Empowerment technologies
Empowerment technologiesEmpowerment technologies
Empowerment technologies
 
Ict project-publication-and-statistics
Ict project-publication-and-statisticsIct project-publication-and-statistics
Ict project-publication-and-statistics
 
Imaging and Design for Online Environment
Imaging and Design for Online EnvironmentImaging and Design for Online Environment
Imaging and Design for Online Environment
 
Infographics and I.C.T Project
Infographics and I.C.T ProjectInfographics and I.C.T Project
Infographics and I.C.T Project
 
Online Platform Tools for ICT Content Development
Online Platform Tools for ICT Content Development Online Platform Tools for ICT Content Development
Online Platform Tools for ICT Content Development
 
Module 8: ICT Projects for Social Awareness
Module 8: ICT Projects for Social AwarenessModule 8: ICT Projects for Social Awareness
Module 8: ICT Projects for Social Awareness
 
Imaging and Design for Online Environment
Imaging and Design for Online EnvironmentImaging and Design for Online Environment
Imaging and Design for Online Environment
 

Similar to Intrographics and ict projects

Principles of data visualisation 2020
Principles of data visualisation 2020Principles of data visualisation 2020
Principles of data visualisation 2020Marié Roux
 
How to Communicate Effectively via Infographics - ColorWhistle
How to Communicate Effectively via Infographics - ColorWhistleHow to Communicate Effectively via Infographics - ColorWhistle
How to Communicate Effectively via Infographics - ColorWhistleColorWhistle
 
Introduction to Infographic Design
Introduction to Infographic DesignIntroduction to Infographic Design
Introduction to Infographic DesignAmanda Makulec
 
Creating an infographic
Creating an infographicCreating an infographic
Creating an infographicadamzurn
 
Principles of data visualisation 2021
Principles of data visualisation 2021Principles of data visualisation 2021
Principles of data visualisation 2021Marié Roux
 
principlesofdatavisualisation2021-210407141546.pdf
principlesofdatavisualisation2021-210407141546.pdfprinciplesofdatavisualisation2021-210407141546.pdf
principlesofdatavisualisation2021-210407141546.pdfKarteekMane1
 
Lesson 5 Manipulating Text, Graphics, and Images
Lesson 5 Manipulating Text, Graphics, and ImagesLesson 5 Manipulating Text, Graphics, and Images
Lesson 5 Manipulating Text, Graphics, and ImagesJuvywen
 
DESIGNING APPEALING INFOGRAPHICS.pptx
DESIGNING APPEALING INFOGRAPHICS.pptxDESIGNING APPEALING INFOGRAPHICS.pptx
DESIGNING APPEALING INFOGRAPHICS.pptxTumwine Edward
 
All about Infographics
All about Infographics All about Infographics
All about Infographics Renee Hobbs
 
lesson 12 research content for social advocacy in developing an ICT project.pptx
lesson 12 research content for social advocacy in developing an ICT project.pptxlesson 12 research content for social advocacy in developing an ICT project.pptx
lesson 12 research content for social advocacy in developing an ICT project.pptxMiguelHarryTorres
 
160126 lia s associates socmed_slideshare_infografis
160126 lia s associates socmed_slideshare_infografis160126 lia s associates socmed_slideshare_infografis
160126 lia s associates socmed_slideshare_infografisAmelia Sidik
 
Multimedia phase 1
Multimedia phase 1Multimedia phase 1
Multimedia phase 1Online
 
Empowerment Technology (Reporting).pptx
Empowerment Technology (Reporting).pptxEmpowerment Technology (Reporting).pptx
Empowerment Technology (Reporting).pptxLorenzePelicano
 
EUN briefing
EUN briefingEUN briefing
EUN briefingverityn
 

Similar to Intrographics and ict projects (20)

Infographics teachingtool
Infographics teachingtoolInfographics teachingtool
Infographics teachingtool
 
Principles of data visualisation 2020
Principles of data visualisation 2020Principles of data visualisation 2020
Principles of data visualisation 2020
 
How to Communicate Effectively via Infographics - ColorWhistle
How to Communicate Effectively via Infographics - ColorWhistleHow to Communicate Effectively via Infographics - ColorWhistle
How to Communicate Effectively via Infographics - ColorWhistle
 
Introduction to Infographic Design
Introduction to Infographic DesignIntroduction to Infographic Design
Introduction to Infographic Design
 
Creating an infographic
Creating an infographicCreating an infographic
Creating an infographic
 
An Overview of Infographics
An Overview of InfographicsAn Overview of Infographics
An Overview of Infographics
 
Principles of data visualisation 2021
Principles of data visualisation 2021Principles of data visualisation 2021
Principles of data visualisation 2021
 
principlesofdatavisualisation2021-210407141546.pdf
principlesofdatavisualisation2021-210407141546.pdfprinciplesofdatavisualisation2021-210407141546.pdf
principlesofdatavisualisation2021-210407141546.pdf
 
Lesson 5 Manipulating Text, Graphics, and Images
Lesson 5 Manipulating Text, Graphics, and ImagesLesson 5 Manipulating Text, Graphics, and Images
Lesson 5 Manipulating Text, Graphics, and Images
 
DESIGNING APPEALING INFOGRAPHICS.pptx
DESIGNING APPEALING INFOGRAPHICS.pptxDESIGNING APPEALING INFOGRAPHICS.pptx
DESIGNING APPEALING INFOGRAPHICS.pptx
 
Social media
Social mediaSocial media
Social media
 
All about Infographics
All about Infographics All about Infographics
All about Infographics
 
lesson 12 research content for social advocacy in developing an ICT project.pptx
lesson 12 research content for social advocacy in developing an ICT project.pptxlesson 12 research content for social advocacy in developing an ICT project.pptx
lesson 12 research content for social advocacy in developing an ICT project.pptx
 
Infograph Power!
Infograph Power!Infograph Power!
Infograph Power!
 
160126 lia s associates socmed_slideshare_infografis
160126 lia s associates socmed_slideshare_infografis160126 lia s associates socmed_slideshare_infografis
160126 lia s associates socmed_slideshare_infografis
 
042 160126 Bookclub: INFOGRAFIS
042 160126 Bookclub: INFOGRAFIS042 160126 Bookclub: INFOGRAFIS
042 160126 Bookclub: INFOGRAFIS
 
Multimedia phase 1
Multimedia phase 1Multimedia phase 1
Multimedia phase 1
 
Empowerment Technology (Reporting).pptx
Empowerment Technology (Reporting).pptxEmpowerment Technology (Reporting).pptx
Empowerment Technology (Reporting).pptx
 
EUN briefing
EUN briefingEUN briefing
EUN briefing
 
Designing for the customer experience
Designing for the customer experienceDesigning for the customer experience
Designing for the customer experience
 

Recently uploaded

Six Myths about Ontologies: The Basics of Formal Ontology
Six Myths about Ontologies: The Basics of Formal OntologySix Myths about Ontologies: The Basics of Formal Ontology
Six Myths about Ontologies: The Basics of Formal Ontologyjohnbeverley2021
 
JavaScript Usage Statistics 2024 - The Ultimate Guide
JavaScript Usage Statistics 2024 - The Ultimate GuideJavaScript Usage Statistics 2024 - The Ultimate Guide
JavaScript Usage Statistics 2024 - The Ultimate GuidePixlogix Infotech
 
Corporate and higher education May webinar.pptx
Corporate and higher education May webinar.pptxCorporate and higher education May webinar.pptx
Corporate and higher education May webinar.pptxRustici Software
 
Stronger Together: Developing an Organizational Strategy for Accessible Desig...
Stronger Together: Developing an Organizational Strategy for Accessible Desig...Stronger Together: Developing an Organizational Strategy for Accessible Desig...
Stronger Together: Developing an Organizational Strategy for Accessible Desig...caitlingebhard1
 
JohnPollard-hybrid-app-RailsConf2024.pptx
JohnPollard-hybrid-app-RailsConf2024.pptxJohnPollard-hybrid-app-RailsConf2024.pptx
JohnPollard-hybrid-app-RailsConf2024.pptxJohnPollard37
 
API Governance and Monetization - The evolution of API governance
API Governance and Monetization -  The evolution of API governanceAPI Governance and Monetization -  The evolution of API governance
API Governance and Monetization - The evolution of API governanceWSO2
 
Cloud Frontiers: A Deep Dive into Serverless Spatial Data and FME
Cloud Frontiers:  A Deep Dive into Serverless Spatial Data and FMECloud Frontiers:  A Deep Dive into Serverless Spatial Data and FME
Cloud Frontiers: A Deep Dive into Serverless Spatial Data and FMESafe Software
 
DBX First Quarter 2024 Investor Presentation
DBX First Quarter 2024 Investor PresentationDBX First Quarter 2024 Investor Presentation
DBX First Quarter 2024 Investor PresentationDropbox
 
TrustArc Webinar - Unified Trust Center for Privacy, Security, Compliance, an...
TrustArc Webinar - Unified Trust Center for Privacy, Security, Compliance, an...TrustArc Webinar - Unified Trust Center for Privacy, Security, Compliance, an...
TrustArc Webinar - Unified Trust Center for Privacy, Security, Compliance, an...TrustArc
 
Web Form Automation for Bonterra Impact Management (fka Social Solutions Apri...
Web Form Automation for Bonterra Impact Management (fka Social Solutions Apri...Web Form Automation for Bonterra Impact Management (fka Social Solutions Apri...
Web Form Automation for Bonterra Impact Management (fka Social Solutions Apri...Jeffrey Haguewood
 
Exploring Multimodal Embeddings with Milvus
Exploring Multimodal Embeddings with MilvusExploring Multimodal Embeddings with Milvus
Exploring Multimodal Embeddings with MilvusZilliz
 
Cloud Frontiers: A Deep Dive into Serverless Spatial Data and FME
Cloud Frontiers:  A Deep Dive into Serverless Spatial Data and FMECloud Frontiers:  A Deep Dive into Serverless Spatial Data and FME
Cloud Frontiers: A Deep Dive into Serverless Spatial Data and FMESafe Software
 
Rising Above_ Dubai Floods and the Fortitude of Dubai International Airport.pdf
Rising Above_ Dubai Floods and the Fortitude of Dubai International Airport.pdfRising Above_ Dubai Floods and the Fortitude of Dubai International Airport.pdf
Rising Above_ Dubai Floods and the Fortitude of Dubai International Airport.pdfOrbitshub
 
Introduction to use of FHIR Documents in ABDM
Introduction to use of FHIR Documents in ABDMIntroduction to use of FHIR Documents in ABDM
Introduction to use of FHIR Documents in ABDMKumar Satyam
 
The Zero-ETL Approach: Enhancing Data Agility and Insight
The Zero-ETL Approach: Enhancing Data Agility and InsightThe Zero-ETL Approach: Enhancing Data Agility and Insight
The Zero-ETL Approach: Enhancing Data Agility and InsightSafe Software
 
Finding Java's Hidden Performance Traps @ DevoxxUK 2024
Finding Java's Hidden Performance Traps @ DevoxxUK 2024Finding Java's Hidden Performance Traps @ DevoxxUK 2024
Finding Java's Hidden Performance Traps @ DevoxxUK 2024Victor Rentea
 
AI+A11Y 11MAY2024 HYDERBAD GAAD 2024 - HelloA11Y (11 May 2024)
AI+A11Y 11MAY2024 HYDERBAD GAAD 2024 - HelloA11Y (11 May 2024)AI+A11Y 11MAY2024 HYDERBAD GAAD 2024 - HelloA11Y (11 May 2024)
AI+A11Y 11MAY2024 HYDERBAD GAAD 2024 - HelloA11Y (11 May 2024)Samir Dash
 
Why Teams call analytics are critical to your entire business
Why Teams call analytics are critical to your entire businessWhy Teams call analytics are critical to your entire business
Why Teams call analytics are critical to your entire businesspanagenda
 
Elevate Developer Efficiency & build GenAI Application with Amazon Q​
Elevate Developer Efficiency & build GenAI Application with Amazon Q​Elevate Developer Efficiency & build GenAI Application with Amazon Q​
Elevate Developer Efficiency & build GenAI Application with Amazon Q​Bhuvaneswari Subramani
 
CNIC Information System with Pakdata Cf In Pakistan
CNIC Information System with Pakdata Cf In PakistanCNIC Information System with Pakdata Cf In Pakistan
CNIC Information System with Pakdata Cf In Pakistandanishmna97
 

Recently uploaded (20)

Six Myths about Ontologies: The Basics of Formal Ontology
Six Myths about Ontologies: The Basics of Formal OntologySix Myths about Ontologies: The Basics of Formal Ontology
Six Myths about Ontologies: The Basics of Formal Ontology
 
JavaScript Usage Statistics 2024 - The Ultimate Guide
JavaScript Usage Statistics 2024 - The Ultimate GuideJavaScript Usage Statistics 2024 - The Ultimate Guide
JavaScript Usage Statistics 2024 - The Ultimate Guide
 
Corporate and higher education May webinar.pptx
Corporate and higher education May webinar.pptxCorporate and higher education May webinar.pptx
Corporate and higher education May webinar.pptx
 
Stronger Together: Developing an Organizational Strategy for Accessible Desig...
Stronger Together: Developing an Organizational Strategy for Accessible Desig...Stronger Together: Developing an Organizational Strategy for Accessible Desig...
Stronger Together: Developing an Organizational Strategy for Accessible Desig...
 
JohnPollard-hybrid-app-RailsConf2024.pptx
JohnPollard-hybrid-app-RailsConf2024.pptxJohnPollard-hybrid-app-RailsConf2024.pptx
JohnPollard-hybrid-app-RailsConf2024.pptx
 
API Governance and Monetization - The evolution of API governance
API Governance and Monetization -  The evolution of API governanceAPI Governance and Monetization -  The evolution of API governance
API Governance and Monetization - The evolution of API governance
 
Cloud Frontiers: A Deep Dive into Serverless Spatial Data and FME
Cloud Frontiers:  A Deep Dive into Serverless Spatial Data and FMECloud Frontiers:  A Deep Dive into Serverless Spatial Data and FME
Cloud Frontiers: A Deep Dive into Serverless Spatial Data and FME
 
DBX First Quarter 2024 Investor Presentation
DBX First Quarter 2024 Investor PresentationDBX First Quarter 2024 Investor Presentation
DBX First Quarter 2024 Investor Presentation
 
TrustArc Webinar - Unified Trust Center for Privacy, Security, Compliance, an...
TrustArc Webinar - Unified Trust Center for Privacy, Security, Compliance, an...TrustArc Webinar - Unified Trust Center for Privacy, Security, Compliance, an...
TrustArc Webinar - Unified Trust Center for Privacy, Security, Compliance, an...
 
Web Form Automation for Bonterra Impact Management (fka Social Solutions Apri...
Web Form Automation for Bonterra Impact Management (fka Social Solutions Apri...Web Form Automation for Bonterra Impact Management (fka Social Solutions Apri...
Web Form Automation for Bonterra Impact Management (fka Social Solutions Apri...
 
Exploring Multimodal Embeddings with Milvus
Exploring Multimodal Embeddings with MilvusExploring Multimodal Embeddings with Milvus
Exploring Multimodal Embeddings with Milvus
 
Cloud Frontiers: A Deep Dive into Serverless Spatial Data and FME
Cloud Frontiers:  A Deep Dive into Serverless Spatial Data and FMECloud Frontiers:  A Deep Dive into Serverless Spatial Data and FME
Cloud Frontiers: A Deep Dive into Serverless Spatial Data and FME
 
Rising Above_ Dubai Floods and the Fortitude of Dubai International Airport.pdf
Rising Above_ Dubai Floods and the Fortitude of Dubai International Airport.pdfRising Above_ Dubai Floods and the Fortitude of Dubai International Airport.pdf
Rising Above_ Dubai Floods and the Fortitude of Dubai International Airport.pdf
 
Introduction to use of FHIR Documents in ABDM
Introduction to use of FHIR Documents in ABDMIntroduction to use of FHIR Documents in ABDM
Introduction to use of FHIR Documents in ABDM
 
The Zero-ETL Approach: Enhancing Data Agility and Insight
The Zero-ETL Approach: Enhancing Data Agility and InsightThe Zero-ETL Approach: Enhancing Data Agility and Insight
The Zero-ETL Approach: Enhancing Data Agility and Insight
 
Finding Java's Hidden Performance Traps @ DevoxxUK 2024
Finding Java's Hidden Performance Traps @ DevoxxUK 2024Finding Java's Hidden Performance Traps @ DevoxxUK 2024
Finding Java's Hidden Performance Traps @ DevoxxUK 2024
 
AI+A11Y 11MAY2024 HYDERBAD GAAD 2024 - HelloA11Y (11 May 2024)
AI+A11Y 11MAY2024 HYDERBAD GAAD 2024 - HelloA11Y (11 May 2024)AI+A11Y 11MAY2024 HYDERBAD GAAD 2024 - HelloA11Y (11 May 2024)
AI+A11Y 11MAY2024 HYDERBAD GAAD 2024 - HelloA11Y (11 May 2024)
 
Why Teams call analytics are critical to your entire business
Why Teams call analytics are critical to your entire businessWhy Teams call analytics are critical to your entire business
Why Teams call analytics are critical to your entire business
 
Elevate Developer Efficiency & build GenAI Application with Amazon Q​
Elevate Developer Efficiency & build GenAI Application with Amazon Q​Elevate Developer Efficiency & build GenAI Application with Amazon Q​
Elevate Developer Efficiency & build GenAI Application with Amazon Q​
 
CNIC Information System with Pakdata Cf In Pakistan
CNIC Information System with Pakdata Cf In PakistanCNIC Information System with Pakdata Cf In Pakistan
CNIC Information System with Pakdata Cf In Pakistan
 

Intrographics and ict projects

  • 1. INFOGRAPHICS AND ICT PROJECTS EUGENE ADRIANNE L. GALANO JANRYLLE ANIDILUM JHONRIEL PARDS HABULAN
  • 2. OBJECTIVES • Identify a local or regional cause or issue for Social Change related to specific professional tracks that can be addressed or tackled using an ICT Project for Social Change. • Analysed how target or intended users and audiences are expected to respond to the proposed ICT project for Social Change on the basis of content, value, and user experience. • Integrate rich multimedia content in design and development to best enhance the user experience and deliver content of an ICT Project for Social Change. • Develop a working prototype of and ICT Project for Social Change . • Understand how to work with peers and public/partners for the development of an ICT project that advocates or mobilizes for a specific social change or cause.
  • 3. DEVELOPING AN ICT PROJECT FOR SOCIAL CHANGE • To be able to succeed in the implementation of your ICT Project, it’s the team head or project management is the discipline of planning, organising, securing and managing resources for the successful completion of a task for project to meet specific goals and objectives. The team should follow the stages of a project, development and practice, effective communication and brainstorming discussion on development.
  • 4. PRINCIPLES OF VISUAL MESSAGE, DISIGNED USING INFOGRAPHICS • Infographics are visual presentations of information that use the elements of design to quickly communicate an idea. Good infographics attract readers and are viewed where more easily than long texts article. Therefore, infographics can deliver a message more easily which can spread around the world with the use of pre-sharing tools. Ways that infographics can be used: • Presenting survey data - infographics are highly useful in presenting result gathered from survey data. When organise infographics, it becomes much easier and faster to draw meaning from data. • Simplifying a complicated concept - the core purpose of an infographics is to simplify a complex idea which make them great educational tools, especially when presenting an overview of a topic instead of an in-depth analysis. • Explaining how things work – in addition, to simplifying complex ideas, infographics are often used to reveal the mechanics behind how objects work. Skilled designers can crate infographics that pull apart complex products like camera, iPhones, and clocks and graphically explain their core features. • Comparison – when drawing comparisons, infographics help organise similarities and differences by visually creating parallels that complement the information being presented. Comparison can be difficult to express which words, sometimes to the point of being more confusing than revealing to the audience. By presenting the same information in a nearly organised infographics, comparisons, become clearer.
  • 5. PRINCIPLES IN CREATING AN INFOGRAPHICS: • Be Creative – you can use the combination of text, shapes and images to present your message in a creative way. • Be Unique – your message must be something people can relate to, but it must be presented in a unique way to attract the viewers attention. Present it in a surprising and exciting way to draw attention. • Be Simple – presenting a simple yet elegant design will attract more attention that cluttered elements that may bore the audience. Too many colours and pictures may be hard to understand and distract the readers from getting the message. • Use Graphics and Visuals – You can illustrate your point with pictures, typography, and colours. • Use the Forwarding Tool – it’s important that the viewer will be able to easily click “share” after reading your infographic so that your message can be forwarded and read by as many people as possible. Include and locate the links and “share” buttons in a place where they can be easily accessed.
  • 6. INFOGRAPHICS ELEMENTS AND TOOLS: • Graphics and bars • Pies and Icons • Human Infographics • Timeline Infographics • Puzzle Pieces
  • 7. QUIZ 1-4: WHAT ARE THE FOUR ELEMENTS OF INFOGRAPHIC ELEMENTS AND TOLLS? 5-7: WHAT ARE THE THREE PRINCIPLE IN CREATING AN INFOGRAPHIC? 8-10: WHAT ARE THE THREE WAYS THAT INFOGRAPHICS CAN BE USED?