Download as PDF, PPTX

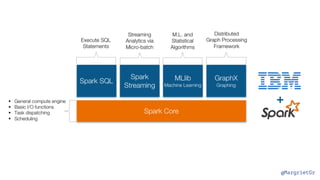
![@MargrietGr
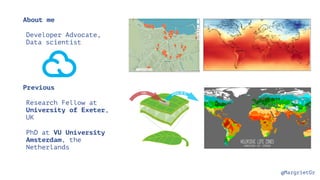
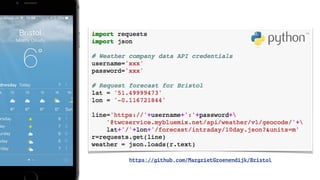
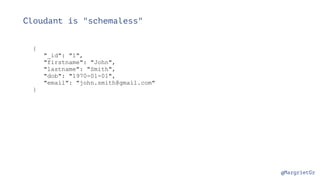
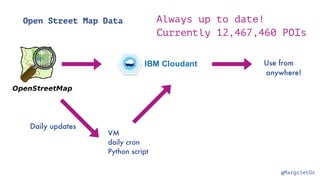
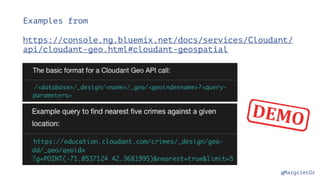
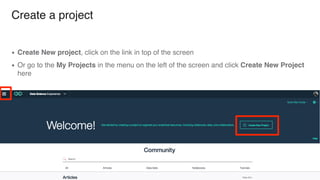
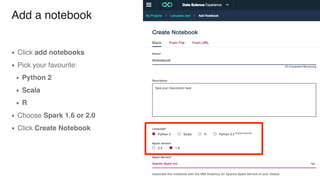
Cloudant is "schemaless"
{
"_id": "1",
"firstname": "John",
"lastname": "Smith",
"dob": "1970-01-01",
"email": "john.smith@gmail.com",
"confirmed": true,
"tags": ["tall", "glasses"]
}](https://image.slidesharecdn.com/170227watsonopendata-170228171041/85/Introduction-to-the-IBM-Watson-Data-Platform-24-320.jpg)
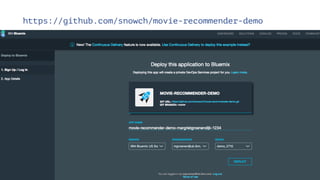
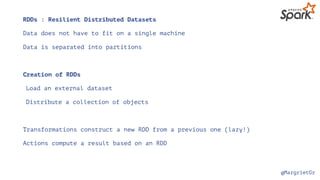
![@MargrietGr
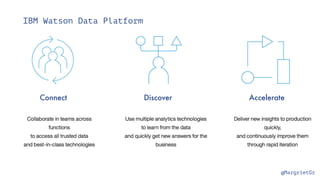
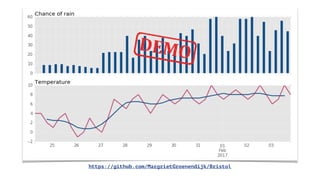
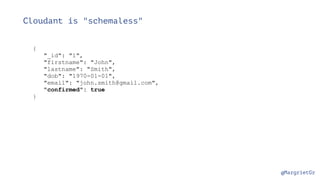
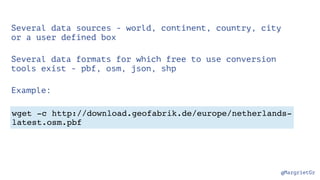
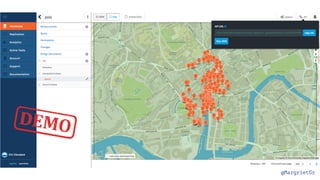
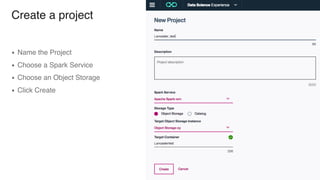
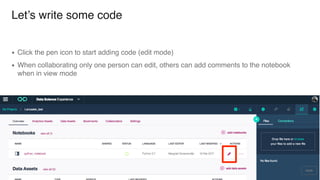
Cloudant is "schemaless"
{
"_id": "1",
"firstname": "John",
"lastname": "Smith",
"dob": "1970-01-01",
"email": "john.smith@gmail.com",
"confirmed": true,
"tags": ["tall", "glasses"],
"address" : {
"number": 14,
"street": "Front Street",
"town": "Luton",
"postcode": "LU1 1AB"
}
}](https://image.slidesharecdn.com/170227watsonopendata-170228171041/85/Introduction-to-the-IBM-Watson-Data-Platform-25-320.jpg)
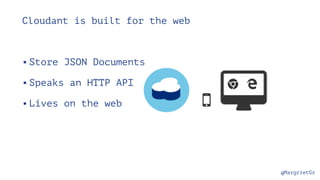
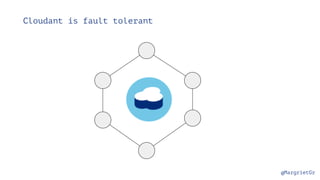
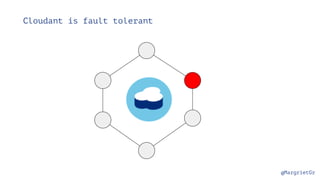
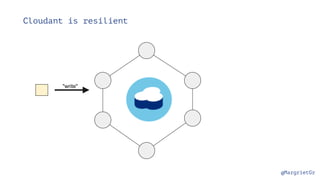

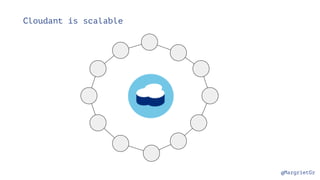
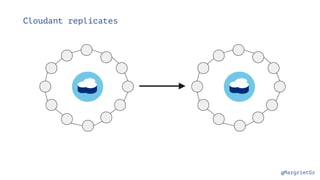
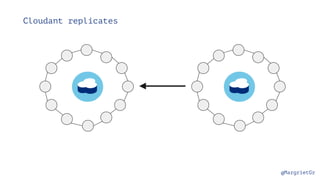
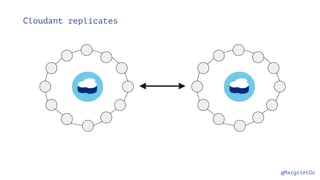
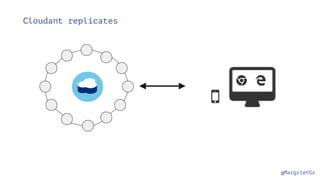


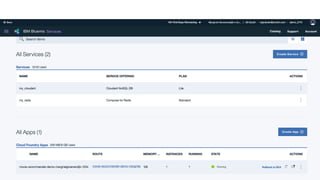
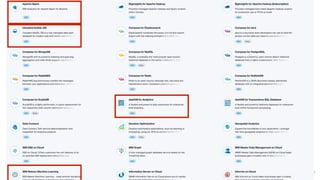
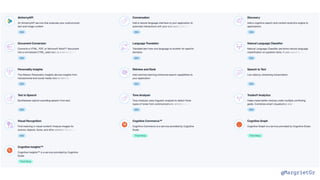
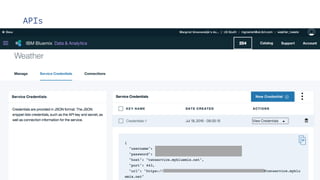
The document discusses IBM Watson Data Platform and its features, focusing on the Cloudant database and its schemaless design for storing JSON documents. It emphasizes the platform's fault tolerance, scalability, and ability to integrate with various data sources and services like Apache Spark and DashDB. Additionally, it provides examples of utilizing open data and APIs, along with steps for creating projects within the IBM Data Science Experience.


![[DSC Europe 25] Ivan Lukovic & Marija Djukic - From Data to Value: Why Maturi...](https://cdn.slidesharecdn.com/ss_thumbnails/ahrfps8xr6knowwhacxh-1-ivan-marija-dsc-2025-ld-v1-presentation-260115093812-be21adfc-thumbnail.jpg?width=640&height=640&fit=bounds)


![[DSC Europe 25] Elena Menshikova - AI-Powered Operational Excellence: Revolut...](https://cdn.slidesharecdn.com/ss_thumbnails/es6nholbqy3zaao2c2yd-2-elena-menshikova-data-ai-in-decision-making-260115093812-4fba8b38-thumbnail.jpg?width=640&height=640&fit=bounds)